≡ Menu

My preferred way to come up with NFL team ratings and NFL strength of schedule ratings is to trust the experts: in this case, the Vegas oddsmakers. Every year (or at least the years where I remember to do so), after Vegas releases the point spreads for every game, I take those weekly “ratings” to derive the Vegas ratings are for each team. Hence the title of today’s post: we can use the Vegas point spreads in each game to derive the implied ratings by the oddsmakers (in this case, Action Network) for each team.

The way to generate team ratings is to take the point spread in each game, adjust for home field (except for the two international games), and then determine by how many points Vegas thinks Team A is better than Team B. For example, when the Jets are 4.5-point underdogs to the Panthers in Carolina, we can imply that Carolina is viewed as 2 points better than the Jets (I am using 2.5 points for home field advantage). Using the iterative SRS process, and because the transitive property of point spreads applies, we can generate team ratings based on the 272 point spreads involved. [continue reading…]

{ 0 comments }

The Patriots And The Point Spread Under Tom Brady

Tomorrow, the Patriots will be 15-point favorites to win on the road in Washington. This is the third time in four weeks that New England is favored to win by more than two touchdowns. The Patriots had been favored in 69 consecutive games until the 2018 AFC Championship Game, but the Patriots have quickly resumed their usual role as favorites.

The graph below shows the point spread in every Patriots game since 2001. The games are colored based on whether it was a regular season game, a playoff game, or a game without Tom Brady. [continue reading…]

{ 0 comments }

Largest Point Spreads in Franchise History

Did you know: Detroit, Tampa Bay, and Cleveland have never been 14-point favorites in any game since 1978? In December 1995, facing the expansion Jaguars quarterbacked by backup Steve Beuerlein, the Lions were 13-point favorites.  That is the largest points spread the team has had since ’78, and the playoff-bound Lions won 44-0.

In 2005, in a game against the Katrina Saints with backup Todd Bouman, the Bucs were 13-point favorites. This was the last game of the regular season, and the host Bucs scored a late defensive touchdown to cover, 27-13.  Tampa Bay would finish the year 11-5.

And finally, we have the Browns.  In 1995, against those same expansion Jaguars, the old Browns were 13.5 point favorites coming off of a bye.  But for the first time, a Bill Belichick-led favorite was shocked by a Tom Coughlin-led underdog, as the Jaguars won 23-15.  From a points spread perspective, this was actually a bigger upset than the 2007 Super Bowl!  The largest points spread for the new Browns came in the final game of the 2007 season, where Cleveland beat San Francisco 20-7 as 11.5-point favorites.

The table below shows the largest points spread for each team in a game since 1978. [continue reading…]

{ 0 comments }

Luke Falk, the Patriots, and Scott Zolak

Luke Falk, who came on in relief for the Jets in week 2.

On Sunday, the Jets will be a sacrificial lamb for the enjoyment of 70,000 fans in Foxboro. New York is a 23-point underdog to the Patriots, making this one of the largest point spreads in NFL history.  The Jets have lost 12 straight regular season games in Gilette Stadium to the Tom Brady Patriots, with the last victory coming back in 2006 (during this span, the Jets beat New England once without Brady, in ’08, and also in the 2010 playoffs). 

Remarkably, New York was an underdog of over 2 TDs in each of the team’s last three games in New England, and a 3-TD underdog against the ’07 Patriots. And yet it is Sunday’s matchup that brings the largest points spread in Jets history. The table below shows the points spread in each Jets game in Foxboro during Brady’s time with the team prior to 2019 (as for 2001, that is not included; the Jets game in Foxboro that year was the origin story for Brady).

 
Vegas Vegas Vegas Vegas
Tm Year Date Opp Week G# Day Result Spread vs. Line Over/Under OU Result
NYJ 2018 2018-12-30 @ NWE 17 16 Sun L 3-38 14.5 not covered 46.5 under
NYJ 2017 2017-12-31 @ NWE 17 16 Sun L 6-26 17.0 not covered 43.5 under
NYJ 2016 2016-12-24 @ NWE 16 15 Sat L 3-41 17.0 not covered 45.0 under
NYJ 2015 2015-10-25 @ NWE 7 6 Sun L 23-30 7.5 covered 47.5 over
NYJ 2014 2014-10-16 @ NWE 7 7 Thu L 25-27 9.5 covered 44.5 over
NYJ 2013 2013-09-12 @ NWE 2 2 Thu L 10-13 11.5 covered 43.0 under
NYJ 2012 2012-10-21 @ NWE 7 7 Sun L 26-29 10.5 covered 47.0 over
NYJ 2011 2011-10-09 @ NWE 5 5 Sun L 21-30 7.5 not covered 50.0 over
NYJ 2010 2011-01-16 @ NWE 19 18 Sun W 28-21 9.5 covered 45.0 over
NYJ 2010 2010-12-06 @ NWE 13 12 Mon L 3-45 4.0 not covered 44.5 over
NYJ 2009 2009-11-22 @ NWE 11 10 Sun L 14-31 11.0 not covered 45.0 push
NYJ 2007 2007-12-16 @ NWE 15 14 Sun L 10-20 20.5 covered 41.0 under
NYJ 2006 2007-01-07 @ NWE 18 17 Sun L 16-37 9.0 not covered 38.5 over
NYJ 2006 2006-11-12 @ NWE 10 9 Sun W 17-14 10.5 covered 38.0 under
NYJ 2005 2005-12-04 @ NWE 13 12 Sun L 3-16 7.5 not covered 42.5 under
NYJ 2004 2004-10-24 @ NWE 7 6 Sun L 7-13 6.0 push 43.5 under
NYJ 2003 2003-09-21 @ NWE 3 3 Sun L 16-23 6.0 not covered 38.0 over
NYJ 2002 2002-12-22 @ NWE 16 15 Sun W 30-17 3.5 covered 41.0 over

But the most shocking thing to me isn’t that the Jets are heavy underdogs, but that the over/under for the game is just 43 points! This means that Vegas is setting the Over/Under on the Jets points total at 10 points, and the Patriots total at 33 points. I mean, I know the Jets are down to third-string quarterback Luke Falk, but a 10-point total for one team is really, really low.

Since 1978, there have only been 45 times where a team, based on the Vegas point spread and over/under, was projected to score under 11 points. The Jets against the Patriots will be the 46th, but New England has not always been on the positive side of things. Before there were Patriots fans, the team once traveled to Arrowhead Stadium in 1992 to face the mighty Chiefs.  Kansas City, with Neil Smith, Derrick Thomas, and Dale Carter, had a pretty good defense in those days, but the real issue was the Patriots offense.  Quarterbacked by Scott Zolak, the 2-11 Patriots had been shut out in back to back games entering the trip to Kansas City and had gained a total of 199 yards of offense.

So on December 13th, 1992, on a cold and rainy day, the Chiefs were favored to win by 16.5 points, and the over/under was 33 points. That means New England was expected to score only 8.25 points, with Kansas City projected to score 24.75 points. Kansas City ultimately won, 27-20, with the Patriots scoring touchdowns once on defense and once after a turnover gaave the team the ball at the 8-yard line.

[continue reading…]

{ 0 comments }

First NFL Starts By Backup Quarterbacks And The Point Spread

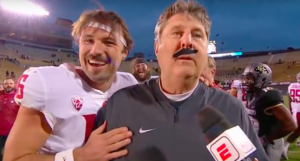
Minshew and Leach at Washington State

Jaguars rookie Gardner Minshew is making his first NFL start today, as Jacksonville starting quarterback Nick Foles is out with a broken left calvicle. Minshew replaced Foles in week 1 and promptly had one of the best passing performances any player has ever had in his first NFL game, at least if you don’t adjust for era. He completed 22 of 25 passes for 275 yards and 2 TDs with one interception, far exceeding how you would expect a rookie 6th round pick would perform in a season opener.

You might think this would mean Vegas would have high hopes for Minshew, who starred at Washington State under Mike Leach. Together with Minshew and his mustache, he “led the Cougars to 10 wins for the sixth time in program history.”

You might think that this would mean Vegas would be buying on Minshew today against Houston, but that’s not the case: the Jaguars are 8-point underdogs in Houston. Jason Lisk recently wrote about Minshew in the context of the point spread in games started by non-first round backup quarterbacks.

That made me wonder: what would cause a team starting a “player like Minshew” to be favored? I looked at all quarterbacks since 1978 who: [continue reading…]

{ 0 comments }

Seven years ago, Neil Paine provided the formula for predicting the expected winning percentage for the home team at the start of a game, based on the Vegas point spread.  There were only 5 upsets where the favorite list, and a sixth game that was a tie with a 2.5-point spread.  The six biggest favorites all won, making this a pretty by-the-book week.

The table below shows the results of each game from the perspective of the home teams in week 1.  The “Expected W%” column shows the expected winning percentage of the home team based on the Vegas point spread; the Eagles were -10.5, so Philadelphia had a 78% chance of winning; the Dolphins were +7, so they had a 31% chance of winning.  The final column shows how likely or unlikely the result was: if the favorite won, the expected winning percentage number was used; if the favorite lost, the expected winning percentage of the underdog was used.  So when the Browns lost, that game gets marked as a 35% likelihood game. [continue reading…]

{ 0 comments }

2019 Pre-Season Wins Totals: Who Rose And Fell?

Back in May, I produced implied Vegas team ratings from the points spreads released by CG Technology. Before the Thursday Night Kickoff game between the Packers and Bears (the less said about that game, the better), Vegas released the final over/under wins totals for each of the 32 teams.

Which made me curious: who are the biggest risers and fallers since May?

The graph below shows the 32 teams. On the horizontal X-Axis is the the expected margin of victory for each team over their 16 games, based on the points spreads released in May (the units are points per game differential).  This incorporates both strength of schedule and home field advantage — it is the actual expected score at the end of the game.  The Y-Axis shows the wins total for each team as of September 5th, which also of course incorporates SOS and HFA. [continue reading…]

{ 0 comments }

Implied SRS Ratings For the NFL in 2019: Every Game

Yesterday, I published the implied SRS ratings from the Vegas point spreads produced last week. Today, I want to publish the weekly point spreads, along with some notes.

With 240 games involved, each team’s rating gets generated by looking at the point spread in their game and the point spreads in all other games by them, and the point spreads in all other games by their opponent, and the games for their opponent’s opponents, and so on. For the most part, the results match up pretty well. For example, in week 7, Houston is a 4-point road underdog in Indianapolis, and in week 11, the Texans are a 2-point home favorite against the Colts. The Steelers are 9-point home favorites against Cincinnati in week 4, and Pittsburgh is a 3-point road favorite against the Bengals in week 12.

For the most part, after we have derived each team’s rating, the point spreads then make a lot of sense. Pittsburgh has an SRS of +1.5 and Cincinnati has an SRS of -4.3, so it makes perfect sense that the Steelers would be 9-point home favorites and 3-point road favorites against the Bengals. But there are two games that don’t make much sense.

In week 8, the Bengals are facing the Rams in London. Los Angeles has an SRS rating of +5.4, making them 9.8 points better than Cincinnati. And if anything, home field should favor Cincinnati, as this is a really far trip for LA. And yet the Rams are 13-point favorites! In addition, the Seahawks have an SRS rating of +1.9, while the Falcons have an SRS rating of +0.4. All else being equal, the Seahawks should be 1.5 point favorites on a neutral field and 1.5-point dogs on the road. And yet when Seattle flies cross country to Atlanta, it is the Seahawks that are 1.5-point favorites. Weird.

Other than those games, all other point spreads are within 2 points of what we would project based on the SRS ratings of the two teams and the location of the game. This is why you don’t really need many games to come up with implied SRS ratings: for the most part, Vegas uses their team ratings to set lines, and the transitive property is applicable here (and matchup strengths are not).

Below are the point spreads for every game this season. Here’s how to read the table, which is fully sortable and searchable. Arizona has an SRS rating of -5.8, and in week 1, hosts Detroit who has an SOS of -3.3. The point spread in that game is a pick’em, and based on that point spread, the expected MOV is the Lions by 3 points. [continue reading…]

{ 0 comments }

Belichick is ecstatic after checking out his team’s schedule.

After the release of the 2019 Schedule, the next big item on the agenda is figuring out who are the best and worst teams in the NFL. Every year, CG Technology releases point spreads for each of the first 240 games of the NFL season (i.e., spreads for every game during each of the first 16 weeks). And, every year, I then use those weekly ratings to derive the Vegas ratings are for each team. Hence the title of today’s post: we can use the Vegas point spreads in each game to derive the implied ratings by CG Technology for each team.

The way to do this is to take the point spread in each game, adjust for home field (except for the five international games), and then determine by how many points Vegas thinks Team A is better than Team B. For example, when the Jets are favored by 6 points in a home game against the Dolphins, we can take this to mean that Vegas thinks New York is about three points better than Miami. When we see that the Jets and Dolphins game is a pick’em for the matchup in Miami, this helps reinforce that view. And when Vegas says the Jets are a pick’em against the Browns at home, that tells us that Vegas thinks the Jets are about 3 points worse than the Browns *and* that the Dolphins are about 6 points worse than Cleveland. Using the iterative SRS process, and because the transitive property of point spreads applies, we can generate team ratings based on the 240 point spreads involved.

Here’s how to read the table below, in each case excluding week 17 action. After adjusting for home field advantage, the Patriots are expected to beat their average opponent by 6.6 points. On average, New England’s opponents (after adjusting for *their* strength of schedule) are 1.0 points below average, which means the Patriots are expected to be 5.5 points better than average (difference due to rounding). That’s the best in the league; the worst team in the league is the Cardinals. [continue reading…]

{ 1 comment }

Team Records Against The Spread in 2017 and 2018

I have bad news for those of you hoping to get rich by picking games against the spread: it remains very difficult.

In 2017, the Cleveland Browns went 4-12 against the spread, the worst record in the NFL. In 2018, the Browns went 10-6 against the spread. In 2017, the Jets were not very good, but did manage to go 9-6-1 against the spread; last year, the Jets were not very good, and went 5-10-1 against the spread.

Some teams are good both years — the Bears were 9-6-1 against the spread in ’17 and then a league-best 12-4 ATS in ’18 — but there isn’t much of a correlation between year over year records. In fact, the correlation coefficient between records against the spread in 2017 and 2018 was an irrelevant 0.02. The graph below shows each team’s ATS winning percentage in ’17 (X-Axis) and ’18 (Y-Axis). You can see the raw data here.
[continue reading…]

{ 0 comments }

Two years ago, I wrote about how the Patriots under Tom Brady were on a remarkable streak. At the time, the Patriots had been favored in 33 consecutive games where Brady was the starting quarterback (during his suspension during DeflateGate, New England was a 9-point underdog against the Cardinals in a game Jimmy Garoppolo started, and a pick’em in a game against the Texans that Jacoby Brissett started; New England won both games).

Since I wrote that article, the Patriots were favored in all 19 games in 2017, and in all 17 games so far during the 2018 season. That brings the total up to an absurd 69 consecutive games that the Patriots have been favored in when Brady is the starting quarterback. And 70 games ago was Super Bowl XLIX, when the Patriots and Seahawks game was a pick’em. That means you have to go back to a game against the Packers in November 2014 to find the last time Brady took the field in a game the Patriots were underdogs.

The graph below shows every Patriots regular (in blue) and playoff (in red) game since 2010.  The non-Brady games at the start of the 2015 season are shown in black circles.  Since point spreads are typically displayed like “Patriots -7”, the Y-Axis shows the point spread but in reverse order (so the Patriots mostly occupy the top half of the graph).  The X-Axis shows the year. [continue reading…]

{ 4 comments }

In week 1, the average over/under across 16 games was 44.8. In 9 of those games, the over hit.

Week 2 was when the passing explosion began; in 8 games that week, the teams combined for 48+ points, and in the other 8, teams failed to top 41 points. Nearly every over/under is between 41 and 48 points, so the O/U didn’t matter much this week: in the 8 games that produced 48+ points, the over hit, and in the other 8 games, the under hit.

But that doesn’t mean Vegas wasn’t aware of the passing explosion. The average over/under in week 2 was 45.0, but it jumped to 46.1 in week 3. Once again, we had a 41/48 split: no team scored 42, 43, 44, 45, 46, or 47 points in week 3. So the over/under didn’t matter: 8 games had 48+ points scored and went over, and 8 games had 41 or fewer points and went under. But Vegas had already begun raising the line.

How much? Week 4 had an average over/under of 46.7! And yet the over was still the good bet, as 9 of 15 games went over. This despite the rare event of two games producing 50+ points and still going under! In week 4, 10 out of 15 games combined for 49 or more points, in the greatest passing week in NFL history.

So in week 5, the over/under average jumped to 47.3…. and the over still hit more often than not! There were 8 games with 46+ points scored (7 had 50+ points scored), and the over hit in all of them. The other 7 games all went under, including two games with 44 points scored.

And last week the over/under average was 46.8, perhaps artificially lower because the Saints and Lions (who had 50+ point over/under lines in week 5) were on bye. And yet in week 6, 9 out of 15 games went over.

The table below shows the weekly over/under results this year. The Under has never been a winner, and the books seem to be doing all they can to make over/unders high enough to get people to bet the under: [continue reading…]

{ 0 comments }

Buffalo/Minnesota Was Supposed To Be A Blowout: And It Was

The Bills/Vikings game today was supposed to be a blowout. Minnesota was favored by 16.5 points, which made a lot of sense: the Vikings are one of the best teams in the league, while Buffalo ranked 31st in scoring (11.5 points/game) and scoring defense (39.0) through two weeks.

Since 1978, there have been 67 games where a team was favored by more than 14 points, and a team won by more than 14 points. Today was the 67th such game, but it was the first where the winning team was the underdog. That’s right: Buffalo pulled the massive upset, winning 27-6 (and leading 27-0 for over 30 minutes until a late Vikings touchdown).

So yes, this is the first time in history (well, since at least 1978) a team has won by 15+ points while being an underdog of 15+ points. The graph below shows all games since 1978 where a team was an underdog of 14+ points. The point spread is on the X-Axis (and remember, an underdog of 16.5 points would be listed at +16.5). On the Y-Axis is the final points differential. As you would expect, much of data is bunched in the bottom right quadrant of the graph — this indicates a large positive point spread on the X-Axis and a large negative points differential on the Y-Axis.  But the Bills/Vikings game was the big outlier, at +16.5, +21. [continue reading…]

{ 1 comment }

The Browns Are Favored on Thursday Night Football

Stop the presses: Cleveland is a favorite this week. The Browns host the Jets on Thursday night, and as of Tuesday evening, are 3-point favorites. That is breaking news, and it would really be breaking news if the Browns won. The 2015, 2016, and 2017 seasons, along with the first two games of 2018, give us a nice 50-game sample for Cleveland. And over the team’s last 50 games, they have been favored just four times, and won only one of those games: a win over the Blaine Gabbert/Jim Tomsula 49ers.

On that day, Johnny Manziel was the team’s quarterback.  So yeah, it’s been a long time.  Of course, the Browns have only won 4 (and tied a fifth, of course) of those games, with the last coming back on December 24th, 2016.  That day, Robert Griffin III was the team’s quarterback.

So yes, it’s been a rough few years… or decade… or two decades, for Cleveland.  Over the team’s last 58 games, the Browns have been favored to win and actually won just one time — that game against the 49ers.  There have been a lot of bad days in Cleveland over the years, of course: the graph below shows each Browns game since 2008, along with the pre-game point spread.  Remember, a positive number means the team was the underdog.  In the graph below, you can see that most of the dots are above the 0 line, meaning Cleveland was usually an underdog.   The games that Cleveland won are in white dots with orange borders; the games that Cleveland lost are in brown dots with orange borders.

Do the Browns have a reason to be optimistic since the game is at home and the Jets will have to travel to Ohio on short rest? From 2012 to 2017, there were 87 games played on Thursday night excluding week 1, when both teams have equal rest. In those games, the home team won 49 times (a 0.563 winning percentage), although the home team was favored 52 times and a pick’em once. Of the 52 home teams that were favored, 37 won (0.711) and 28 covered (with 24 failing to cover). When the spread has been tight — the home team favored by between 1 and 3 points — the home team has won 9 of 16 games.

If the Browns manage to win the game, it will be just the second time Cleveland has been favored to — and actually won — a game in primetime.  The second-to-last time the Browns won a primetime game they were favored to win? They did it against a team that doesn’t exist anymore, with Bill Belichick as the head coach.

{ 0 comments }

2018 Super Bowl Odds: The AFC East Sandwich Strikes Again

With opening day kickoff just a few hours away, let’s look at the final pre-season Super Bowl odds.

The Patriots are the Super Bowl favorite for what feels like the 20th season in a row. New England is an 11/2 favorite to win it all, which means if you bet $100 (or $200) on the Patriots to win Super Bowl LIII, you would win $650 (or $1,100). That means the Patriots would need to have a 15.4% chance of winning the Super Bowl to make that an even bet (the result of 2 divided by (2 + 11)). But if you do that same calculation for every team, you’ll see that the total Super Bowl percentages equal 131%; that’s because of the vig, the amount that Vegas deflates the payout in order to make money.

If you divide each team’s percentage taken from their odds by 1.31, you get the implied odds of that team winning it all. For New England, this means the Patriots really have about a 12% chance of winning the Super Bowl, according to the oddsmakers.

The rest of the AFC East? The Bills have the worst chance in the league at 0.4%, while the Jets, Dolphins, and Cardinals are all at 150-to-1, for an implied percentage of 0.5%. In other words, the Patriots odds of winning the Super Bowl are more than 8 times greater than the odds of any other AFC East team’s of winning it all. As usual, we have an AFC East sandwich, with the Patriots on top of the league, the Jets/Bills/Dolphins at the bottom, and the rest of the NFL in between.

Here are the full odds for each team this year, courtesy of Bovada. [continue reading…]

{ 0 comments }

Vegas Records Vs. Actual Records

Last year, the Steelers went 13-3, but you would have lost money if you bet on Pittsburgh every week. Despite that record, the Steelers went just 7-9 against the spread. Since 1978, teams that have won games are 7706-1514-256 in 9,476 games against the spread, which means teams that win cover the spread about 83% of the time.

The biggest outlier was the 1986 Bears. You probably have heard of a team called the ’85 Bears, who stomped through the league en route to a Super Bowl title. The next season, Chicago went 14-2 but went just 6-10 against the spread! There were 7 games where the Bears were favored by at least 9.5 points and won the game but didn’t cover; that is, of course, a record. The only other teams with even four such games where they failed to cover were the ’98 49ers and ’07 Patriots.

The graph below shows, on the X-Axis, the winning percentage of all teams in all seasons since 1978. The Y-Axis shows their winning percentage against the spread. You can see the Bears as the low dot on the bottom right, at 0.875 winning percentage and 0.375 winning percentage against the spread. [continue reading…]

{ 0 comments }

Joe Montana and Records Against The Spread

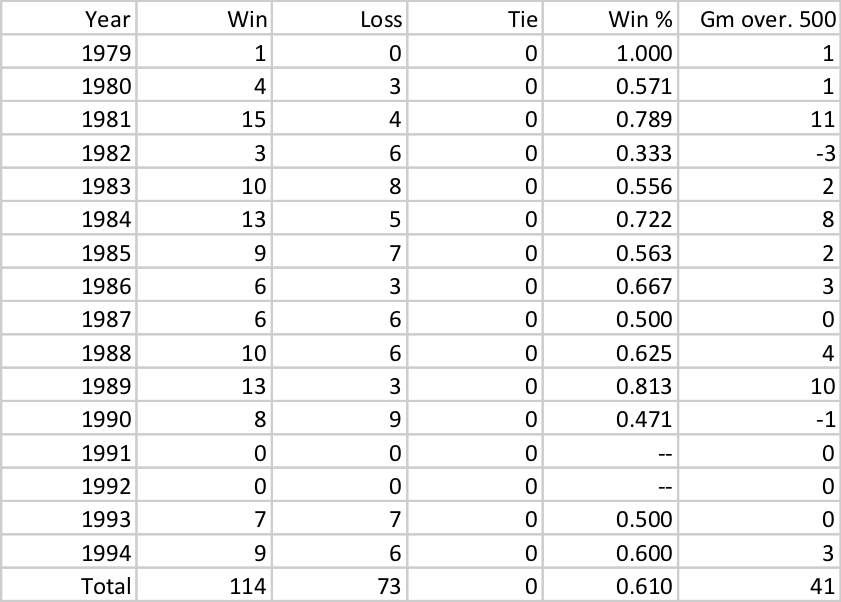
Joe Montana’s teams were really good at winning football games, going 117-47 and 16-7 in games started by the Hall of Fame quarterback. Montana’s teams had a 0.711 overall winning percentage, which is great; but what’s even more remarkable is how well his teams did against the points spread.

On average, Montana’s teams were favored by 4.5 points. And given the nature of how points spreads work, you would expect most teams to win about half of their games against the spread. But Montana’s teams went 114-73 against the spread, a remarkable winning percentage of 0.610. Much of the success was due to the 49ers of 1981 (15-4 ATS), 1984 (13-5), and 1989 (13-3). The ’81 team was one of the most surprising Super Bowl champions of all time; San Francisco was favored in just 9 of 19 games that year, with three of those spreads being just 1-point lines. And the ’84 and ’89 teams were two of the greatest teams of all time, so it’s not surprising that they had great ATS records, too. The table below show’s the record against the spread for each of Montana’s teams in each season of his career:

Also really good against the spread, of course, is Tom Brady and the Patriots. The ’01, ’03, and ’04 Patriots were all Super Bowl champions that were remarkable against the spread, combining to go 41-11-3 relative to the Vegas odds. The Patriots remained solid but unspectacular against the spread since then, although the ’16 team went 13-2 with Brady under center.

What makes the Brady stuff all the more remarkable: the last 52 times the Patriots have taken the field with Brady under center, the Patriots have been favored. And you have to go back 60 games, November 2014 game against the Packers, where New England has been underdogs with Brady under center. More on that tomorrow. [continue reading…]

{ 0 comments }

Yesterday, I posted the implied SRS ratings from the Vegas lines released this weekend covering the first 240 games of the season. This is one of my favorite exercises of the year — the Vegas ratings are a great tool to use a starting point for all sorts of projections — so I’ve decided to turn this into a two-part post.

Vegas does not include week 17 point spreads, but we can generate them based on the ratings we have now generated. And we can also perform a much more substantive strength of schedule calculation than the one you typically see. This year, the Arizona Cardinals have the toughest schedule in the league. The table below shows each team’s SOS for all 16 games in 2018:

RkTeamSOS
1Arizona Cardinals0.74
2Kansas City Chiefs0.44
3Seattle Seahawks0.43
4Washington Redskins0.40
5Detroit Lions0.40
6New York Giants0.29
7Cleveland Browns0.29
8Tampa Bay Buccaneers0.27
9Los Angeles Rams0.27
10New Orleans Saints0.22
11Chicago Bears0.21
12Buffalo Bills0.19
13Philadelphia Eagles0.11
14Minnesota Vikings0.10
15Indianapolis Colts0.00
16Carolina Panthers-0.03
17Miami Dolphins-0.08
18Denver Broncos-0.08
19San Francisco 49ers-0.08
20Dallas Cowboys-0.09
21New York Jets-0.12
22Tennessee Titans-0.13
23Pittsburgh Steelers-0.15
24Atlanta Falcons-0.16
25Cincinnati Bengals-0.18
26Jacksonville Jaguars-0.27
27Green Bay Packers-0.28
28Baltimore Ravens-0.35
29Los Angeles Chargers-0.40
30Oakland Raiders-0.44
31New England Patriots-0.71
32Houston Texans-0.79

Arizona’s road schedule is particularly brutal: the Cardinals are 6.5 point underdogs (yes, in large part because the Cardinals are expected to be bad) in every game on the road this year. [1]Aand while there’s no line out for the week 17 game in Seattle, the implied ratings tell us that the spread would probably be Seattle -6.5 or Seattle -7. In addition to tough road games against the Seahawks, Rams, and 49ers, Arizona has to visit the Chargers, Chiefs, Falcons, Packers, and Vikings!

Meanwhile, the Texans and Patriots have the two easiest schedules in the NFL. Both teams get the Jets, Dolphins, Bills, and Colts — six for New England, four for Houston of course — while the Texans also get home games against the Browns and Giants. In addition, the Patriots have just five games against top-14 teams, while the Texans have just four games against top-12 teams.

Oh, and don’t pay any attention to articles that claim that the Packers have the hardest schedule in the NFL in 2018. Yes, Green Bay’s opponents this year won 138 games in 2017, the most of any slate of opponents. But that includes games a bunch of games against teams who are expected to be worse than their 2017 record, like the 8-8 Cardinals, the 9-7 Bills, the 7-9 Redskins, and two games each against the 9-7 Lions (21st in the SRS) and 13-3 Vikings (3rd in the SRS). Green Bay’s schedule is actually easier than average — the Packers are road dogs to the Patriots, Rams, and Vikings, but are otherwise favored in every other game (it helps, of course, that the Packers are expected to be very good). Only six of the team’s 16 games are against teams with a positive SRS. [continue reading…]

References

References
1 Aand while there’s no line out for the week 17 game in Seattle, the implied ratings tell us that the spread would probably be Seattle -6.5 or Seattle -7.
{ 4 comments }

Implied SRS Ratings for NFL in 2018

Ever year, CG Technology releases point spreads for all NFL games during the first 16 weeks of the the season. And as I do every year, I then use those weekly ratings to figure out what the Vegas ratings are for each team.

What we do is take the point spread in each game, adjust for home field (except for the four international games), and then determine how by many points Vegas thinks Team A is better than Team B. When the Patriots are favored by 8.5 points in a road game against the Jets, we can take this to mean that Vegas thinks New England is 11.5 points better than New York. When Vegas says New England is a 7-point home favorite against the Texans, that tells us that Vegas thinks the Patriots are 4 points better than Houston. That’s just two games, of course: Using the iterative SRS process, we can generate season ratings based on the 240 point spreads involved. Here are those ratings, again as of May 13, 2017.

Here’s how to read the table below. After adjusting for home field advantage, the Patriots are expected to beat their average opponent by 6.17 points (this is their Expected HFA-Adj MOV). On average, New England’s opponents (after adjusting for *their* strength of schedule) are -0.47 points better than average, which means the Patriots are expected to be 5.69 points better than average (difference due to rounding). That’s the best in the league; the worst team in the league, perhaps surprisingly, is still the Browns. [continue reading…]

{ 1 comment }

Last year, when the Browns were 0-14, I noted that Cleveland was also a pitiful 2-12 against the spread. The worst mark against the spread in a 16-game season was 3-13, which Cleveland managed to avoid. The Browns beat the Chargers (and the spread) in week 16, and then pushed in a 3-point loss in the season finale against, of course, Pittsburgh.

But guess what? After falling to the Bears today, 20-3, the Browns are now 3-12 against the spread (the second worst team is the Broncos, who are 4-10-1). And for the 7th time in 8 years, the Browns will again finish the season against the Steelers.

If you look at the teams that were 3-13 or 3-12-1 against the spread, they tend to do very well the next year. In other words, Vegas perhaps hasn’t quite caught up to the fact that teams that perform terribly against the spread do much better the next year.

TeamYearRecord ATSWin % ATSN+1 Record ATSN+1 Win % ATS
TEN20143-13-00.18755-10-10.34375
BAL20073-13-00.187512-4-00.75
NWE19813-13-00.18756-3-00.667
PIT19803-13-00.18758-8-00.5
CIN19873-12-00.211-5-00.6875
STL20113-12-10.2187511-5-00.6875
NYG20033-12-10.218758-8-00.5
OAK20033-12-10.218756-10-00.375
DAL19973-12-10.218758-7-10.53125
HOU19943-12-10.2187511-5-00.6875
BAL19813-12-10.218754-5-00.444
SFO19783-12-10.218757-8-10.46875
Average3-12.3-0.60.2078.1-6.5-0.30.554

But then you have… the Browns. Cleveland is now 6-24-1 against the spread since the start of last season, ensuring they will finish with the worst mark since 1978 over a 2-year period. The 2014-2015 Titans were the previous record-holder, at 8-23-1 against the spread, followed by the 2008-2009 Jaguars (9-23-0) and four teams at 9-22-1 (’03-’04 Raiders, 2007-2008 Broncos, 1990-1991 Rams, and well, the 2015-2016 Browns).

So not only has Cleveland been historically bad on the field this year, they have been historically bad against the spread for the second year in a row.

{ 2 comments }

How Vegas Has Changed Its Mind On The Week 6 Games

Back in May, CG Technology released point spreads for games during each of the first 16 weeks of the season. Today, I want to check how the spreads for the week 6 games have changed since then.

There are 22 teams we can analyze using this method. Here are those 11 games, sorted by the games that have changed the most. [continue reading…]

{ 25 comments }

Sean McVay, Bill Parcells, and Excellent Coaching Debuts

You know your debut goes well when you can crack jokes with your punter

Over the last ten years, no team has had a worse record than the Rams. And two of the last three years have started in particularly ugly fashion: last season, the Los Angeles Rams lost 28-0 as 2.5-point favorites in San Francisco. And two years earlier, the St. Louis Rams lost by 28 points to the Vikings as 3.5-point favorites on opening Sunday (more on this game in a bit). But on Sunday, in the first game with a new coaching staff headlined by 31-year-old Sean McVay, OC Matt LaFleur, and DC Wade Phillips, the Rams walloped the Scott Tolzien-led Colts, 46-9.

The Rams were expected to win because, well, Tolzien, but Los Angeles was only favored by 3.5 points. That means Los Angeles, by virtue of a 37-point win, covered by a whopping 33.5 points.  For some perspective, the only other team to cover by four touchdowns on Sunday was Jacksonville, in game 3 of the Doug Marrone era.  Covering by 33.5 points is a ton: the Rams never did it during the Greatest Show On Turf days although the team did do it three times during the Jeff Fisher era, including… the last time the Rams played the Colts. That game, you may recall, was the, um, Tavon Austin breakout game.

Anyway, covering by 33.5 points is pretty rare, but it’s really rare when it comes in a head coach’s first game with the team. In fact, it’s the largest cover by a head coach in his first game since 1990.  And among all coaches in their first games with a new team (i.e., including coaches in their first stop at a new gig), it’s the third largest cover since 1990.  Take a look at how each coach from 1990 to 2016 did in week 1 with a new team: [continue reading…]

{ 4 comments }

Implied SRS Ratings for NFL in 2017

Back in May, CG Technology released point spreads for all NFL games during the first 16 weeks of the 2016 season. We can use these lines to generate implied NFL ratings — as of May 10, 2017 — for this upcoming season.

Basically, we take the point spread in each game, adjust for home field, and then determine how by many points Vegas thinks Team A is better than Team B.  When the Seahawks are favored by 13.5 points in a home game against the Rams, we can take this to mean that Vegas thinks the Seahawks are 10.5 points better than Los Angeles.  When Seattle is a 6-point road favorite in Los Angeles against the Rams, that tells us that Vegas thinks the Seahawks are 9 points better than the Rams.  That’s just two games, of course: Using the iterative SRS process, we can generate season ratings based on the 240 point spreads involved. Here are those ratings, again as of May 10, 2017.

Here’s how to read the table below. After adjusting for home field, the Patriots are expected to beat their average opponent by 6.6 points. On average, New England’s opponents (after adjusting for *their* strength of schedule) are 0.3 points better than average, which means the Patriots are expected to be 6.8 points better than average (difference due to rounding). That’s the best in the league, far ahead of the Seahawks, Cowboys, and Packers (the only other teams that are 4 points better than average). [continue reading…]

{ 11 comments }

The Patriots and the Spread, Part I

Since 2001, the Patriots have been favored to win in a whopping 79% of all games, including postseason (giving half-credit as a favorite in games where the spread is zero). The Steelers are second at 73%, the Packers and Colts are next at 69%, the Eagles are at 68%, the Broncos at 67%, and the Saints at 61% are the only other team over 60%. In other words, the Patriots have been in a class by themselves when it comes to being favored.

But even that kind of underrates New England. The Patriots weren’t favored in any of the first 8 games of the 2001 season; the team was only favored in one of its first 12 games, at which point in time New England had a 7-5 record (and an 8-4 mark against the spread). There have also been 19 games since 2001 where Tom Brady was not the starting quarterback, and the Patriots were underdogs in 4 of those games (and a pick’em in a fifth). And there were meaningless week 17 games in 2006 and 2009 that the Patriots were underdogs because they were projected to rest their starters.

The graph below shows how many points the Patriots were expected to win in each game, regular and post-season, since 2001. I have included as red dots games not started by Brady or during meaningless week 17 games: [continue reading…]

{ 1 comment }

Why Haven’t We Improved At Making NFL Predictions?

Yesterday, we looked at the biggest “covers” in NFL history: those games where the final score was farthest from the projected margin of victory. In a 2010 game in Denver, the Raiders were 7-point underdogs, but beat the Broncos by 45 points. That means the point spread was off by 52 points, the most in any single game.

The first year we have historical point spread data was in 1978. That year, the average point spread was off by (or the average amount of points by which the favorite covered by was) 9.9 points. That number probably doesn’t mean much to you in the abstract, so let’s give it some context. From 1978 to 1982, the average point spread was off by 10.4 points. Over the last five years, the average point spread has been off by… 10.3 points.

Now I’m not quite sure what you expected, but isn’t that weird? In 1978, Vegas bookmakers were using the most rudimentary of models. Think of how farther along we are when it comes to football analytics than we were four decades ago. All of that work, of course, has to have made us *better* at predicting football games, right?

But don’t these results suggest that we are not any better at predicting games? If Vegas was missing games by about 10 points forty years ago, why are they still missing games by about 10 points? One explanation is that the NFL is harder to predict now, which… well, I’m not so sure about that. After all, even if you think free agency and the salary cap bring about parity (which is a debatable position regardless), it’s not like the lines are more accurate later in the season once we know more information. Games are also slightly higher scoring, and you could make the argument that we should be measuring how far games are off by as a percentage of the projected over/under?

Let’s look at the data. The graph below shows in blue the average “cover” in each game for each year since 1978.  As it turns out, 2016 was a really good year for Vegas — the average cover was just 9.0 points, which ranks as the most accurate season ever.  However, there’s no evidence that this was anything more than a one season blip: 2013 and 2015 were average years, and 2014 was the least accurate season ever.  It’s not like our prediction models just started getting sophisticated last season.

For reference, in the orange line, I have also shown the average point spread for each game.  That line has also been pretty consistent over time, with the average spread usually being just above 5 points. [continue reading…]

{ 15 comments }

Biggest Covers In Vegas History (1978-2016)

Last week, I noted that the Colts/Vikings game was the least-conforming game of the 2016 season. Here’s what I wrote then:

The Colts were 0.2 points per game better than average last year, as measured by the Simple Rating System (which takes the points scored and allowed in each game, and adjusts for opponent strength and home field advantage).

The Vikings were 0.9. points per game better than average in 2016, and hosted the Colts in week 15. Given those facts, we would expect Minnesota to have won by 3.7 points. Instead, Indianapolis upset the Vikings, 34-6, beating the expected line by 31.7 points. That was the least-conforming game of 2016.

Well, it wasn’t just the SRS that found that game to be pretty odd. Our friends in the desert expected the Vikings to win by 5 points, which means the Colts covered the point spread by a whopping 33 points.  Two weeks earlier, Indianapolis was actually an underdog in a Monday Night Football game that you would have had to been an idiot to attend in person.  The Colts were 1-point underdogs, but won by 31 points, giving Indianapolis a 32-point cover.  Those were two of the three biggest covers of the year, with the Eagles 34-3 win over Pittsburgh as 3.5 point underdogs (+34.5) being the biggest cover of 2016.

At Pro-Football-Reference.com, we have points spread data going back to 1978. Below are the biggest covers in history: [continue reading…]

{ 2 comments }

Super Bowl Streaks And Conference Affiliation

The NFL and the Lombardi Packers won the first two Super Bowls. Then, each conference went on a long streak:

  • The AFL/AAFC won 11 of the next 13 Super Bowls (1968-1980): the Jets and Chiefs closed out the AFL with Super Bowl upsets, while the Steelers, Dolphins, and Raiders carried the AFC.
  • Then, from 1981 to 1996, the NFC won 15 of the next 16 Super Bowls, with the 49ers and the NFC East teams (well, not all of them) carrying the conference to 13 of those titles.
  • The balance shifted then to the AFC, as the conference won 8 of the next 10 Super Bowls (1997 to 2006).  The Patriots won three of those, but perhaps most surprising was that the run ending with 18-0 New England losing as heavy favorite to the Giants.

Since then? The NFC went on a mini-run, winning 6 of 8 Super Bowls from 2007 to 2014.   The AFC has responded by winning the last two Super Bowls, and the conference is again a favorite in Super Bowl LI. Here are the results in graphic form, with NFL/NFC wins in blue, and AFL/AFC wins in red: [continue reading…]

{ 9 comments }

The median amount of points scored in Falcons games this year is 57 points; in Packers games, that number is 53 points. So why is the over/under 60 points?

The average isn’t much different: there have been 58.9 points scored in Atlanta games, and 52.0 points scored in Green Bay games. You may be surprised to learn that during Green Bay’s 8-game winning streak, there have been 51.6 points scored per game: 32.1 by the Packers, and 19.5 by Packers opponents.

Of course, what’s really driving these numbers is not the points scored by both teams in these games, but by both offenses. The Packers are averaging 28.0 points per game this year over 18 games, 32.1 points per game during this 8-game winning streak, and 34.8 over the team’s last 5 games. Atlanta is averaging 33.9 points per game over 17 games, and 38.0 points over their current 5-game winning streak.

So by that line of thinking, a 60-point over/under probably feels low. But it is currently (the line may change) tied for the 2nd highest over/under of any game since 1978, with the only other playoff game on the list:

WinnerLoserYearWeekBoxscoreLineOver/UnderPFPATotal Pts
STLSFO20009Boxscore-763342458
NORDET2011WCBoxscore-10.560452873
KANOAK200416Boxscore-9.560313061
CARSTL200010Boxscore13.559.5272451
DENWAS20138Boxscore-1158.5452166
STLIND200116Boxscore-1358.5421759
STLATL20007Boxscore-1858.5452974
GNBNWE201413Boxscore-358262147
INDMIN20049Boxscore-758312859
CARSTL200014Boxscore85816319
DENPHI20134Boxscore-11.557.5522072

What do you think? Over or Under?

{ 5 comments }

Browns Continue To Lose … Against the Spread, Too

Cleveland is 0-14 this year, but that’s maybe not the saddest stat of the Browns season. Everyone expected Cleveland to be bad, but Cleveland has also been really bad relative to expectations. After losing against on Sunday to the Bills, and again failing to cover against the spread, the Browns are now just 2-12 against the spread this season.

Cleveland covered in games against the Dolphins and Titans early in the year, but the Browns have now failed to cover the spread in eight straight games. The graph below shows the number of points Cleveland was expected to lose by in black, and the actual points differential in orange. Since the Browns have been underdogs and lost every game, the range goes from 0 to -30: [continue reading…]

{ 2 comments }

Final 2016 NFL Division Odds

I never quite know what to post on the first Sunday of the season, so here are the final NFL 2016 Division Odds (as of prior to the Thursday night game). In each case, I’ll be showing the odds for each team to win its division as of May 23rd and as of September 8th, along with their vig-adjusted percentage based on those odds. Let’s start with one of three divisions with a clear favorite, and one of just two divisions with only one team having at least a 15% chance of winning the crown.

AFC East

Team5/23 Odds9/8 Odds5/23 Perc9/8 Perc
New England Patriots     5/115/1261.5%64.6%
Buffalo Bills            21/46/114.3%13.1%
New York Jets            21/413/214.3%12.2%
Miami Dolphins           8/18/19.9%10.2%

The Patriots raw odds actually went up over the last few months, even with the Tom Brady suspension becoming official. But because the Jets and Bills have seen their percentage drop, New England’s odds of winning another AFC East crown have increased. Buffalo’s had a rough offseason due to injuries, but it’s a little harder to explain why the Jets odds have gone down. New York has a very difficult schedule, which may play a part in that.

AFC North

Team5/23 Odds9/8 Odds5/23 Perc9/8 Perc
Pittsburgh Steelers      5/46/539.6%41.8%
Cincinnati Bengals       7/42/132.4%30.7%
Baltimore Ravens         11/47/223.8%20.4%
Cleveland Browns         20/112/14.2%7.1%

These odds have been pretty static, but a (very) small Cleveland hype train has emerged. Vegas sees the top 3 teams as very strong, but does have a clear 1-2-3 order, too. [continue reading…]

{ 0 comments }
Previous Posts