
Seven years ago, Neil Paine provided the formula for predicting the expected winning percentage for the home team at the start of a game, based on the Vegas point spread. There were only 5 upsets where the favorite list, and a sixth game that was a tie with a 2.5-point spread. The six biggest favorites all won, making this a pretty by-the-book week.
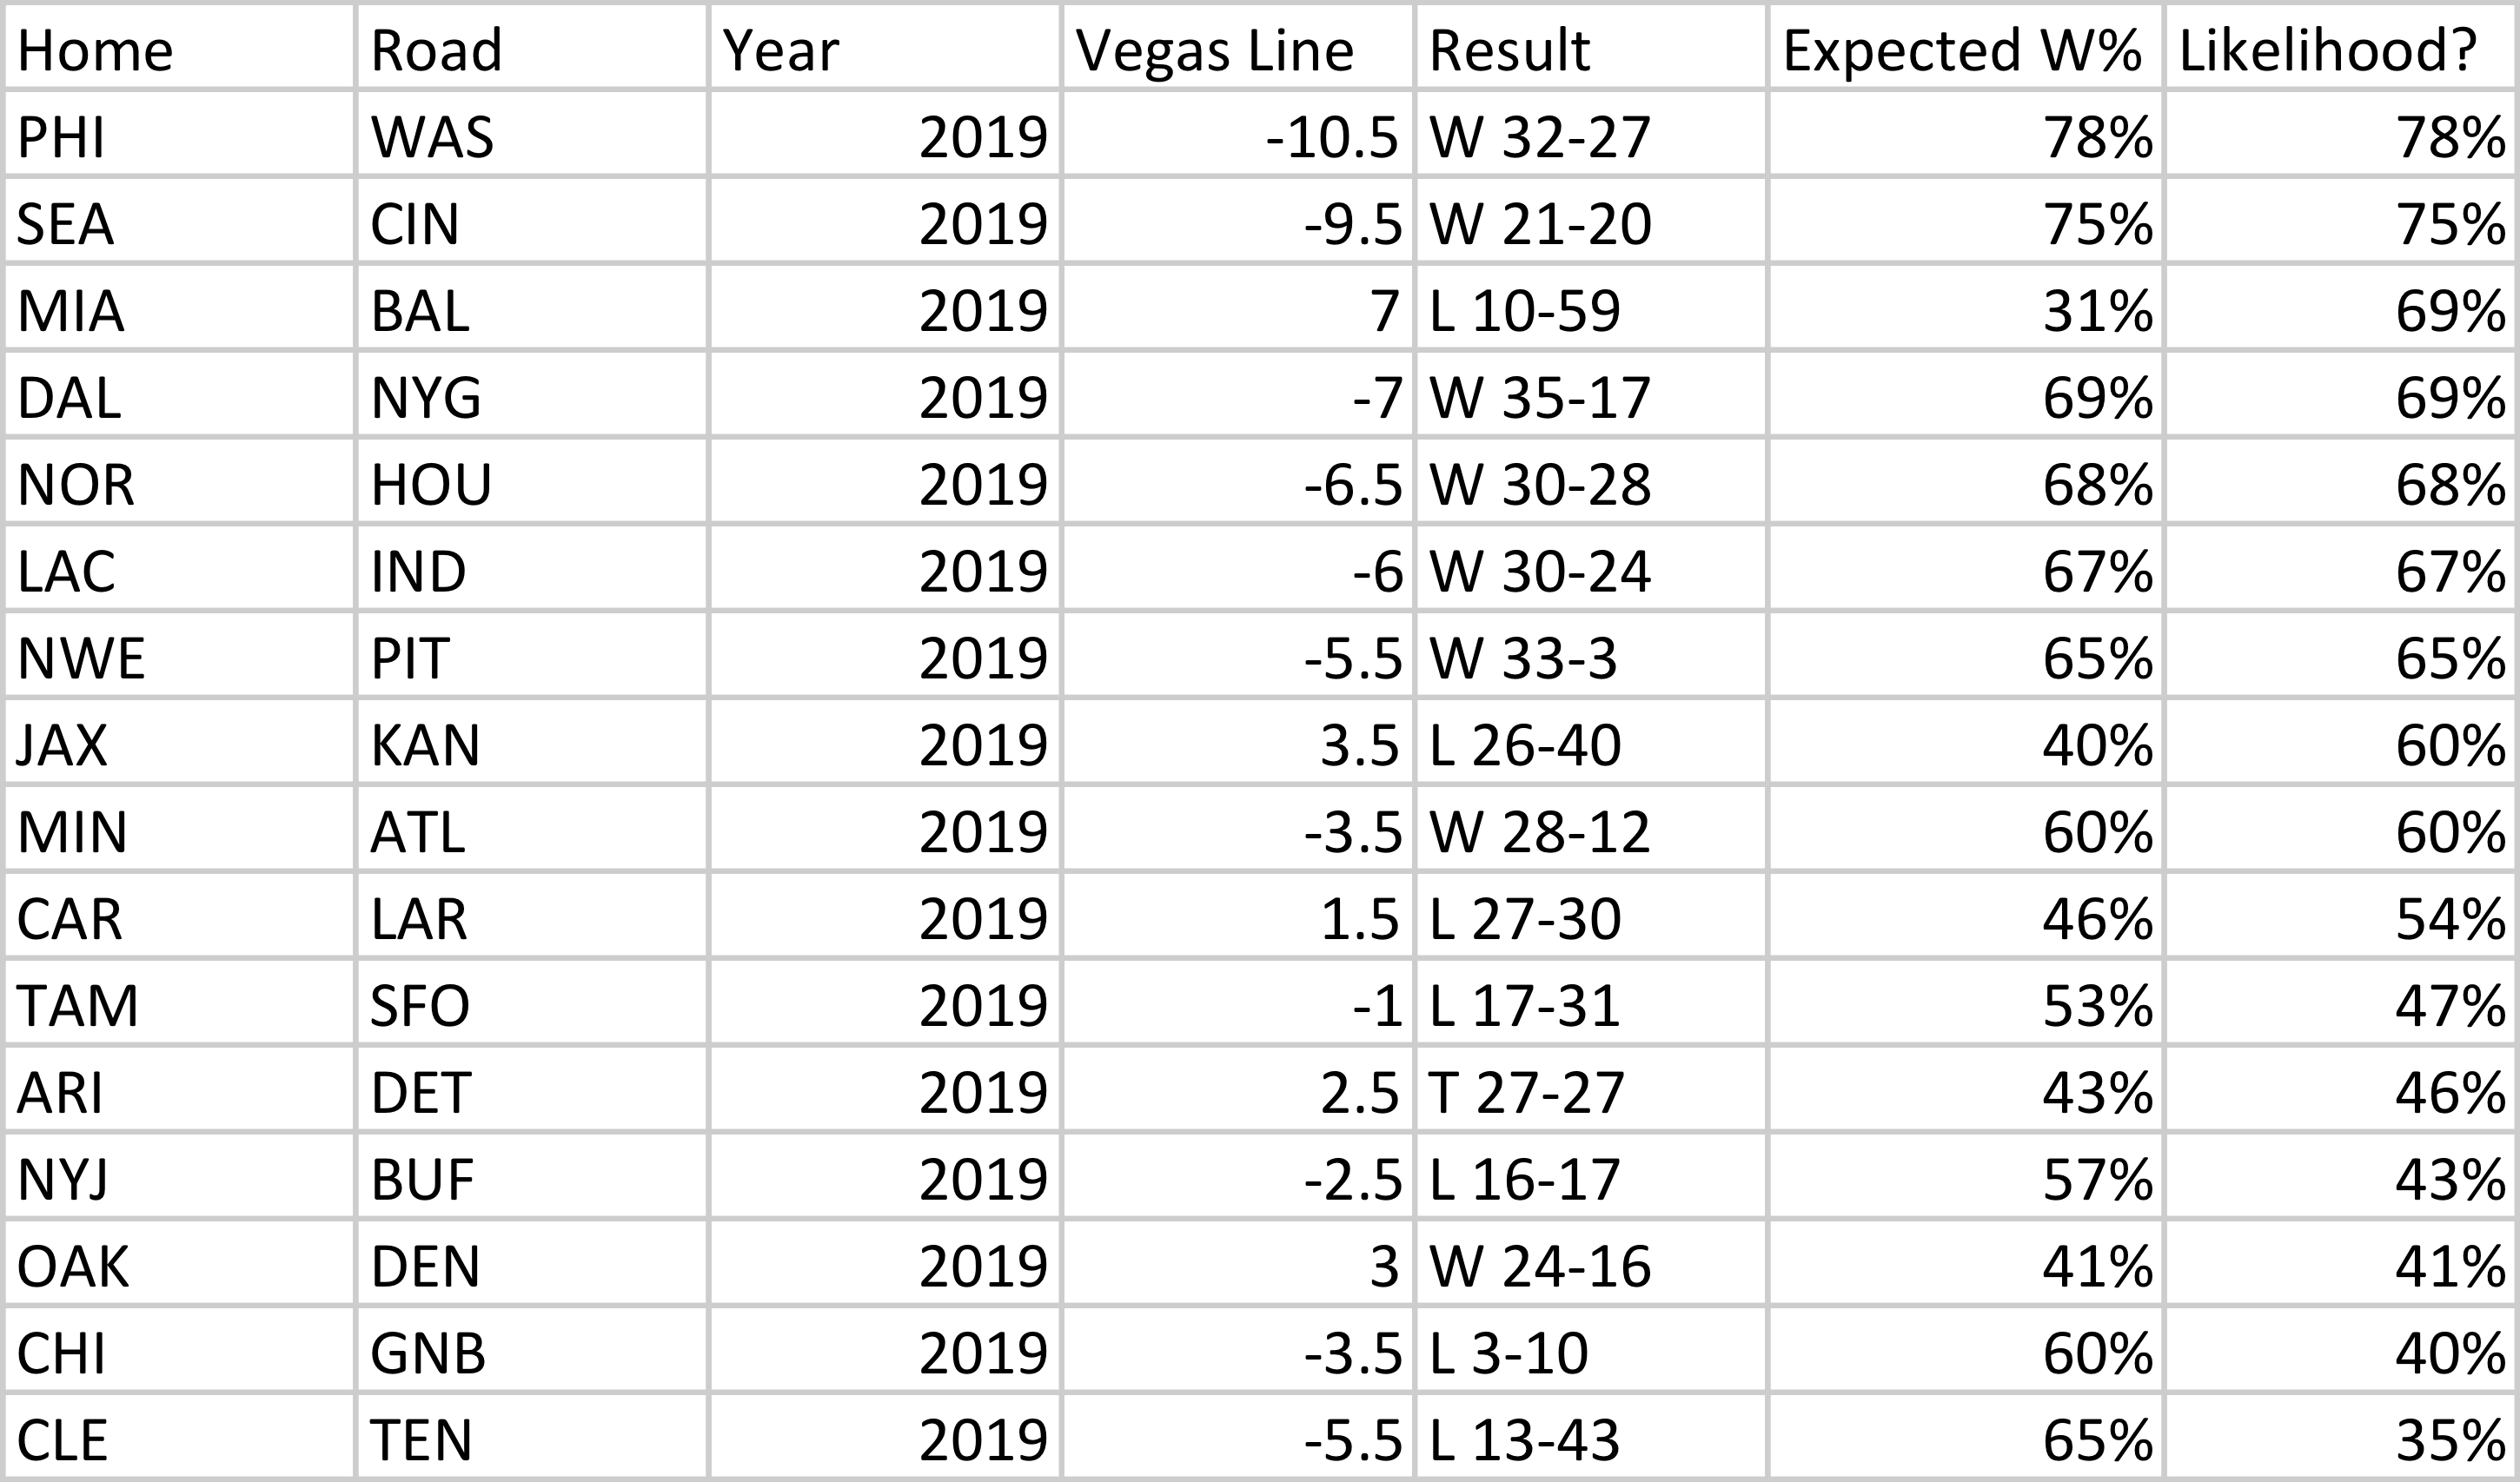
The table below shows the results of each game from the perspective of the home teams in week 1. The “Expected W%” column shows the expected winning percentage of the home team based on the Vegas point spread; the Eagles were -10.5, so Philadelphia had a 78% chance of winning; the Dolphins were +7, so they had a 31% chance of winning. The final column shows how likely or unlikely the result was: if the favorite won, the expected winning percentage number was used; if the favorite lost, the expected winning percentage of the underdog was used. So when the Browns lost, that game gets marked as a 35% likelihood game.
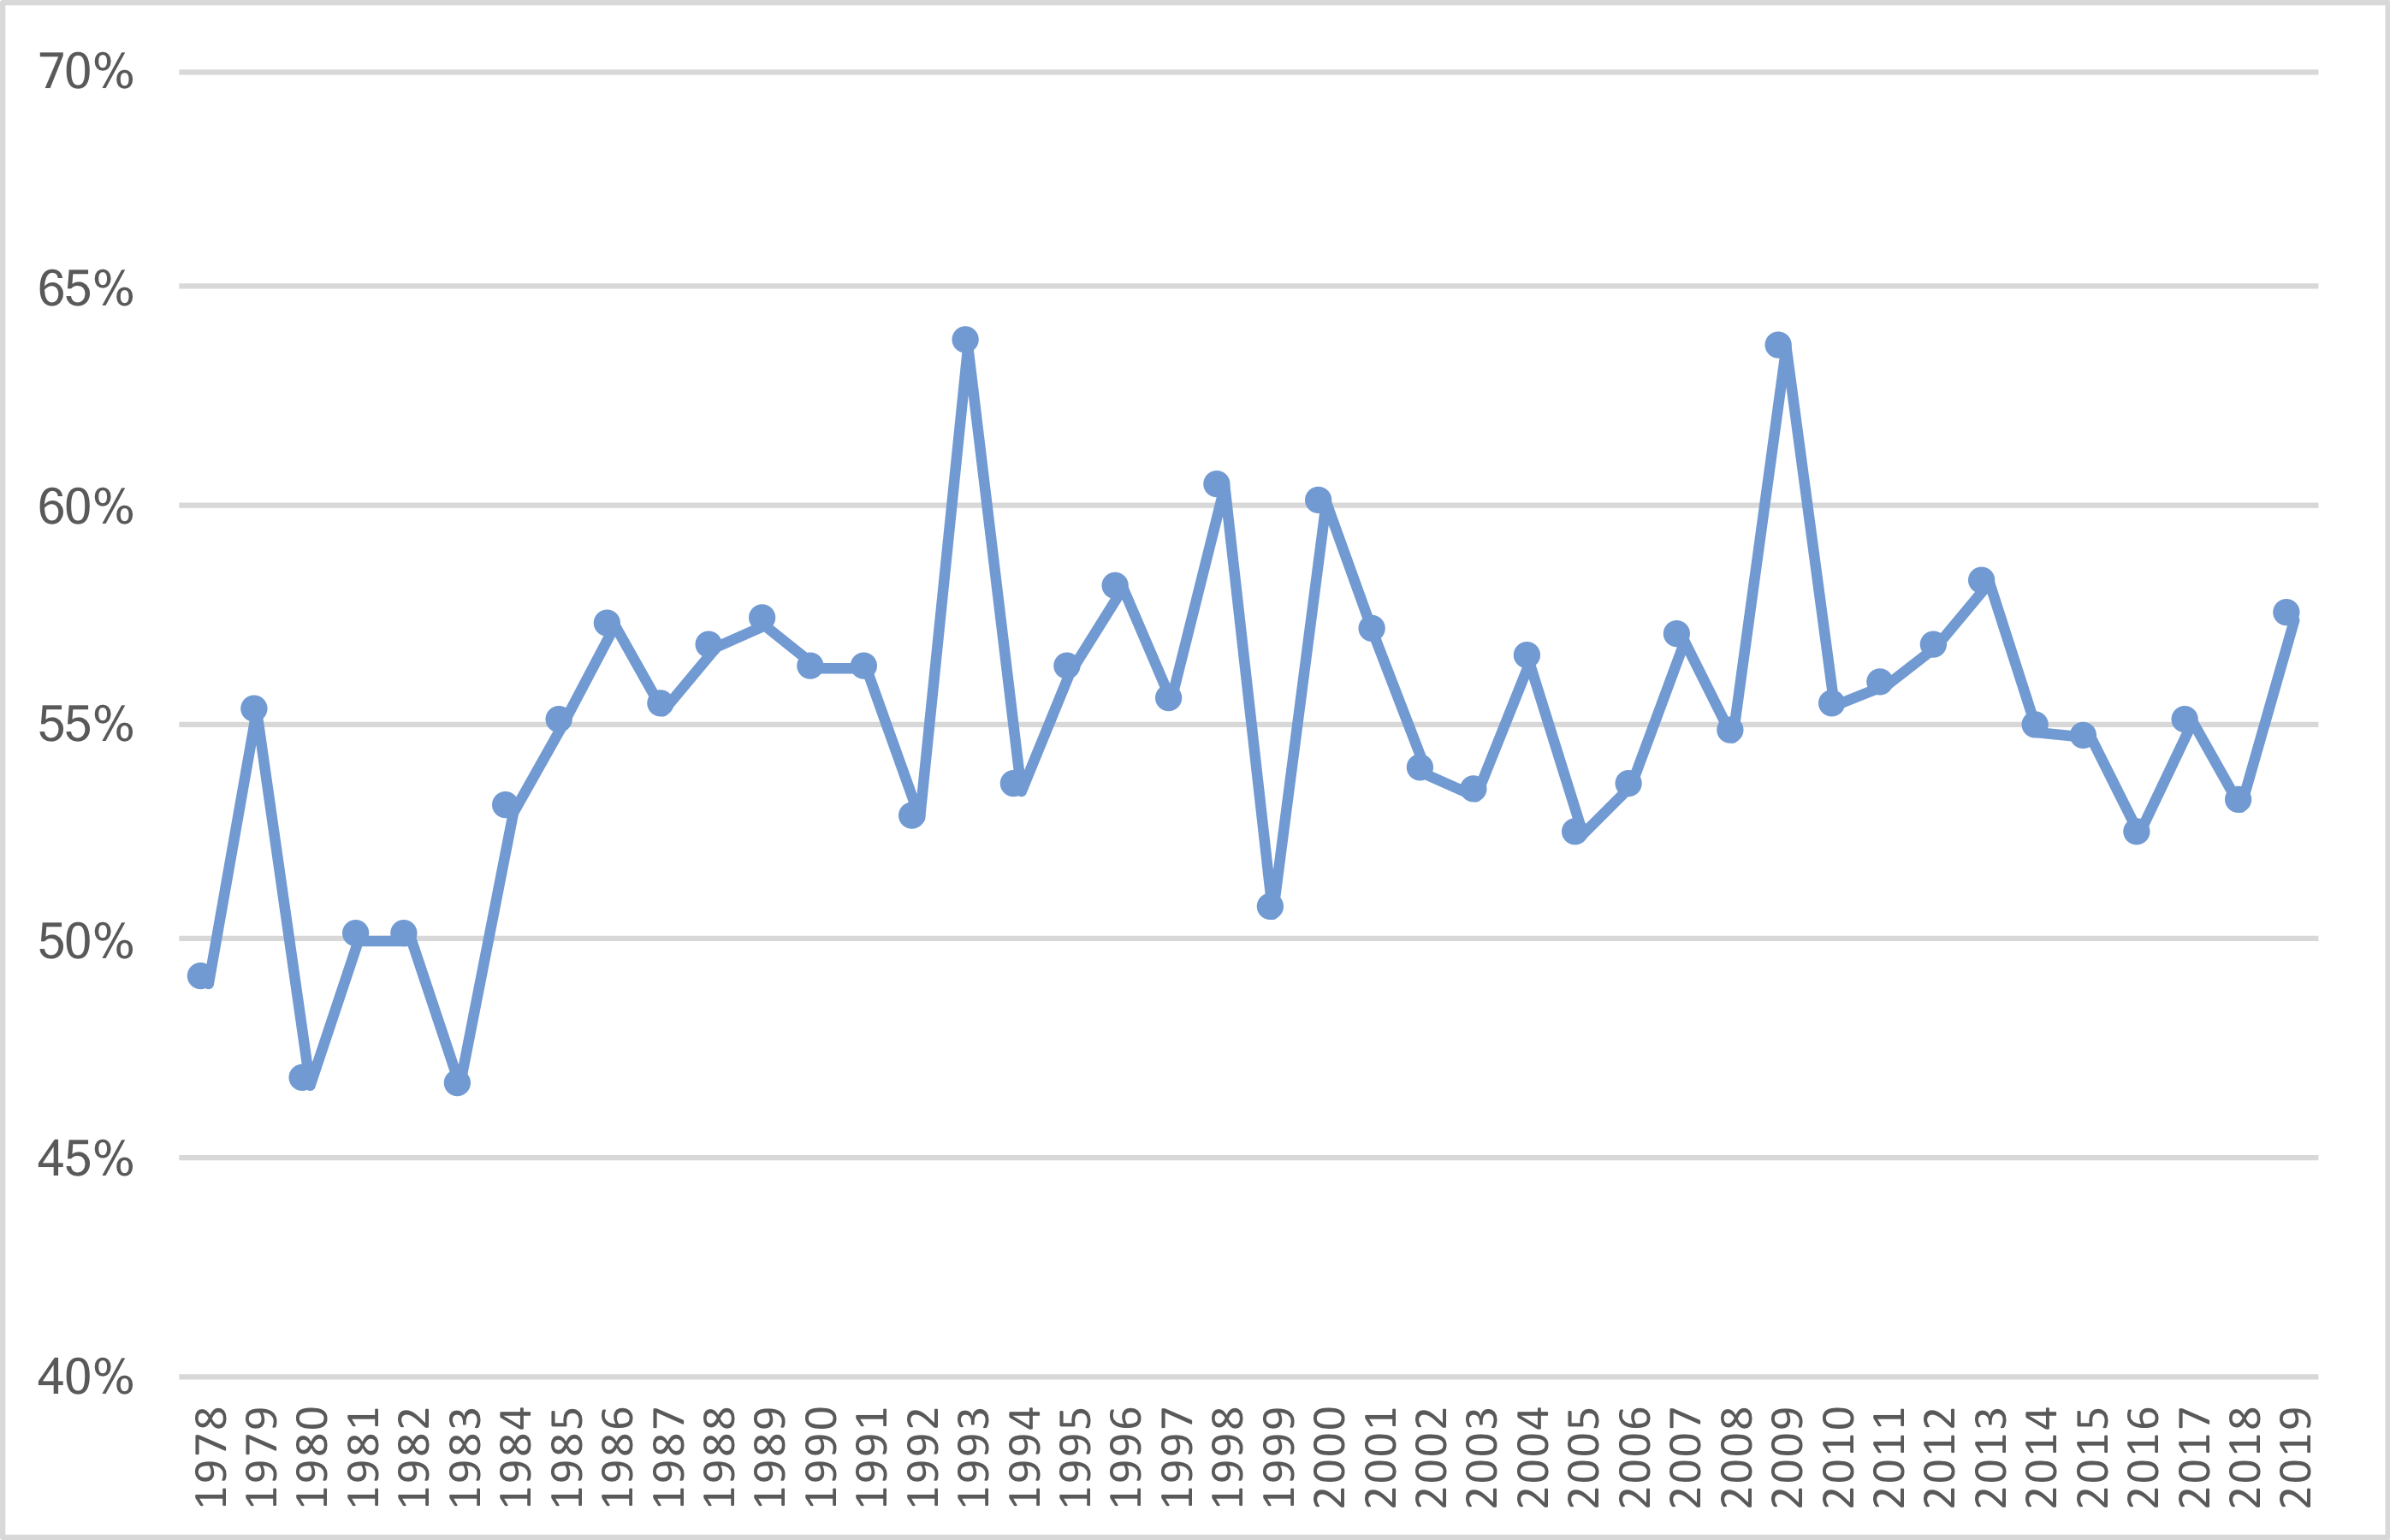
I was curious to see how this relates to past week ones, so I went ahead and performed this calculation for every week 1 since 1978. The graph below shows the average likelihood % for each game in each week 1 over that period. In 2019, this was 57%, which is pretty high but not abnormally high for week one.
If you were in a survivor pool, you are probably still alive in week two. Most seasons, there is at least one big upset in week 1. The Bucs won over the Saints last year in week 1 despite only having a 24% chance; in 2017, the Chiefs (28%) upset the Patriots in Foxboro; in 2016, the Patriots (with a backup quarterback) upset the Cardinals despite only having a projected 26% chance of winning. But this year, only the Browns loss as a heavy favorite goes down as a large upset, and even seeing Browns loss and large upset in the same sentence feels a bit off.