≡ Menu

One of the best champions in Cleveland sports history.

The Cleveland Cavaliers and Golden State Warriors are facing off in the NBA Finals for the third straight season. That’s never happened before in NBA history, and it only happened once in pro football history… and it also involved Cleveland.

In 1952, the Browns won the American with an 8-4 record, while the Detroit Lions won the National division with a 9-3 record (after defeating the defending-champion Rams in the National tiebreaker game). Otto Graham and Bobby Layne were the two top quarterbacks in the NFL that year according to both the AP and the NY Daily News. Detroit traveled to Cleveland on December 28th and defeated the Browns 17-7, with Doak Walker’s 67-yard touchdown providing the biggest blow.

The next season, Graham had a season for the ages by any measure.  You’d be hard-pressed to argue for a better regular season by any quarterback from World War II to 1983, when a Graham-led Browns passing game finished with a Relative ANY/A of +5.00.  The Browns began the 12-game season with 11 straight wins, while Detroit finished 10-2 with both losses coming against the 8-3-1 Rams.  Cleveland lost the season finale in Philadelphia, and then traveled to Detroit for an NFL Championship rematch.

The Browns and Lions were tied 10-10 after three quarters, and Cleveland was up 16-10 late in the game.  But in the final minutes, Layne found an unlikely hero in Jim Doran for a 33-yard game-winning touchdown (video here), with Walker’s extra point providing the margin of victory. The bigger story? Graham having one of the chokiest games in football history, finishing with 2 of 15 for 20 yards with 2 interceptions. [continue reading…]

{ 15 comments }

Longtime commenter Jason Winter has chimed in with today’s guest post. Jason is a part-time video game journalist and full-time sports fan. You can follow him on twitter at @winterinformal.

As always, we thank Jason for contributing.


Two years ago, I started a little experiment. I saw that many NFL prognosticators were posting mock drafts for 2016 just a few days after the 2015 draft concluded. I found as many as I could and, when the 2016 draft rolled around, rated all of them on their predictive prowess.  Regular readers may recall that last year’s article was posted here at Football Perspective.

I did the same for the 2017 draft, recording the same people’s drafts – along with a couple others – right after the 2016 draft, so it’s time to see how they did this year. Were the same people good (or bad) at predicting the draft a year out? Or was it an exercise in guesswork and randomness?

This year, I had 12 different sources to draw from – the same 10 from last year, along with a pair of new entries: Steve Palazzolo from Pro Football Focus and Todd McShay from ESPN. To recap my scoring methods:

I applied two different scoring systems to each mock draft. The first, which I call the “Strict” method, better rewards exact or very close hits: 10 points for getting a pick’s position exactly right; 8 points for being 1 pick off; 6 for being 2 off; 4 for being 3-4 off; 3 for being 5-8 off; 2 for being 9-16 off; and 1 for being 17-32 off. [continue reading…]

{ 13 comments }

Memorial Day 2017

Pat  Tillman

Pat Tillman.

It is the soldier, not the reporter, who has given us freedom of the press. It is the soldier, not the poet, who has given us freedom of speech. It is the soldier, not the campus organizer, who has given us the freedom to demonstrate. It is the soldier, who salutes the flag, who serves beneath the flag, and whose coffin is draped by the flag, who allows the protester to burn the flag.
Father Dennis Edward O’Brien, USMC

Today is a day that we as Americans honor and remember those who lost their lives protecting our country. As my friend Joe Bryant says, it’s easy for the true meaning of this day to get lost in the excitement of summer and barbecues and picnics. But that quote helps me remember that the things I enjoy today are only possible because those before me made incredibly selfless sacrifices. That includes a number of football players who have lost their lives defending our country.

The most famous, of course, is Pat Tillman, the former Arizona Cardinals safety who chose to quit football to enlist in the United States army. On April 22, thirteen years ago, Tillman died in Afghanistan. Over thirty years earlier, we lost both Bob Kalsu and Don Steinbrunner in Vietnam. You can read their stories here. For some perspective, consider that Hall of Famers Roger Staubach, Ray Nitschke, and Charlie Joiner were three of the 29 NFL men who served in the military during that war.

An incredible 226 men with NFL ties served in the Korean War, including Night Train Lane and Don Shula. Most tragically, World War II claimed the lives of 21 former NFL players.

Jack Chevigny, former coach of the Cardinals, and John O’Keefe, an executive with the Eagles, were also World War II casualties. The Pro Football Hall of Fame has chronicled the stories of these 23 men, too. Lummus received the Medal of Honor for his bravery at Iwo Jima, and you can read more about his sacrifice here. In 2015, the Giants inducted him into the team’s Ring of Honor. [continue reading…]

{ 0 comments }

In 2007, the Jets drafted David Harris in the second round, and the linebacker has turned into one of the best players in the league who has never made a Pro Bowl. Since then? That round has failed to yield a single productive player. Here are New York’s second round picks in each of the last ten years.  Note that this is not a pretty table, and that’s before realizing that the Jets traded up from 47 to 43 in the ’12 Draft with Seattle to draft Hill, while the Seahawks settled for Bobby Wagner.

Rk Year Rnd Pick Pos DrAge From To AP1 PB St CarAV G GS College/Univ
1 2017 2 39 Marcus Maye S 0 0 0 Florida College Stats
2 2016 2 51 Christian Hackenberg QB 21 0 0 0 Penn St. College Stats
3 2015 2 37 Devin Smith WR 23 2015 2016 0 0 0 1 14 3 Ohio St. College Stats
4 2014 2 49 Jace Amaro TE 22 2014 2016 0 0 0 4 17 4 Texas Tech College Stats
5 2013 2 39 Geno Smith QB 22 2013 2016 0 0 2 14 33 30 West Virginia College Stats
6 2012 2 43 Stephen Hill WR 21 2012 2013 0 0 2 4 23 19 Georgia Tech College Stats
7 2010 2 61 Vlad Ducasse T 22 2010 2016 0 0 2 13 88 30 Massachusetts

[continue reading…]

{ 4 comments }

Isaiah Crowell had a funny year. If you were paying attention in the beginning of the season — or maybe just the end of the season — you probably thought he did really well. Crowell rushed for 394 yards  in Cleveland’s first four games, the second-most among all players through their team’s first four games.  He also rushed for 347 yards in the Browns last four games, the fifth-most among all players in their team’s final four games.  And he averaged about 6.5 yards per carry during each of those quarter-season stretches, too.

The middle of the year? Well, that was a very different story.  Crowell ranked 48th among all players in rushing yards in their team’s middle 8 games of the season, with just 211 yards and an anemic 2.51 yards per carry average.  Given that Crowell was the Browns main running back, Cleveland as a team experienced similar results.  Absent a week game in week 7 when backup quarterback Kevin Hogan entered the game and wound up rushing for 104 yards himself, the Browns rushing split was dramatic: in all 8 games in the first/final quarter of the season, Cleveland rushed for at least 107 yards; in the 7 games in the middle of the season, the Browns rushed for fewer than 70 yards in every game.  Take a look:

Browns Rushing By Game


Another team that had a weird rushing split was the Miami Dolphins.  This was closely tied to the success of Jay Ajayi, who had three games with over 200 yards, one other game with over 100 yards, and failed to hit 80 yards in Miami’s other 12 games.

Dolphins Rushing By Game

I didn’t pick Miami and Cleveland at random: those two teams had the largest variation in rushing performance in 2016, at least when measured as a percentage of average output. Miami rushed for 114 yards per game, with a standard deviation of 69.8 rushing yards, or 61.8% of the team’s average performance. Cleveland was at 107.0 and 64.8, respectively, or 60.6%. The table below shows the standard deviation in rushing for each team in 2016: [continue reading…]

{ 6 comments }

Adam Steele on Negative Yards per Attempt

Adam Steele is back for another guest post. You can view all of Adam’s posts here. As always, we thank him for contributing.


On Monday, I updated my ever-evolving Positive Yards Per Attempt metric. Today’s post will serve as an introduction to its contra metric, Negative Yards Per Attempt (NegY/A). The very simple formula is as follows:

NegY/A = ( – sack yards – INT * 45) / dropbacks

The result will always be either zero or negative, but less negative (i.e., closer to zero) numbers are better. I chose to exclude fumbles because I want to maintain an apples to apples comparison with PY/A, so NegY/A covers passing plays only. I want to be very clear – NegY/A is NOT intended to be a comprehensive measure of QB play and should never be cited on its own. Its primary purpose, as with PY/A, is to estimate the relative importance of the different components of the passing game.

I won’t bore you with more words, so lets get straight to the numbers. Similar to the PY/A table, NegY/A is presented as both value over average and relative to league average on a per play basis. I wanted to cover the same timeframe as the previous article, so this includes all QB seasons since 1992 of at least 224 dropbacks (n = 829). [continue reading…]

{ 3 comments }

Last Tuesday, James “Four Touchdowns” Hanson posted a great article on the support that Peyton Manning, Tom Brady, Drew Brees and Aaron Rodgers have enjoyed throughout their careers. Two days later, he posted Part 2, and both articles were extremely well-received.  Today is the third part in his series. As always, we thank our guest posters for contributing. What follows are James’ words.


Elite Quarterbacks: Measuring Team Support by Wins & Losses

Last time, I took a look at the overall support received by four elite quarterbacks – Peyton Manning, Tom Brady, Drew Brees and Aaron Rodgers – throughout the course of their careers. [continue reading…]

{ 113 comments }

NFL Overtime Is Now Just 10 Minutes Long

The graph below shows the percentage of NFL (or AFL or AAFC) games that have ended in a tie since 1940. Note that the Y-Axis goes from only 0% to 20%: that may be misleading, but showing the graph from 0% to 100% would make for a much less useful visual in my opinion.

I’m short on time today, but most observers seem to think that shortening overtime from 15 to 10 minutes is likely to result in more ties. It certainly seems unlikely to result in fewer ties, although it’s possible that teams will just engage in tie-averse behavior earlier in overtime now.

We have spent a long time debating the best way to handle overtime. In general, I’m not too opposed to more ties in the regular season. While unsatisfying at the time, they arguably serve as a better tiebreaker than traditional tiebreakers. When two teams are 9-7, the tiebreaker to determine which one advances to the playoffs is not necessarily better than 50/50 at deciding which is the “better” or more “deserving” team. But if one of those 9-7 teams wound up being 9-6-1 rather than losing in the 74th minute of the game, that would be the team that advances. That seems more likely, in the long run, to identify the “better” or more “deserving” team. I think. Of course, that does not to change the unsatisfying result in the short term.

What do you think?

{ 14 comments }

Two pretty accurate passers.

Last week, I published two posts on quarterbacks based on their completion percentage and yards per completion averages, relative to league average. The Sam Bradford Index post looks at quarterbacks with high completion percentages and low yards/completion averages, while the Jay Schroeder Index looks at the reverse.  Freddy Alejandro made a request for career ratings in the comments, and with the help of Bryan Frye’s formula, I went ahead and generated those ratings.

Note that when calculating single-season standard deviations in both completion percentage and yards per completion, I used two modifications from last week’s posts. One, I used a three-year rolling average, and two, I used all passers (and not just qualifying passers) to calculate standard deviations. These combinations had the effect of making the standard deviations greater, which makes the Z-Scores smaller. As a result, the numbers are more compressed than they were last week, in addition to the fact that career ratings always bring less extreme ratings than a list of single-season leaders.

The most extreme rating belongs to Joe Montana, who for his career was 1.23 standard deviations above average in completion percentage.  That’s the second-best rating, behind only Steve Young: each passer led the NFL in completion percentage five different times.  From 1980 to 1997, 49ers passers led the league in completion percentage 10 times, with the rest of the league winning just eight crowns.

The difference between Young and Montana: Young had a slightly above-average yards per completion average for his career, while Montana was slightly below-average. [1]Despite Montana finishing with a higher Yd/Cmp average for his career, that is a function of era; Montana never finished higher than 10th in that metric, while Young had three top-5 finishes and … Continue reading And remember, this metric is calculated by taking each passer’s Z-Score in completion percentage and then subtracting their Z-Score in yards/completion, so a negative number in the latter category leads to a higher rating.  After all, we are trying to identify the passers who had the highest completion percentages with the lowest yards per completion averages.

Note that this is a measure of style, not quality.  Finishing high or low on this list is neither inherently good or bad.  Joining Montana in the top 3 is Chad Pennington, although most of the top quarterbacks are Hall of Famers.  Take a look: [continue reading…]

References

References
1 Despite Montana finishing with a higher Yd/Cmp average for his career, that is a function of era; Montana never finished higher than 10th in that metric, while Young had three top-5 finishes and three more top-10 finishes.
{ 9 comments }

Positive Air Yards per Attempt: 2017 Update

Adam Steele is back for another guest post. You can view all of Adam’s posts here. As always, we thank him for contributing.


Positive Yards Per Attempt: 2017 Update

If I could only share one thing from my time doing football analytics, it would be the following principle: Positive plays carry more weight than negative plays in determining the winner of a football game. I’ve already written a couple of articles on this subject and hope to further the cause with this update.

Overview

For those of you who don’t feel like reading the previous two posts, I’ll give you the basic gist. Since passing has a far greater impact on winning than running, I’ve focused my research on quarterbacks, but the principle applies to the entire offense (defense, not so sure). Despite everyone constantly harping on turnover avoidance, a potent passing offense is usually able to overcome giveaways. Conversely, avoiding turnovers is normally not enough to overcome a weak passing game. Furthermore, turnovers are highly random and situation dependent, so it follows that turnovers are a very poor method of gauging quarterback performance. Even though sacks are largely the quarterback’s fault, they are also very context dependent and only contribute a small amount in determining game outcomes. More importantly, the majority of signal callers trade sacks for interceptions or vice versa, so it’s no really fair to include one but not the other. [continue reading…]

{ 119 comments }

Jones telling George where he put the running plays in the playbook.

This week, James “Four Touchdowns” Hanson had a couple of interesting posts on the support four star quarterbacks received.  James provided some very extensive, in-depth analysis, but that doesn’t mean there isn’t still a place for simple, surface-level analysis, either!

I was wondering which quarterbacks received the most and least support from their team’s rushing attacks. Which brings us to Jeff George. There are 179 quarterbacks who have started at least 50 games in the NFL. George started games across five different teams — Indianapolis, Atlanta, Oakland, Minnesota, and Washington.  And in the 124 games he started, his teams averaged just 87.9 rushing yards per game, the fewest of any quarterback in NFL history.

In Oakland (23 of 124 starts) in ’97 and ’98, George had an in-his-prime Napoleon Kaufman, so that wasn’t a bad situation: his Raiders averaged 105.9 rushing yards per game. And in 10 starts with the Vikings in 1999, George had the impressive combination of Robert Smith and Leroy Hoard, and the Vikings averaged 126.4 rushing yards per game.

But his fortunes were much different in his other stops. George began his career, of course, with the Colts from 1990 to 1993. In his 49 starts in Indianapolis, the Colts were absolutely terrible on the ground. There were 112 team seasons from 1990 to 1993 — that’s four years during the 28-team NFL — and the four Colts teams ranked 106th, 108th, 111th, and 112th in rushing yards over that period. Over those four years, Indianapolis rushed for just 4,841 yards, more than 1,000 rushing yards behind the second-worst team (Miami). The Colts averaged an anemic 3.38 yards per carry, also worst in the league. In George’s 49 starts, Indianapolis averaged just 75.6 rushing yards per game.

George then went to Atlanta, and from ’94 to ’96 (35 starts), the Falcons rushed for just 82.3 yards per game in George’s starts. George started 16 games in both ’94 and ’95, and Atlanta averaged the fewest rushing yards per game of any team in the NFL during that period.  As you probably know, those Falcons famously ran the Run-N-Shoot under head coach June Jones, so some of this was a reflection of philosophy rather than lack of talent [1]It’s also worth noting, even this should always be implied, that rushing yards is highly correlated to team success, and George’s Colts were terrible, going 14-35. In 1994, the Falcons ranked dead last in both rushing attempts and rushing yards, and 3rd in pass attempts and 5th in passing yards.

The personnel was suited for Jones’ offense: Terance Mathis, Andre Rison, [2]Ironically, Rison was traded from the Colts to the Falcons Indianapolis traded up to acquire George when he was the projected first overall selection. Bert Emanuel, and Ricky Sanders were all starters in the Falcons 0-TE/0-FB offense, with Ironhead Craig Heyward and Erric Pegram at running back.  That offense worked pretty well (and would likely work even better today), but a high number of interceptions and a bad pass defense caused the team go to 7-9 in 1994.  In ’95, Rison (who signed an enormous contract to play in Cleveland) and Sanders (just two catches in his final season) were gone, but Eric Metcalf was acquired in Rison’s place and J.J. Birden (from Kansas City) filled Sanders’ role.  Heyward actually made the Pro Bowl and rushed for 1,000 yards, but the Falcons remained a pass-heavy team.  George was benched three games into the 1996 season, ending his time in Atlanta. [3]And to complete the story: in the final 7 starts of his career, in Washington, George’s team rushed for only 86.3 yards per game.

The table below shows the rushing yards per game averaged in games started by each quarterback, for the 179 quarterbacks with at least 50 starts. The table is sorted by rushing yards per game, from most to fewest, so George is at the very bottom (the table is fully sortable and searchable). [continue reading…]

References

References
1 It’s also worth noting, even this should always be implied, that rushing yards is highly correlated to team success, and George’s Colts were terrible, going 14-35.
2 Ironically, Rison was traded from the Colts to the Falcons Indianapolis traded up to acquire George when he was the projected first overall selection.
3 And to complete the story: in the final 7 starts of his career, in Washington, George’s team rushed for only 86.3 yards per game.
{ 17 comments }

The Jay Schroeder Index

Yesterday, I looked at the quarterbacks who were the biggest checkdown artists: i.e., which players had the best completion percentages and lowest yards per completion averages. I measured this by calculating how many standard deviations above/below average each quarterback was in those two categories in each year.

Today, the reverse. And the big winner is rookie Terry Bradshaw. We all know Bradshaw stunk as a rookie. He had a whopping 11.0% interception rate, which was horrible even for 1970. In fact, he has the second most attempts in history by a player with an 11% or worse interception rate. And since Bradshaw also ranked dead last in completion percentage, he ranked 2nd to last in ANY/A that year.

Of course, you might wonder: how could someone with the worst completion percentage and by far the worst interception rate not rank last (by a mile) in ANY/A? Well, it’s because Bradshaw ranked 2nd in the NFL in yards per completion as a rookie. He was your ultimate boom/bust passer, finishing 2.75 standard deviations below average in completion percentage and 2.18 standard deviations above average in yards per completion.

The top of the list features a bunch of interesting names, but I’m calling this the Jay Schroeder Index for a reason.  Schroeder only had 8 seasons where he threw at least 200 passes, but he makes the top 200 in 6 of those 8 seasons!  Schroeder made the list in ’86, ’87, and ’88 (despite moving from the Redskins to the Raiders this year), and then in ’90, ’91, and ’92.  He only missed the list in 1989 during this run, and that’s because he threw just 194 passes.  But in 1989, of the 34 quarterbacks with at least 150 pass attempts, Schroeder had the lowest completion percentage (46.9%) and by far the highest yards per completion average (17.0, the best of his career).  In other words, Schroeder had a top-200 season in 6 out of 7 straight years, with the lone exception being perhaps his most Schroeder-esque season! Of course, Schroeder’s love of the deep ball isn’t new to readers of this site.

The table below shows the top 200 seasons based on the Schroeder Index, using the same formula as yesterday: [continue reading…]

{ 24 comments }

The Sam Bradford Index

Sneak peak at the average length of a Bradford completion

You may have heard that Sam Bradford set the completion percentage record in 2016 by completing 71.6% of his passes.

What you may not have heard: Bradford also ranked last in the league in passing yards gained per completion, which makes his record-breaking performance a somewhat hollow achievement. Bradford is the fifth quarterback in the Super Bowl era to rank 1st in completion percentage and last in yards per completion, joining David Carr (HOU 2006), Eric Hipple (DET 1986), Joe Montana (SFO 1980) in his first year as a starter, and Sonny Jurgensen (WAS 1969). In general, things didn’t work out well for those quarterbacks:  Carr posted a 6-10 record in 2006, while Hipple went 3-7, and Montana went 2-5.  Bradford went 7-8 last season, meaning only Jurgensen (7-5-2) posted a winning record of that bunch (and Washington had a negative points differential and faced a very easy schedule that year).

Expand the list to finishing 1st or 2nd in completion percentage and last or 2nd-to-last in yards per completion, and you bring in four more quarterbacks: Chad Pennington (NYJ 2007, 2nd in both), Joe Montana (SFO 1981, 1st in comp%, 2nd-to-last in YPC), Fran Tarkenton (MIN 1977, 1st, 2nd) and Len Dawson (KAN 1972, 2nd in comp%, last in YPC).  The results there were mixed: Pennington went 1-7, while Montana went 13-3, Tarkenton went 6-3, and Dawson went 7-5.  It is worth pointing out that Montana and Tarkenton both had above-average Y/A ratios that year: in other words, having a high completion percentage is great, but only if it doesn’t come at the expense of your yards per completion average.

How much of a checkdown artist was Bradford last year? He finished 1.95 standard deviations above average in completion percentage last year among qualifying passers, a metric commonly referred to as a Z-score. He also finished 1.82 standard deviations below average in yards per completion. If you take his Z-Score in completion percentage (+1.95), and subtract his Z-Score in yards per completion (-1.82), you get a result of +3.77.

That may not mean much in the abstract, but it ranks as the 3rd most extreme result in the Super Bowl era, behind only Jurgensen 69 and Carr 06. The table below shows the top 200 most extreme checkdown artists — by this metric — since 1966:

RkPlayerTeamYearCmp%Yd/CmpZ-Score (Cmp)Z-Score (Y/C)Total
1Sonny JurgensenWAS196962%11.32.78-1.774.55
2David CarrHOU200668.3%9.22.01-2.024.03
3Sam BradfordMIN201671.6%9.81.95-1.823.77
4Eric HippleDET198663%10.01.72-2.043.76
5Ken AndersonCIN198270.6%11.42.76-0.913.67
6Kelly HolcombCLE200363.9%9.31.19-2.483.67
7Joe MontanaSFO198064.5%10.21.84-1.783.62
8Joe MontanaSFO198766.8%11.52.45-1.133.59
9Chad PenningtonNYJ200768.8%9.91.68-1.863.54
10Fran TarkentonMIN197860.3%10.11.46-1.963.43
11Fran TarkentonMIN197564.2%11.02.27-1.083.35
12Drew BreesNOR201068.1%10.31.81-1.483.29
13Steve YoungSFO199566.9%10.71.94-1.343.28
14Kelly HolcombBUF200567.4%9.71.57-1.633.20
15Steve YoungSFO199667.7%11.32.69-0.483.16
16Joe MontanaSFO198163.7%11.51.97-1.193.16
17Matt RyanATL201367.4%10.31.56-1.583.14
18Virgil CarterCIN197162.2%11.81.78-1.243.02
19Steve BartkowskiATL198467.3%11.92.16-0.853.01
20Drew BreesNOR200767.5%10.11.36-1.602.96
21Ken StablerHOU198064.1%10.91.76-1.202.95
22Troy AikmanDAL199663.7%10.61.59-1.352.93
23Len DawsonKAN197257.4%10.51.19-1.742.93
24Fran TarkentonMIN197760.1%11.21.71-1.222.92
25Greg LandryDET197756.3%10.10.86-2.042.90
26Shane MatthewsCHI199960.7%9.91.11-1.792.90
27Joe MontanaSFO198970.2%13.03.200.322.88
28Kirk CousinsWAS201569.8%11.01.93-0.872.80
29Roman GabrielPHI197457.1%9.70.68-2.112.79
30Rich GannonOAK200165.8%10.61.75-1.022.76
31Brett FavreGNB199264.1%10.71.23-1.532.76
32Drew BreesNOR201171.2%11.72.37-0.382.75
33Ken AndersonCIN198366.7%11.81.90-0.812.72
34Norm SneadNYG197260.3%11.81.79-0.932.72
35Steve DeBergSFO197960%10.51.24-1.462.70
36Ryan FitzpatrickCIN200859.4%8.6-0.44-3.122.68
37Joe MontanaSFO198561.3%12.11.86-0.822.68
38Peyton ManningIND201066.3%10.41.34-1.332.67
39Dave KriegSEA199165.6%11.11.77-0.902.67
40Christian PonderMIN201262.1%9.80.34-2.322.66
41Kordell StewartPIT199958.2%9.20.25-2.402.65
42Fran TarkentonNYG197158.5%11.41.11-1.542.65
43Joe TheismannWAS198555.5%10.60.22-2.422.64
44Matt RyanATL201268.6%11.21.94-0.632.57
45Charlie FryeCLE200664.3%9.71.06-1.512.57
46Jeff GeorgeIND199160.2%10.00.53-2.022.55
47Bob GrieseMIA197863%12.12.06-0.492.55
48Archie ManningNOR197861.8%11.71.79-0.752.54
49Brett FavreNYJ200865.7%10.11.09-1.452.54
50Dave KriegCHI199659.9%10.10.58-1.942.53
51Gary HuffCHI197555.6%9.50.45-2.052.51
52Drew BreesNOR201469.2%10.91.71-0.802.50
53Matthew StaffordDET201567.2%10.71.20-1.252.45
54Sonny JurgensenWAS197059.9%11.71.57-0.842.40
55Ken AndersonCIN197464.9%12.52.34-0.062.40
56Jim HarbaughIND199761.2%10.91.29-1.112.40
57Ryan TannehillMIA201466.4%10.30.97-1.412.38
58Danny WhiteDAL198559.3%11.81.30-1.082.38
59Steve WalshCHI199460.6%10.00.55-1.832.37
60Ken AndersonCIN197256.8%11.21.08-1.282.35
61Steve YoungSFO199767.7%12.63.040.702.34
62Archie ManningNOR198157.8%10.80.61-1.722.33
63Troy AikmanDAL199369.1%11.42.25-0.062.32
64Mike LivingstonKAN197854.8%9.90.24-2.072.31
65Sonny JurgensenWAS196857.2%11.91.19-1.092.29
66Joe MontanaSFO198364.5%11.81.45-0.822.27
67Jay CutlerCHI201466%10.30.83-1.432.26
68Josh FreemanTAM201162.8%10.40.64-1.632.26
69Greg LandryBAL197959.1%10.91.03-1.232.26
70Bobby HebertNOR198962.9%12.11.49-0.772.25
71Ken O'BrienNYJ198960.4%11.60.90-1.352.25
72Brian GrieseTAM200469.3%11.31.83-0.412.25
73Steve BartkowskiATL198363.4%11.61.23-1.012.24
74Ken AndersonCIN198060.4%10.70.86-1.372.23
75Len DawsonKAN196757.7%12.91.56-0.662.22
76Roman GabrielRAM196954.4%11.70.73-1.492.22
77Warren MoonHOU199264.7%11.31.35-0.862.21
78Joe MontanaSFO198662.2%11.71.54-0.672.21
79Ken StablerOAK197362.7%12.31.89-0.302.19
80John BrodieSFO196955.9%12.41.14-1.052.18
81Jon KitnaSEA200062%10.30.79-1.402.18
82Steve BartkowskiATL198263.4%11.51.29-0.882.17
83Jim KellyBUF198759.7%11.20.78-1.392.17
84Randy WrightGNB198857.8%10.60.60-1.572.17
85Brad JohnsonMIN199760.8%11.01.20-0.962.16
86Neil O'DonnellCIN199861.8%10.51.10-1.052.15
87Cody CarlsonHOU199265.6%11.51.53-0.602.13
88Rich GannonMIN199159.6%10.30.40-1.732.13
89Chris ChandlerHOU199563.2%10.91.08-1.052.13
90Troy AikmanDAL199165.3%11.61.70-0.412.11
91Dan FoutsSDG198462.5%11.81.14-0.972.11
92Ken AndersonCIN198463.6%12.01.37-0.732.11
93Patrick RamseyWAS200462.1%9.90.32-1.782.10
94Sonny JurgensenWAS196658.3%12.61.31-0.782.09
95Philip RiversSDG201264.1%10.70.84-1.252.09
96Dan FoutsSDG197962.6%12.31.82-0.262.08
97Peyton ManningIND200266.3%10.71.37-0.722.08
98Joe MontanaSFO199061.7%12.31.79-0.292.08
99Roman GabrielRAM196654.7%11.70.71-1.372.08
100Joe FlaccoBAL201664.9%9.90.35-1.732.08
101Peyton ManningIND200866.8%10.81.36-0.722.08
102Dieter BrockRAM198559.7%12.21.41-0.662.07
103Brad JohnsonTAM200160.8%10.00.38-1.692.07
104Anthony WrightBAL200561.7%9.60.36-1.712.07
105Brett FavreGNB200365.4%10.91.55-0.512.07
106Ken AndersonCIN198162.6%12.51.72-0.342.07
107Tom BradyNWE200163.9%10.81.24-0.822.06
108Bob BerryATL197058%11.61.18-0.882.06
109Terry BradshawPIT197154.4%11.10.34-1.712.05
110Fran TarkentonMIN197661.9%11.61.38-0.672.05
111Jeff HostetlerOAK199660.2%10.50.65-1.382.04
112Peyton ManningIND200367%11.31.95-0.092.03
113Peyton ManningDEN201268.6%11.61.94-0.072.01
114Drew BreesNOR201670%11.11.57-0.422.00
115Ken StablerOAK197961%11.91.47-0.532.00
116Johnny UnitasBAL196758.5%13.41.73-0.261.99
117Drew BreesNOR201368.6%11.61.86-0.111.97
118Joe FergusonBUF198455.5%10.4-0.37-2.341.97
119Carson PalmerCIN200567.8%11.11.65-0.311.97
120Jim HarbaughCHI199361.5%10.00.67-1.291.96
121Tom BradyNWE200262.1%10.10.51-1.441.96
122Jim KellyBUF199063.3%12.92.320.371.94
123Joe FlaccoBAL201564.4%10.50.40-1.541.94
124Brett FavreGNB199462.4%10.70.86-1.081.94
125Steve DeBergDEN198258.7%10.70.35-1.591.94
126Steve DeBergTAM198460.5%11.50.70-1.231.93
127Jim KellyBUF199463.6%10.91.09-0.831.91
128Sonny JurgensenWAS196756.7%13.01.35-0.561.91
129Jim ZornSEA198159.4%11.80.99-0.901.90
130Len DawsonKAN197458.7%11.41.02-0.871.89
131Bernie KosarCLE198959.1%11.70.59-1.301.89
132John BrodieSFO196857.9%12.91.33-0.561.89
133Dan PastoriniHOU197353.1%9.6-0.42-2.311.89
134Ray LucasNYJ199959.2%10.40.59-1.291.88
135Philip RiversSDG201369.5%11.82.080.201.88
136Billy KilmerNOR197057%11.50.98-0.901.88
137Jim McMahonMIN199360.4%9.80.44-1.441.88
138Ken StablerNOR198261.9%11.51.00-0.881.87
139Chad PenningtonNYJ200268.9%11.31.880.021.87
140Troy AikmanDAL199263.8%11.41.18-0.681.86
141Bobby HebertNOR198858.6%11.30.75-1.101.85
142Norm SneadPHI196852.2%10.90.27-1.581.85
143Ken O'BrienNYJ198759.5%11.50.75-1.101.85
144Jeff GarciaSFO200262.1%10.20.52-1.321.85
145Drew BreesNOR201568.3%11.41.50-0.351.84
146Bobby HebertATL199660.2%10.70.66-1.151.81
147Brian GrieseDEN200161%10.30.42-1.391.81
148Dan MarinoMIA198559.3%12.31.28-0.531.81
149Jeff HostetlerNYG199162.8%11.41.13-0.671.80
150Philip RiversSDG201566.1%11.00.89-0.901.79
151Brian GrieseDEN200266.7%11.01.45-0.331.78
152Tony EasonNWE198661.6%12.11.39-0.391.78
153Matt RyanATL201062.5%10.40.37-1.411.78
154Danny WhiteDAL198362.7%11.91.08-0.701.77
155Chad PenningtonNYJ200664.5%10.71.12-0.661.77
156Jim EverettNOR199464.1%11.11.17-0.601.77
157John BrodieSFO196654.3%12.10.65-1.111.76
158David CarrHOU200560.5%9.70.12-1.641.76
159Rich GannonOAK200267.6%11.21.63-0.131.76
160Sam BradfordPHI201565%10.80.58-1.171.75
161Fran TarkentonMIN197361.7%12.51.64-0.111.75
162Aaron RodgersGNB201267.2%11.61.60-0.151.75
163Daunte CulpepperMIN200164.2%11.11.32-0.431.74
164Steve McNairBAL200663%10.30.76-0.981.74
165Gary CuozzoNOR196751.5%11.70.25-1.491.74
166Ken O'BrienNYJ198662.2%12.31.54-0.201.74
167Alex SmithKAN201667.1%10.70.88-0.851.73
168Steve YoungSFO199470.3%12.32.290.581.71
169Brad JohnsonMIN200562.6%10.20.55-1.141.70
170Archie ManningNOR197755.1%11.40.61-1.091.69
171Dave KriegSEA198760.5%12.00.99-0.701.69
172Kent GrahamNYG199959%10.60.54-1.131.67
173Fran TarkentonMIN197256.9%12.31.09-0.581.67
174Neil LomaxSTL198657%10.80.24-1.421.67
175Ryan FitzpatrickBUF201162%10.90.48-1.181.66
176Chad PenningtonNYJ200465.4%11.01.01-0.651.66
177Richard ToddNYJ198359.5%11.30.41-1.241.65
178Joe NamathNYJ197649.6%9.6-0.51-2.151.65
179Bernie KosarCLE199162.1%11.40.98-0.671.65
180Bert JonesBAL197757%12.01.02-0.621.64
181Sam BradfordSTL201060%9.9-0.28-1.911.63
182Joey HarringtonDET200355.8%9.3-0.84-2.471.63
183Steve DeBergSFO198057.9%10.70.28-1.351.63
184Bob GrieseMIA197758.6%12.51.39-0.241.62
185Peyton ManningIND200968.8%11.51.50-0.111.62
186Bernie KosarCLE198860.2%12.11.07-0.541.61
187Brad JohnsonWAS200062.5%11.00.90-0.701.61
188Steve FullerKAN197954.1%10.2-0.10-1.701.60
189Dave KriegSEA198957.3%11.60.18-1.411.59
190Dan PastoriniHOU197456.7%11.20.59-1.001.59
191Rodney PeeteDET199362.3%10.60.83-0.751.58
192Bart StarrGNB196662.2%14.51.970.401.58
193Bill MunsonDET197456.8%11.30.63-0.951.57
194Kent NixPIT196750.7%11.70.08-1.491.56
195Jon KitnaDAL201065.7%11.31.20-0.371.56
196Chad PenningtonMIA200867.4%11.41.50-0.061.56
197Ken O'BrienNYJ198855.7%10.90.20-1.361.56
198Gary DanielsonDET197856.7%11.50.65-0.901.56
199Alex SmithKAN201465.3%10.80.66-0.891.55
200Kyle OrtonBUF201464.2%10.50.36-1.191.55

As always, please leave your thoughts in the comments. Tomorrow, we’ll look at the opposite result: any guesses as to the leaders in that category?

{ 46 comments }

On Tuesday, James “Four Touchdowns” Hanson posted a great article on the support that Peyton Manning, Tom Brady, Drew Brees and Aaron Rodgers have enjoyed throughout their careers. That was Part 1, and it received over 100 comments, so give it (and the comments section) a read. Today comes Part 2. As always, we thank our guest posters for contributing.  What follows are James’ words.


Team Support by Traditional Stats and Expected Points

About 35% to 55% of all offensive plays (depending on game script, offensive philosophy, personnel, etc.) are running plays, so there is value in looking at what each quarterback’s running game produced. Even if teams tend to run more after building a lead, it’s still a key part of closing out games. I’ve included their average league-wide ranks so we can get a better idea of how many seasons they enjoyed with great rushing support.

I’ve also included turnovers minus interceptions, which I assume are fumbles from the WRs, RBs, QBs, and Special Teams – but since I can’t determine who is responsible for what, I’ve included that information here under the assumption that most fumbles aren’t from the quarterback.

I should also note that while the rushing yards and touchdowns have had the quarterback’s contributions subtracted, the rushing first downs and expected points include any first downs gained by quarterback sneaks and scrambles.

The light green indicates the leader in that category, while the pink indicates the least amount of support in that metric.


In general, it looks like Brady and Brees have enjoyed the most rushing support while Rodgers has suffered the least amount of support by conventional metrics – and remember, those TD and first down totals include ones he picked up himself, meaning his support in those areas is likely even worse than the numbers indicate. Manning and Brady have had a top ten run game in 7 seasons, while Brees has had one 3 times and Rodgers has had a top ten running game in 2 seasons. [continue reading…]

{ 169 comments }

Coaching and GM Tenures in 2017

Ambassadors to the United Kingdom and Christian Hackenberg

There are 10 teams that have a coach and a GM that both arrived in the same season, which is the most common setup in the league. This includes successful organizations like New England (Bill Belichick and Bill Belichick, 17 years), Seattle (John Schneider and Pete Carroll, 7 years), Arizona (Steve Keim and Bruce Arians, 4 years) and Kansas City (John Dorsey and Andy Reid, 4 years), along with some teams that are hoping to duplicate such success. Four that are still working their way through the early years of marriage, while two are just getting started in 2017.

Ryan Pace and John Fox have been together in Chicago for two years, as have Mike Maccagnan and Todd Bowles in New York, while Sashi Brown and Hue Jackson in Cleveland and Chris Grier and Adam Gase in Miami just finished their first seasons. Finally, GM John Lynch and HC Kyle Shanahan just arrived in San Francisco, while Buffalo added HC Sean McDermott in January before switching GMs and bringing in Brandon Beane after the 2017 Draft.

Washington currently has a vacancy at General Manager, after firing Scot McCloughan in March after two winning years. Four other teams (in addition to Washington and Buffalo) are in the unique situation of having a head coach with a longer tenure than its GM:

  • In 2014, Mike Mularkey was hired to be Tennessee’s tight ends coach. Midway through the 2015 season, the Titans fired Ken Whisenhunt and promoted Mularkey to interim head coach. Two months later, Tennessee fired GM Ruston Webster and hired Jon Robinson from Tampa Bay; Robinson, despite significant backlash, chose to retain Mularkey as the team’s head coach. That has worked out pretty well so far: after going 3-13 (2-7 under Mularkey) in 2015, the Titans went 9-7 in the first year under Mularkey and Robinson.
  • Ron Rivera has been in Carolina since 2011. After a 6-10 first season, Carolina began the year 3-9 in 2012, prompting me to write how attractive this potentially vacant job would be. Well, the Panthers finished 7-9 and retained Rivera, but fired Marty Hurney, who had been the team’s general manager since 2002. The Panthers then hired Dave Gettleman, who retained Rivera, and the rest has been history. Rivera has been named the AP Head Coach of the Year twice since Gettleman arrived.
  • The Lions hired Jim Caldwell in 2014, just a year removed from his impressive playoff run that resulted in a Super Bowl as the Ravens offensive coordinator. At the time, Detroit’s GM was Martin Mayhew, but he was fired midway through 2015 with Detroit just 1-7. The Lions hired ex-Patriot Bob Quinn in 2016, who chose to retain Caldwell, after the Lions went 6-2 down the stretch in 2015. Like Mularkey and Robinson, Caldwell and Quinn went
  • Finally, the Colts brought in Chuck Pagano and Ryan Grigson in 2012. Indianapolis followed three straight 11-5 seasons with a pair of 8-8 campaigns; after nearly firing one or both men after 2015, Colts owner Jim Irsay finally ended the failed marriage by canning Grigson after the 2016 season. He’s been replaced by Chris Ballard, who is retaining Pagano… so far.

The table below shows this information for all 32 teams. It’s pretty self-explanatory, but for clarity’s sake, note that the years column excludes the yet-to-be-played (spoiler!) 2017 season. [continue reading…]

{ 16 comments }

Today’s guest post comes from James “Four Touchdowns” Hanson, a relative new reader to the site. As always, we thank our guest posters for contributing.


Elite Quarterbacks: Measuring Overall Team Support

It’s easy for football fans to buy into the mainstream logic that if you have an elite quarterback, your team will have a winning record, enjoy trips to the post-season and even win a few championships. The better the quarterback, the more wins and titles you can expect… right?

But that logic doesn’t always hold up.  Dan Marino, Fran Tarkenton, Warren Moon, Dan Fouts, Jim Kelly, Sonny Jurgensen, Philip Rivers, and so on, provide examples to the contrary. And while his talents have been unfairly portrayed at times, the fact that Terry Bradshaw has four Super Bowl rings while superior passers have none presents a disconnect if you think great quarterback talent is measured by titles.

If we go by an average time of possession of 30 minutes per team, that means that half the time, a team’s quarterback isn’t even on the field. And if 35% to 55% of your team’s offensive plays are running plays… doesn’t that mean the quarterback really only affects 22% to 33% of the total game time? And once you get into other factors that affect a passer’s game, like play design and coaching, offensive line talent, receiving talent, quality of opposition, etc., attributing credit and blame gets pretty murky.

So while we have a general feeling that some quarterbacks receive more support than others, so how do we go about measuring it through metrics? Unfortunately, due to the nature of passing stats, I don’t know of a way to separate a quarterback from his receivers, pass blocking, scheme and play-calling. Whether it’s passer rating, ANY/A, or passing EPA, none of them can tell you which percentage of the credit (or blame) should be shared with those external factors.

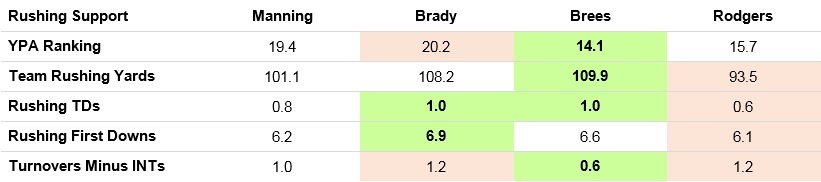
That said, we can measure a quarterback’s support by looking at the numbers produced by his running game, defense and special teams. While I’d love to run these numbers for all quarterbacks, my ability to collect them is fairly limited (basically, cutting and pasting from Pro Football Reference – I don’t know enough about Python or R to run a spider to scrape them all in one go), so I will be focusing on four quarterbacks that are perceived to be “elite” by general mainstream consensus – Peyton Manning, Tom Brady, Drew Brees and Aaron Rodgers.

Due to length, I will be looking at these numbers in three separate articles. This one will focus on what support they received in these areas overall and the second will take a look at team support relative to the quarterback’s performance – how often their teams win when they have below-average performances and how often they lose when they perform at a high level (as measured by stats, natch).

Overall ANY/A, Passer Rating, & Expected Points Metrics

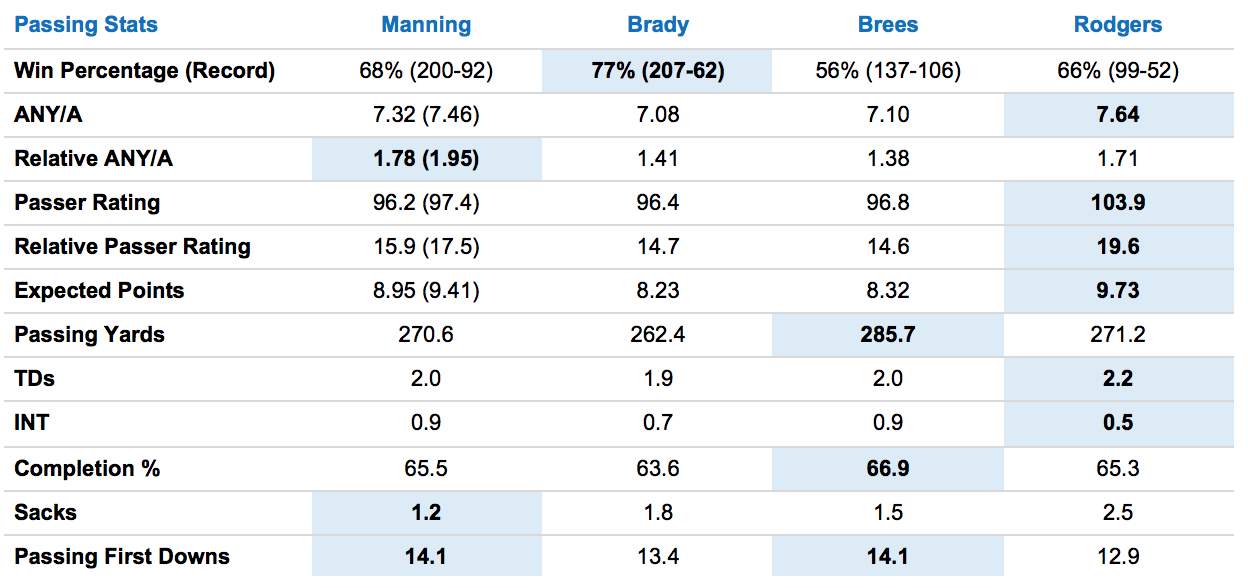
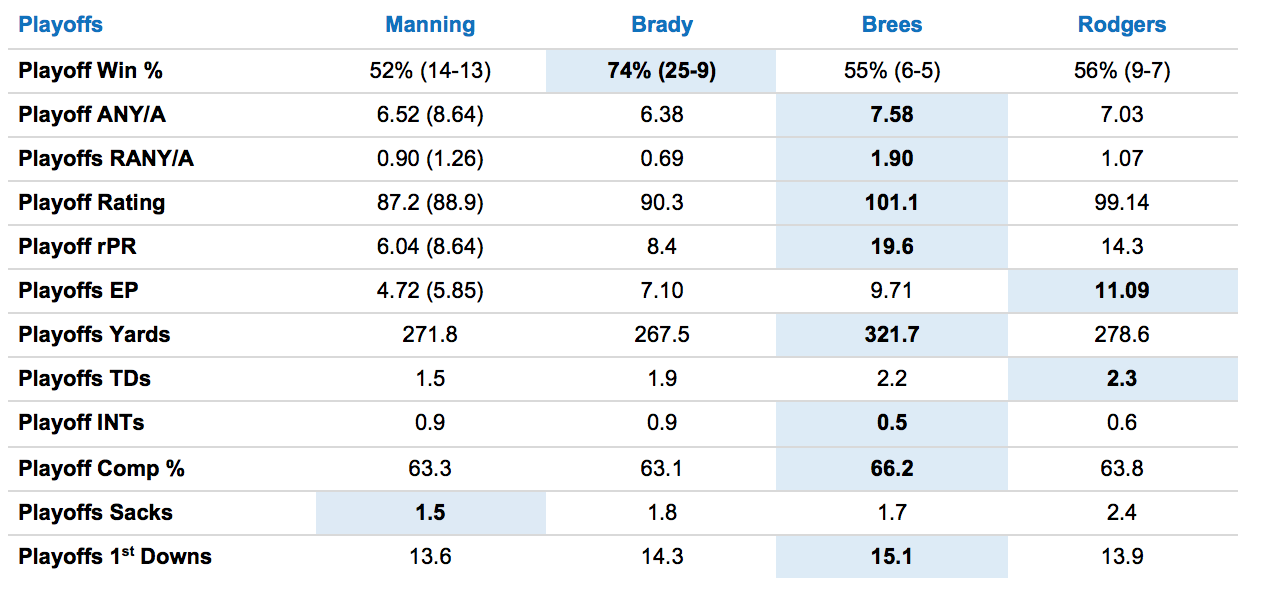
So let’s dig into the numbers. Here are the quarterbacks’ average stats per game for their overall careers including playoff games (which is why you may notice a difference between these and career averages that only include the regular season). The cells shaded blue indicate that quarterback is the leader among the four in that metric. While all of these metrics should be familiar to readers of the site, I have also included a metric I’m calling Relative Passer Rating (rPR) and it’s essentially the same concept as Relative ANY/A – it measures passer rating compared to the average for that season. For example, if the average is 80.0 and the passer earns a 90.0, his rPR would be +10.0.

As Peyton Manning is the only one of the four to suffer a physical decline in a career ending season, I have included his pre-2015 averages for the efficiency metrics in parenthesis next to his actual averages, though this will not affect any of the analysis from this point on – it’s more of a “nice to know”.

Great numbers across the board, as to be expected by elite players but it’s amazing how much higher Brady’s win percentage is than the other players despite not producing any clear statistical advantage in the efficiency or traditional metrics – and how much lower Brees’ win percentage is than the others despite his numbers being on par with the other three QBs.

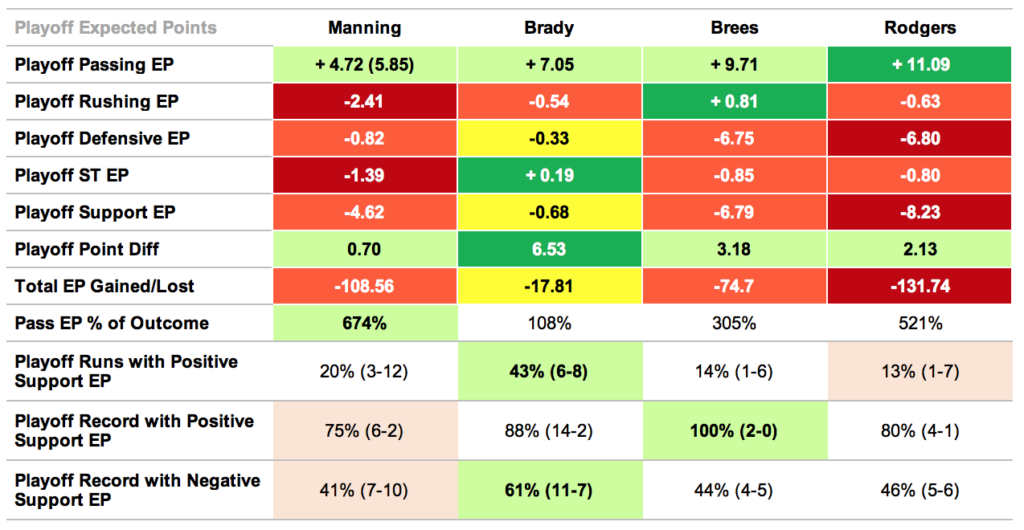
Additionally, as their success in the playoffs makes us the biggest difference in the way people perceive these players, I will break out their playoff numbers in a separate table –

The numbers here probably come as a surprise – I know I didn’t expect Brees to sweep nearly every passing metric for the playoffs. While his smaller sample size comes into play, it doesn’t seem to have affected his win percentage, which is about on par with everyone except Tom Brady.

So there’s our starting point – we can see how each player has performed relative to the others, and while there are some clear leaders in the playoffs, they’ve produced at a similar level overall throughout their careers. Now let’s see how their teams have supported them.

Team Support Measured by Expected Points

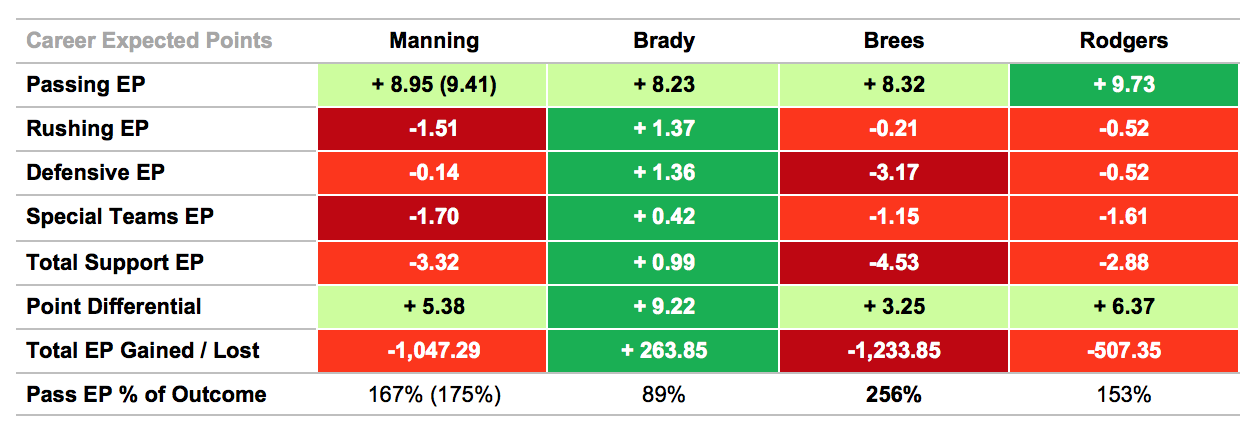
As they’re the metrics that seem mostly closely tied to the margin of victory and defeat, I figured we’d start with Expected Points. Mike from Sports Reference defines Expected Points as a way to “break down the contributions each team’s various squads made to the margin of victory.” Those last few words are key; EP are applicable to the margin of victory – or defeat.

With that in mind, I went about measuring the EP of each quarterback’s passing offense against the rest of the team – running game, defense, and special teams. The sum of those three squads make up the Total Support EP number while the point differential is the average margin of wins and losses across their careers.

The EP Gained / Lost metric represents the average EP each quarterback’s running game, defense, and special teams have added or subtracted per game from the passing EP they generated. I also felt that per game average didn’t fully illustrate what effect those added or subtracted points had over the course of each player’s career, so I included the sum or difference in Total EP Gained / Lost.

Finally, since EP is tied to the margin of victory or defeat, I included the Point Differential to give the numbers some context. I also showed what each QB’s passing EP as a percentage of the average point differential in Pass EP % of Outcome so we could see how much credit or blame each quarterback should take for his team’s outcomes on average.

Red indicates negative EP while green indicates positive EP; dark green and dark red indicate who finished first and last in each category respectively.

First off, it’s clear that these players’ passing offenses have been the driving force behind their teams’ success. Compare their passing EP to the average margin of victory and you see that it’s each quarterback’s passing game that has created most or all of that point differential – it looks like most of the time, these guys carry their teams.

That said, we can see the EP support (AKA negative plays) has been very different for one player compared to the other three – Brady is the only one to have positive EP support in any category and amazingly has positive EP in ALL support categories. It’s said that the quarterback affects all other players on the field and while that may be true, we’re not seeing it in these results – every other QB has a higher EP average per game than Brady but gets worse support than him.

If we were to round the numbers, it looks like Manning’s and Rodgers’ team support have cost their teams around a field goal in points, on average, while Brees loses roughly 5 points. Meanwhile, Brady’s support has been worth an extra point to his Patriots. We shouldn’t misinterpret these numbers to suggest that somehow Brady is being carried by great support – it’s clear that Brady’s passing game is the engine that drives the Patriots’ success as a team but he’s the only quarterback of the four whose supporting elements haven’t cost him points.

This has led to his teams actually adding positive EP to his games overall, giving Brady nearly 264 expected points to his overall point differential over the course of his career. Manning and Brees, on the other hand, has had their teams cost them over 1,000 expected points and at the rate Rodgers’ offenses have been producing, Rodgers will likely join them by the end of his career.

Of course, there’s only so much we can see from these per game averages – let’s see what that EP looks like spread out over the course of their careers. After all, a team that provides -5 EP in five games and a team that provides +5 EP in two games and -20 EP in three games will both average out to -5 EP per game. But the first team had five straight bad games while the second team had three good games and two catastrophically bad games. Clearly, not the same thing.

So let’s look at how many games each passer and team have provided positive and negative support – and then let’s see how often that support has created a two-possession lead or deficit (9 points), three-possession lead or deficit (17 points), and while I know 24 points is technically three possessions, I think the odds of any team getting three TDs with three two-point conversions is very low – so I set 3 TDs (21 points) as my threshold for three-possessions. Additionally, we should see how often our QBs do the same, so those passing EP numbers are also included.

The leaders in passing EP are marked blue, the leaders in support EP are marked green, and ones with the least EP in each category are highlighted in red –

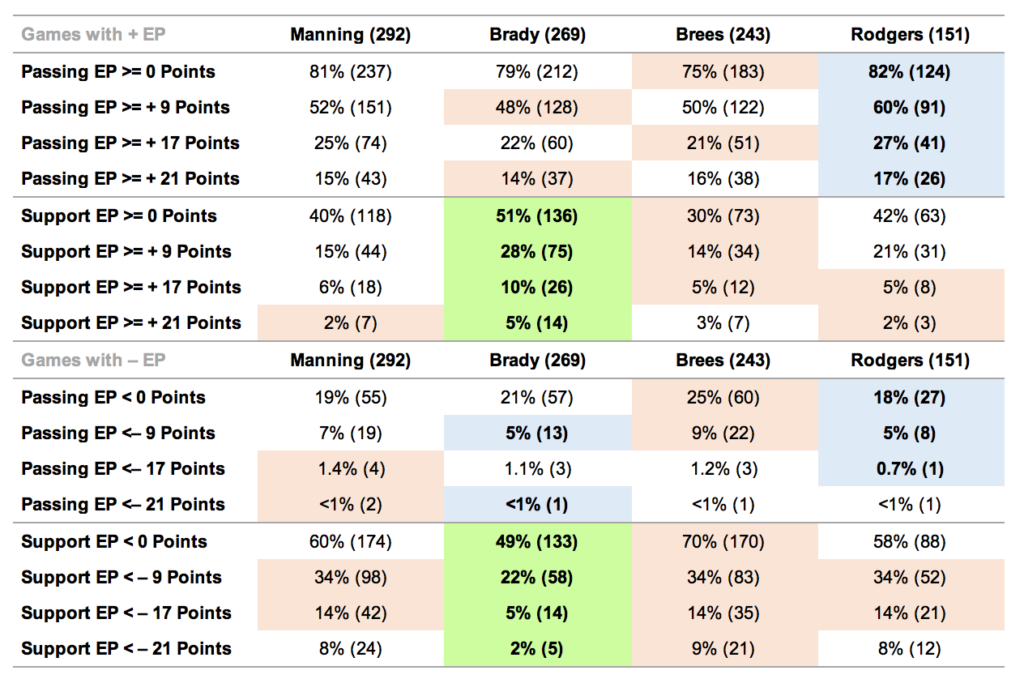
The numbers reflect what we’ve seen before – Aaron Rodgers leads in almost all categories with passing EP, having the largest number of games with positive EP and the fewest with negative EP. Meanwhile, Brady has the most games with positive support and the fewest games with negative support across all categories by a substantial margin, though he’s tied for the lead with Rodgers for the fewest games with negative EP over 9 points.

That all said, when you look at the actual number of games with negative passing EP, it’s really only a handful of difference between these players – they’re all incredible, posting positive EP in the vast majority of their games and two possessions worth of positive EP in about half of their games. These guys are considered the elites of the sport for a reason and these numbers bear that out.

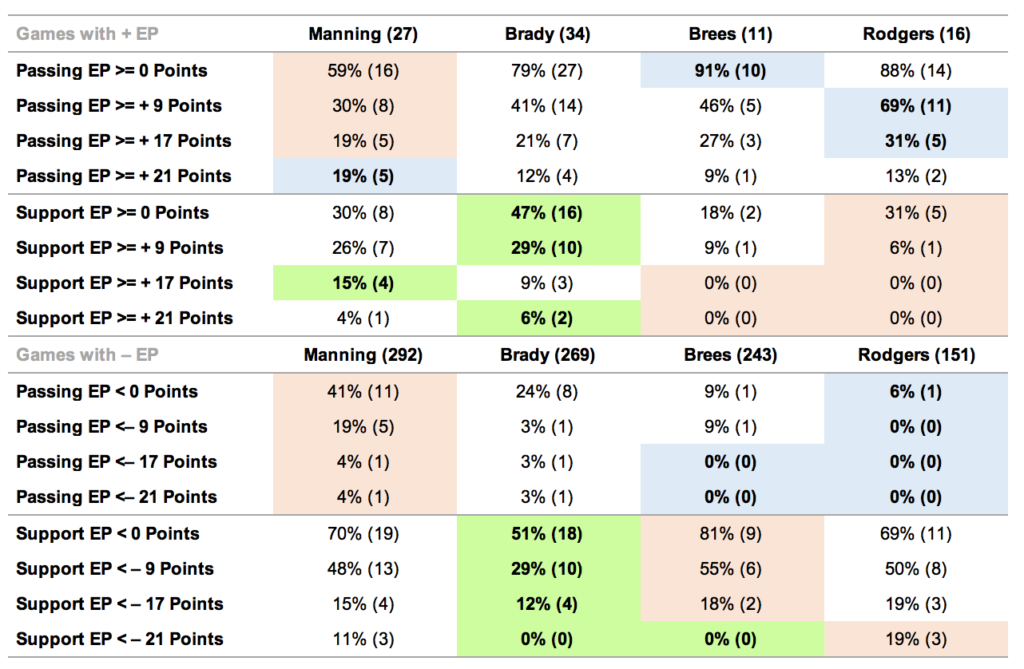
As before, I included their playoff numbers since that’s the core difference in how fans perceive them. One difference here from the previous chart, though – since none of them enjoyed totally positive playoff support, the QB with the smallest deficit of supporting cast EP is highlighted in yellow–

If you think about it, it’s kind of amazing that despite Manning, Brady and Brees playing over 240 games (Rodgers at 151), a small fraction of them determine how the general public sees these players — the playoff games. Manning has played 292 games and the outcome of 27 will determine how he’s remembered. Brady has played 269 and 34 are what makes him the GOAT to most of the public. Brees has played 243 and the outcome of 11 is what keeps him out of most people’s conversation for GOAT. Kinda nuts – but at least Rodgers still has a lot of his career ahead of him. Hopefully, Green Bay will get the man some help!

With that in mind, I decided to add three rows to this column since we’re dealing with such a small sample size for the playoffs so we can understand the narrative behind the averages a little better – how many playoff appearances they had with positive support EP, their record with that support, and then their record with negative support. While they all had negative support in the playoffs, Brady’s did the least amount of damage – despite both Brees and Rodgers having higher passing EP, their playoff point differential is less than half of Brady’s. Meanwhile, it seems Manning has to assume some responsibility for his lack of playoff success as his passing EP drops dramatically in the playoffs.

That said, in terms of win percentage, they all do better with positive support – Manning seems to do worst but still has an incredible 75% win percentage, way up from his 52% overall.

And while the results so far of this study have shown that Brady has received the most support while not always posting the best efficiency metrics or raw stat totals, we have to give him his due – he is the only QB of the four with a winning playoff record in games with negative EP support.

So how does this all translate to Super Bowls? Two of Manning’s three playoff runs with positive support netted him a Super Bowl title (his other was in 2014 when he was hindered by injuries that would ultimately end his career), while Brees’ and Rodgers’ only playoff run with positive support led to them winning a Super Bowl (Brees’ Special Teams EP in his Super Bowl was nearly 10 points alone!). On the other side, Tom Brady has won three Super Bowls with positive support and two Super Bowls with negative support (though all Super Bowl runs featured at least one game with positive support that contributed more to the margin of victory than passing EP), which certainly adds some credibility to the idea that he’s got a bit more “clutch” to him than the other three quarterbacks.

All that said, we can see how much more the other three quarterbacks lost due to poor playoff support – despite having the lowest passing EP by far, Manning also contributed the most to his team’s point differential, suggesting that overall, they would have done much worse without him.

Below, we see the numbers that tell the story of Manning’s playoff struggles – he’s generated the fewest games with positive EP and the most games with negative EP as a percentage and his poor games have been more catastrophic than the others, while his great games have been more dominant than the others. His passing offenses seem to be “feast or famine” in the playoffs. Beyond that, the story stays the same for the other QBs – Rodgers and Brees generate the best playoff passing EP but suffer the worst support EP of the four QBs, while Brady’s great EP performances seem to be hindered the least by his supporting squads.

So, what is the deal with Manning in the playoffs? We’ve established his support was poor in general, but poor support hasn’t hindered the other QBs as much as it has Peyton (though both Brees and Rodgers playoff sample size is much smaller than Manning’s). It’s a question many have asked and for my money, probably most satisfyingly answered in Scott Kacsmar’s two-part article on Football Outsiders, which you can read here and here.

His critics seem to feel that the pressure and anxiety caused by the high-stakes “lose and you’re out” playoffs format causes Manning to play worse. Perhaps this is true – but I find it hard to believe that he can, for example, run the same “levels” play over and over in the regular season but once the playoffs start, he suddenly can’t make the reads and throws he’s made literally thousands of times before. I’d need to see film study done to believe this theory – if someone can show me that Manning consistently made more bad reads and missed open receivers in the playoffs, while under the same amount of pressure as usual, I can believe it was psychological.

But there are other possible explanations. The first is that the small number of playoff games can skew numbers due to a high degree of variability found in small sample sizes. Perhaps Manning was just unfortunate that he had a higher percentage of his poor games in the playoffs than the other QBs. After all, his career efficiency averages, even when adjusted for opponent like DVOA, suggest he’s had the same percentage of bad games overall as the other three QBs. I find this plausible but perhaps a bit unsatisfying.

Ultimately, it’s something we won’t be able to figure out here, so let’s move on to looking at support measured by traditional metrics.  That will come in Part II.

{ 148 comments }

After the Jaguars drafted Leonard Fournette with the 4th pick in the 2017 Draft, NFLResearch tweeted the following:

That was, at least for me, a surprise. And it is true: there have been nine running backs drafted in the top 5 since 2000, and those teams have improved by 43 wins. There is some natural regression to the mean built in to any analysis like this, along with two big outliers: the 2016 Cowboys and 2006 Saints used a top five pick on a running back, but also added Dak Prescott and Drew Brees, producing two of the greatest improvements in passing efficiency in NFL history. Those two teams produced 16 of those 43 wins; without those two teams, the average increase drops to a still-impressive 3.9 wins. [continue reading…]

{ 14 comments }

Yesterday, I looked at the players with the worst career winning percentages. Using that same methodology, let’s look at the players with the best winning percentages. And the Otto Graham Browns and Tom Brady Patriots tend to dominate the list.

Below is the list of the top 100 players in adjusted career winning percentage, with a minimum of 100 career games played. [continue reading…]

{ 3 comments }

The only reliable thing in Cleveland

Since Joe Thomas entered the league, the Browns have a record of 48-112. That translates to a 0.300 winning percentage, the second-worst in the NFL over the last decade.

That’s bad, but not as historically bad as I would have thought. From 2000 to 2006, the Detroit Lions had a 0.295 winning percentage, the worst in the NFL. And from 2007 to 2011, the Rams had an anemic 0.188 winning percentage, the worst in the NFL. There was a common denominator for both of those teams: defensive end James Hall.

How did I find Hall? I looked at all players with 100 career games played. Then I calculated the winning percentage for his team in each season of his career, weighted by the number of games he played that season. So when calculating the adjusted career winning percentage for Hall, who played in 165 games and in 16 games for the 2008 Rams, 9.7% of his Adj Car Win% is based off of that team’s 2-14 record. The 2000 Lions went 9-7, but Hall only played in 5 games that year, so the 9-7 mark only counts for 3% of his career record. And the fact that the Lions went 3-2 in the 5 games Hall actually played is irrelevant: for calculating Adj Car Win%, I just used the team’s overall winning percentage multiplied by the number of games he played.

There are over 4,000 players who have played in 100 career games, and Hall has the lowest adjusted career winning percentage. The second-lowest? That honor belongs to John Greco, who was a teammate of Hall’s in St. Louis from 2008 to 2010, and has been a teammate of Thomas in Cleveland ever since.

Below are the 100 players with the worst adjusted career winning percentages: Thomas checks in at #35. [continue reading…]

{ 12 comments }

On Tuesday, I looked at the passing offenses, as measured by ANY/A, of each of the Super Bowl champions. Today, let’s do the same for passing defense. Just over half (26) have ranked in the top 4 in ANY/A, although as we saw with passing offenses, there isn’t a trend towards pass defense mattering more than it used to. If there’s a conclusion to be drawn, it may just be that worse teams are winning it all now than ever before. [continue reading…]

{ 3 comments }

In 1981, the Chargers and Bengals met in the AFC Championship Game. That game isn’t the most memorable game played that day, in part because of the cold weather: nicknamed the Freezer Bowl, San Diego struggled on the road in a game played with a windchill of -32 degrees.

But the bad weather obscured the fact that Dan Fouts and Ken Anderson — by far the top two passers in the NFL that season — were facing off for the right to play in the Super Bowl. Over in the NFC, the 5th and 6th leading passers in ANY/A — Danny White and Joe Montana — were meeting in what would turn out to be one of the most memorable games in NFL history. [continue reading…]

{ 63 comments }

Yesterday, I analyzed whether having a great quarterback is more important than ever when it comes to winning it all. The evidence provides a straightforward answer: no.

Today I want to examine the question from another perspective: what about how the eventual Super Bowl-winning quarterback looked prior to the season? From ’99 to ’02, we had four straight quarterbacks come out of nowhere to win the Super Bowl. In 1998, Kurt Warner threw 11 passes. In ’99, Warner won the Super Bowl, while Trent Dilfer ranked 29th among qualifying passers in ANY/A. But in 2000, Dilfer won the Super Bowl, while Tom Brady threw just three passes. In 2001, Brady won the Super Bowl, while a 33-year-old Brad Johnson looked past his prime, as he ranked 24th in ANY/A; the next year, of course, Johnson won the Super Bowl.

Nobody even thought about Warner or Brady in May of the year they won their first Super Bowls, and Dilfer and Johnson were veterans who did not fit within any definition of the words “great quarterback.” And yet, for four straight years, they shocked the football world.

So I wondered: how did each passer rank the year before they won the Super Bowl? A brief departure:

  • Jeff Hostetler and Doug Williams each started just two games in 1990 and 1987, respectively, but both won the Super Bowl. Neither played much in the year before they won the Super Bowl, either. For purposes of this study, I am going to use Phil Simms and Jay Schroeder as the starting quarterbacks of the ’90 Giants and ’87 Redskins, although using Hostetler and Williams obviously makes the case even stronger for the “come out of nowhere” theory.
  • Earl Morrall led the first 4th quarter comeback in Super Bowl history, but because Johnny Unitas was both the Colts starter for nearly all of 1970, and the starter in Super Bowl V, I am listing Unitas as the quarterback for that Colts team. Morrall does, however, get credit as the 1972 Dolphins quarterback, which is consistent with giving Simms and Schroeder credit.

Failed to Qualify

In addition to Warner and Brady (and ignoring Hostetler and Williams), there were 7 other quarterbacks who failed to register enough attempts to qualify for the passing crown the year before they won the Super Bowl. That includes 5 straight quarterbacks in the early ’70s.

In 1970, Roger Staubach was the backup to Craig Morton, but Staubach won the championship with an all-time great season the next year. In ’71, Morrall was the backup to Bob Griese, but Morrall was the main starter for the ’72 Dolphins due to Griese’s injury. And that means Griese ’72 makes our list, too, since Griese won it all in ’73. Terry Bradshaw in 1973 had just 180 pass attempts, so he didn’t have the 196 passes necessary to qualify for the passing crown (but he was so bad that if he did qualify, he would have ranked just 21st out of 24 passers in ANY/A). The next year he started 7 of 14 games for the ’74 Steelers but ranked 2nd on the team in pass attempts with just 148; as a result, he doesn’t have enough attempts to qualify when looking at Year N-1 performances, which is relevant since the ’75 Steelers won it all. So the ’71 Cowboys, ’72 Dolphins, ’73 Dolphins, ’74 Steelers, and ’75 Steelers all get labeled as having starting quarterbacks who the year before, did not have enough pass attempts to qualify for the passing crown.

The other two quarterbacks are Jim Plunkett and Jim McMahon. In 1979, Plunkett threw 15 passes for the Raiders and was viewed as a draft bust; a year later, he won the Super Bowl. In 1984, McMahon suffered a season-ending injury after just 143 attempts. [continue reading…]

{ 31 comments }

If you’re short on time, let me save you a read: no.

And now for the long answer.

The graph below shows where each Super Bowl champion since the AFL/NFL merger ranked in Adjusted Net Yards per Attempt:

[continue reading…]

{ 34 comments }

The most efficient runner in NFL history? That depends.

Jamaal Charles is now a Denver Bronco, making him the second superstar running back in two weeks to join a new team at the tail end of his career. In his prime, Charles was a very good receiver and a player that could be the centerpiece of an offense. However, he will likely be remembered for a singular skill: rushing efficiency.

Charles has a career YPC average of 5.45, easily the best in history among running backs in the NFL. That number is at least a little misleading. While rushing efficiency has not soared the way passing efficiency has, we are currently in a high-YPC environment. Two years ago, I calculated era-adjusted yards per carry: at the time, Charles was at 5.49, while the league average was 4.21. For reference, the league average during the careers of Jim Brown, Gale Sayers, and Barry Sanders was 4.08, 3.95, and 3.93, respectively.

I am not a big fan of yards per carry as a statistic, but hey, it’s still interesting trivia. It’s a little silly and mostly an academic exercise, but let’s pretend that we replaced every Charles rush attempt with a league average rush attempt. How much worse off would Kansas City have been? Well, a whole lot. Let’s use his 2010 season as an example. He had 230 carries for 1,467 yards, producing an incredible 6.38 YPC average. The league average that season was 4.21, meaning he was 2.17 YPC above-average. Given his 230 carries, we would have expected him to rush for just 968 yards, meaning he produced 499 rushing yards above average. And for his career? Charles is at +1657. [continue reading…]

{ 8 comments }

How Often Do Teams Turn Over Quarterbacks?

Just 9 of 32 teams had a different player lead the team in pass attempts in 2015 and 2016. Take a look:

As you would suspect, some of the changes were intentional, and some were not. Denver saw their 2015 QB retire, while Minnesota lost their starting quarterback in the preseason…. which led Philadelphia to trade their 2015 starter and anticipated 2016 starter to the Vikings.

Three others were injury related. The Cowboys switched quarterbacks intentionally, of course, but still had their expected 2016 quarterback change due to injury. And Chicago lost Cutler early in the year, and he was limited to five starts.

The other four? The 49ers started 2016 with Gabbert, but benched him for Kaepernick. And the Texans, Rams, and Browns intentionally moved on from their quarterbacks, although McCown stayed with Cleveland and did wind up starting three games. [continue reading…]

{ 1 comment }

Checkdowns: NFL Draft Podcast with Ed Feng

Before the 2017 NFL Draft, I recorded a podcast with Ed Feng of The Power Rank. We talked about the background behind the creation of my draft value chart, some explanations for why the traditional chart still is used, and some general Football Perspective writing.

You can listen to it here.

{ 0 comments }

2016 Snap Counts

Using data from Pro-Football-Reference for the 2016 NFL season, I calculated the average number of snaps per play taken by players at each position across the league. Here are the numbers for offense:

QB: 1.00
RB: 1.10
WR: 2.60
TE: 1.25
OT: 2.05
OG: 2.00
OC: 1.00

Some of these are pretty obvious: you have exactly one quarterback, one center, one left guard, and one right guard on each play. For the most part, you have two tackles, although occasionally teams will have three tackles on the field (apparently, about once every twenty plays).

The more interesting numbers come in the split among the skill position players: running backs (including fullbacks) only get about 1.10 snaps per play; in the ’70s, that number would be much closer to 2.0, although there’s no way of getting more precise than that. Tight ends are at 1.25, while the average play in 2016 featured more than 2.5 wide receivers on the field. Three wide receivers has become the base formation in the NFL. [continue reading…]

{ 6 comments }

Teams needed stability at the QB position so they traded up for these guys

The 2004 Draft was a remarkable one for first round quarterbacks. Eli Manning was the first overall pick — to the Chargers — while Philip Rivers went fourth overall to the Giants. Shortly thereafter, the teams completed an epic trade that landed Manning and Rivers on opposite coasts, where they still are 13 years later. With the 11th pick in the first round, Ben Roethlisberger went to the Pittsburgh Steelers, and he’s still there, too. One other quarterback went in the first round, and he was the subject of a trade, too: the Bills sent a future first round pick to the Cowboys for the right to draft J.P. Losman.

That 2004 first round may have marked a turning point in the league’s perception when it comes to “getting your guy.” The fact that Manning, Rivers, and Roethlisberger have become long-time starters with national recognition has likely had an impact when decisionmakers think about trading for a first round quarterback.

Since then, there have been 16 times over the last 13 drafts that a team “traded up” in the 1st round to get a quarterback. [1]Note that this does not include Jason Campbell, whom the Redskins selected in 2005. Washington did trade up for the pick, but they did so before the draft, not knowing that Campbell would be … Continue reading On average, those teams have paid about 149 cents on the dollar (according to the Football Perspective Pick Value Calculator) to move up in the draft to get their quarterback. But let’s put aside the cost for now, because there’s a theory that “if you think you have found your franchise quarterback, it doesn’t matter what it cost to get him.” So we have 16 cases where teams were really sure they found a quarterback that they had to get, and traded up to grab him. How did those quarterbacks fare?

While it’s too early to trade the last six quarterbacks selected in the previous two drafts, it’s not too early to grade the first 10. Seven of the 10 were busts, even if I am unfortunately labeling Teddy Bridgewater as such. An 8th was Mark Sanchez, and while he’s a pretty clear bust (he has the 9th worst era-adjusted passer rating in history among players with 1500 pass attempts), he won 33 regular season games and 4 playoff games with the Jets. It was a trade the Jets would have been better off not making, but he at least reached some level of success. The two “successes” were Jay Cutler and Joe Flacco, and neither could be called an unmitigated success. [2]Flacco, for his career, has a below-average passer rating. Cutler lasted only three years with the Broncos, before the team traded him … albeit for two first round picks.

Now, let’s get back to the cost.  As I did yesterday, I am valuing all drafts picks in the current draft using the Draft Pick Value Calculator I created.  For future picks, I used the middle of each round and applied a 10% discount rate; so a Year N+1 2nd round pick was worth 90% of whatever the draft value calculator says the 48th pick is worth.

Look at the first trade on the list.  This shows the Texans, who in 2017, traded up for Deshaun Watson by dealing with the Browns.  Houston sent the 25th pick and a 2018 1st, while the Browns sent back the 12th pick.  The pick equivalent on the Houston side is therefore 25 and 16 (projected 2018 1st round pick), and the pick equivalent on the Cleveland side is just 12.  The value given up shows the value my pick value calculator assigns: 14.1 for the 25th pick, and 15.2 for the 16th pick in next year’s draft (i.e., this represents 90% of the value of the 16th pick in this year’s draft).  The value received is just the value of the 12th pick, or 18.8.  The return is 156% — the Browns gained 156 cents on the dollar, with a raw difference of 10.5 points of draft value, by consummating this trade. [continue reading…]

References

References
1 Note that this does not include Jason Campbell, whom the Redskins selected in 2005. Washington did trade up for the pick, but they did so before the draft, not knowing that Campbell would be available at their new pick.
2 Flacco, for his career, has a below-average passer rating. Cutler lasted only three years with the Broncos, before the team traded him … albeit for two first round picks.
{ 15 comments }

As a junior in college, Mitchell Trubisky produced impressive, if not dominant, passing stats. Here were the 2016 leading passers in the ACC:

Passing Rushing
Rk Player School G Cmp Att Pct Yds Y/A AY/A TD Int Rate Att Yds Avg TD
1 Nathan Peterman Pitt 13 185 306 60.5 2855 9.3 10.1 27 7 163.4 72 286 4.0 3
2 Lamar Jackson Louisville 13 230 409 56.2 3543 8.7 9.1 30 9 148.8 260 1571 6.0 21
3 Mitch Trubisky North Carolina 13 304 447 68.0 3748 8.4 9.1 30 6 157.9 93 308 3.3 5
4 Jerod Evans Virginia Tech 14 268 422 63.5 3552 8.4 8.9 29 8 153.1 204 846 4.1 12
5 Brad Kaaya Miami (FL) 13 261 421 62.0 3532 8.4 8.9 27 7 150.3 37 -136 -3.7 1
6 Deondre Francois Florida State 13 235 400 58.8 3350 8.4 8.6 20 7 142.1 108 198 1.8 5
7 Deshaun Watson Clemson 15 388 579 67.0 4593 7.9 8.0 41 17 151.1 165 629 3.8 9
8 Ryan Finley North Carolina State 13 243 402 60.4 3050 7.6 7.6 18 8 135.0 74 94 1.3 1
9 Eric Dungey Syracuse 9 230 355 64.8 2679 7.5 7.5 15 7 138.2 125 293 2.3 6
10 Daniel Jones Duke 12 270 430 62.8 2836 6.6 6.4 16 9 126.3 141 486 3.4 7
11 Kurt Benkert Virginia 11 228 406 56.2 2552 6.3 6.1 21 11 120.6 60 -94 -1.6 0
12 Patrick Towles Boston College 13 138 273 50.5 1730 6.3 6.1 12 7 113.2 115 294 2.6 4
13 John Wolford Wake Forest 12 166 299 55.5 1774 5.9 5.0 9 10 108.6 130 521 4.0 6

While Trubisky had a very good year, both the Atlantic Coast Sports Media Association and the ACC coaches only named him to the third team in the conference, behind Lamar Jackson and Deshaun Watson. [continue reading…]

{ 18 comments }

The 2017 NFL Draft Brought Back The Running Back

Over the last 15 years, NFL teams have put less emphasis on drafting running backs. The amount of draft capital used on the position had been on a steady decline, although there was a notable reversal this year. In fact, 2017 falls behind only 2005 (where Ronnie Brown, Cedric Benson, and Cadillac Williams went in the top 5, and Frank Gore, Brandon Jacobs, Marion Barber and Darren Sproles went in the later rounds) and 2008 (Darren McFadden, Jonathan Stewart, Felix Jones, Rashard Mendenhall, and Chris Johnson all went in the first round, and Matt Forte, Jamaal Charles, Ray Rice, and Justin Forsett went in the later rounds) in terms of draft capital used on running backs and fullbacks.

Take a look: while there is obviously a general decline over the last four decades, the 2017 Draft was a great one for running backs: [continue reading…]

{ 4 comments }
Previous Posts