
On Tuesday, James “Four Touchdowns” Hanson posted a great article on the support that Peyton Manning, Tom Brady, Drew Brees and Aaron Rodgers have enjoyed throughout their careers. That was Part 1, and it received over 100 comments, so give it (and the comments section) a read. Today comes Part 2. As always, we thank our guest posters for contributing. What follows are James’ words.
Team Support by Traditional Stats and Expected Points
About 35% to 55% of all offensive plays (depending on game script, offensive philosophy, personnel, etc.) are running plays, so there is value in looking at what each quarterback’s running game produced. Even if teams tend to run more after building a lead, it’s still a key part of closing out games. I’ve included their average league-wide ranks so we can get a better idea of how many seasons they enjoyed with great rushing support.
I’ve also included turnovers minus interceptions, which I assume are fumbles from the WRs, RBs, QBs, and Special Teams – but since I can’t determine who is responsible for what, I’ve included that information here under the assumption that most fumbles aren’t from the quarterback.
I should also note that while the rushing yards and touchdowns have had the quarterback’s contributions subtracted, the rushing first downs and expected points include any first downs gained by quarterback sneaks and scrambles.
The light green indicates the leader in that category, while the pink indicates the least amount of support in that metric.
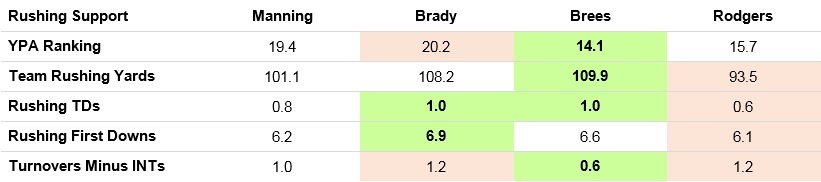
In general, it looks like Brady and Brees have enjoyed the most rushing support while Rodgers has suffered the least amount of support by conventional metrics – and remember, those TD and first down totals include ones he picked up himself, meaning his support in those areas is likely even worse than the numbers indicate. Manning and Brady have had a top ten run game in 7 seasons, while Brees has had one 3 times and Rodgers has had a top ten running game in 2 seasons.
And again, here are those numbers for the playoffs, with the YPA average from their Super Bowl winning teams (though since Brees and Rodgers have only won one each, the average represents just one playoff run) –
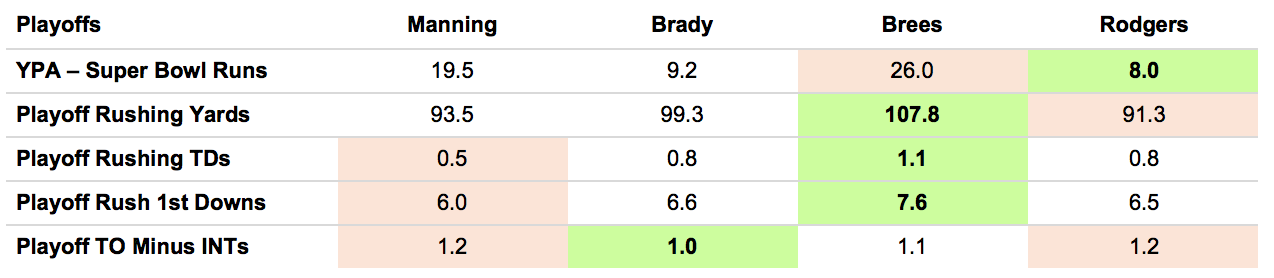 Other than the Super Bowl YPA ranking, Brees seems to enjoy the most running support from his teams overall while Brady enjoys the fewest turnovers. Manning and Rodgers generally seem to get the weakest running games during the playoffs.
So what about defense? Other than the traditional metrics – average rankings, points allowed, yards allowed, etc. – I decided to look at the ANY/A and passer ratings allowed by each defense as an indicator of defensive support, as well as the relative rates for each metric.
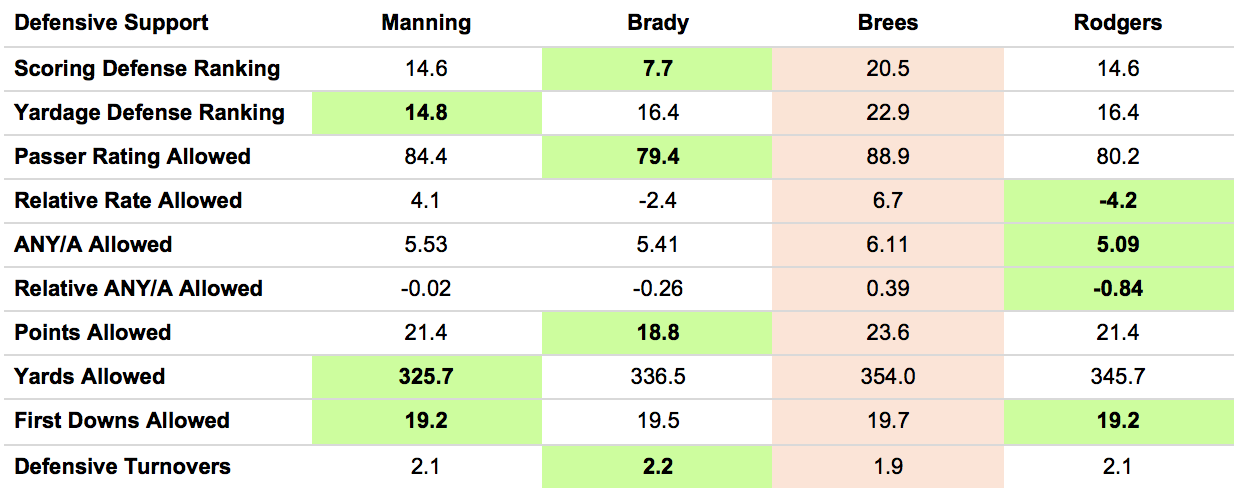 Drew Brees is passer receiving the least defensive support as his teams are ranked last among the four in every single defensive category. The leaders are spread out among the other three players – Brady’s teams are stingy with points, Manning’s are stingy with yards, and Rodgers do best by opposing QB efficiency metrics. The weird thing is how much better Brady’s defenses are at preventing points than they are at allowing yards. He’s had a top ten scoring defense in 11 out of 14 seasons, which is incredible – by contrast, the other three QBs combined have a total of 10 seasons with a top ten scoring defense! It’s odd that his defenses’ yardage numbers end up being so much worse – if you look at the other QBs, the scoring defense tends to be pretty similar to the yardages defense. I guess Belichick really does have that “bend but don’t break” mentality… are we seeing some insight into his defensive genius? Since it’s impossible to build an elite overall defense every year, he focuses on players that can best succeed in the compressed space of the red zone? Who knows, but interesting to think about. [1]Editor’s note: From 2001 to 2016, the Patriots ranked in the top 8 in special teams according to Football Outsiders in 12 of those 16 years, and never below 16th. New England’s average … Continue reading
Going by career passer ratings, Brady’s and Rodgers’ opposing QBs average out to a Ryan Fitzpatrick or Matt Cassel. On the other side, Manning’s defenses average quarterbacks out to Joe Flacco and Eli Manning levels, while Brees’ average out to a Carson Palmer or Derek Carr.
And those numbers in the playoffs –
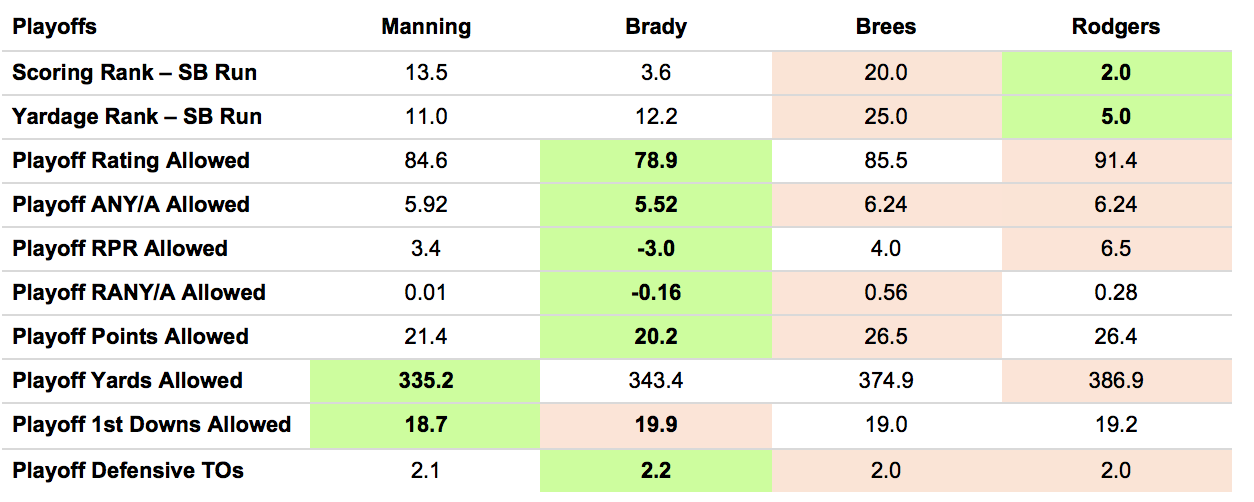 While Rodgers seems to have enjoyed positive support overall, his defenses don’t do as well during the playoffs – in fact, most of his numbers are comparable with Brees’ atrocious defenses. Brady enjoys the best playoff defenses by passer rating by a substantial margin, with his squads taking the lead in nearly all categories except rankings, total yards and first downs. While some are close enough that we can’t really say anyone has a true advantage since the sample size here is so small – all teams essentially average 2 takeaways a game while 20 first downs doesn’t seem worse than 19 first downs per game. But looking at what his teams do to opposing defenses is impressive –they force opposing QBs into passer ratings and ANY/A that are average in general, as you can see by their relative rates allowed. Consistent with their overall numbers, they allow the fewest points.
Okay! That was a lot of numbers over the first two posts, but I think we have gotten an overall sense of the level of support these quarterbacks have received – while Brady’s own metrics weren’t consistently higher than any other QBs overall, he’s received far more support on average across his legendary career. When you look at his winning percentage and number of titles, we can’t really see a reason for him to be so far ahead of the others when you review his passing metrics – however, when you factor in the support he receives, I think a more consistent picture begins to form.
It takes nothing away from him, of course, unless you feel the need to believe that he’s won all his Super Bowls on the merits of his own talent and performances. Having great support doesn’t mean you’re not a great player.
So all that said, what’s the deeper correlation between team support and winning and losing? Is it possible that Brady’s plays were more timely and because he put his defenses in better positions at critical times, he set them up for success? It is possible – so I wanted to look at each player’s numbers in both wins and losses. I also want to see how often team support resulted in a win and when team support failure resulted in a loss.
In other words – how often do each quarterback’s teams win when they poorly? How often do they lose when he plays well? If you can weather bad QB play to win games and not collapse when your QB is playing well, isn’t that a key part of understanding team support?
I think so and we’ll see those results in my next column.
References
| ↑1 | Editor’s note: From 2001 to 2016, the Patriots ranked in the top 8 in special teams according to Football Outsiders in 12 of those 16 years, and never below 16th. New England’s average ST rank over that period is 7.6, and always having good-to-great special teams likely helps in this department, too. |
|---|