Today’s guest post comes from James “Four Touchdowns” Hanson, a relative new reader to the site. As always, we thank our guest posters for contributing.
Elite Quarterbacks: Measuring Overall Team Support
It’s easy for football fans to buy into the mainstream logic that if you have an elite quarterback, your team will have a winning record, enjoy trips to the post-season and even win a few championships. The better the quarterback, the more wins and titles you can expect… right?
But that logic doesn’t always hold up. Dan Marino, Fran Tarkenton, Warren Moon, Dan Fouts, Jim Kelly, Sonny Jurgensen, Philip Rivers, and so on, provide examples to the contrary. And while his talents have been unfairly portrayed at times, the fact that Terry Bradshaw has four Super Bowl rings while superior passers have none presents a disconnect if you think great quarterback talent is measured by titles.
If we go by an average time of possession of 30 minutes per team, that means that half the time, a team’s quarterback isn’t even on the field. And if 35% to 55% of your team’s offensive plays are running plays… doesn’t that mean the quarterback really only affects 22% to 33% of the total game time? And once you get into other factors that affect a passer’s game, like play design and coaching, offensive line talent, receiving talent, quality of opposition, etc., attributing credit and blame gets pretty murky.
So while we have a general feeling that some quarterbacks receive more support than others, so how do we go about measuring it through metrics? Unfortunately, due to the nature of passing stats, I don’t know of a way to separate a quarterback from his receivers, pass blocking, scheme and play-calling. Whether it’s passer rating, ANY/A, or passing EPA, none of them can tell you which percentage of the credit (or blame) should be shared with those external factors.
That said, we can measure a quarterback’s support by looking at the numbers produced by his running game, defense and special teams. While I’d love to run these numbers for all quarterbacks, my ability to collect them is fairly limited (basically, cutting and pasting from Pro Football Reference – I don’t know enough about Python or R to run a spider to scrape them all in one go), so I will be focusing on four quarterbacks that are perceived to be “elite” by general mainstream consensus – Peyton Manning, Tom Brady, Drew Brees and Aaron Rodgers.
Due to length, I will be looking at these numbers in three separate articles. This one will focus on what support they received in these areas overall and the second will take a look at team support relative to the quarterback’s performance – how often their teams win when they have below-average performances and how often they lose when they perform at a high level (as measured by stats, natch).
Overall ANY/A, Passer Rating, & Expected Points Metrics
So let’s dig into the numbers. Here are the quarterbacks’ average stats per game for their overall careers including playoff games (which is why you may notice a difference between these and career averages that only include the regular season). The cells shaded blue indicate that quarterback is the leader among the four in that metric. While all of these metrics should be familiar to readers of the site, I have also included a metric I’m calling Relative Passer Rating (rPR) and it’s essentially the same concept as Relative ANY/A – it measures passer rating compared to the average for that season. For example, if the average is 80.0 and the passer earns a 90.0, his rPR would be +10.0.
As Peyton Manning is the only one of the four to suffer a physical decline in a career ending season, I have included his pre-2015 averages for the efficiency metrics in parenthesis next to his actual averages, though this will not affect any of the analysis from this point on – it’s more of a “nice to know”.
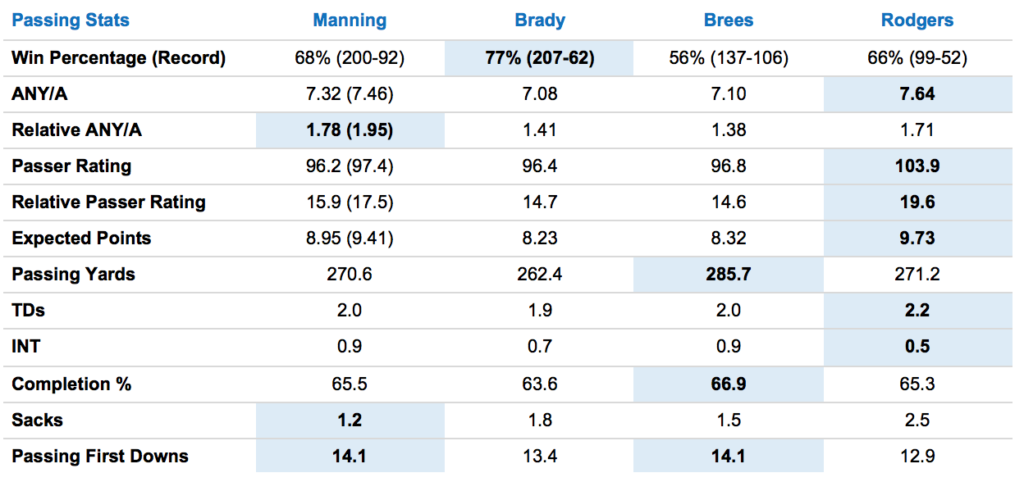 Great numbers across the board, as to be expected by elite players but it’s amazing how much higher Brady’s win percentage is than the other players despite not producing any clear statistical advantage in the efficiency or traditional metrics – and how much lower Brees’ win percentage is than the others despite his numbers being on par with the other three QBs.
Additionally, as their success in the playoffs makes us the biggest difference in the way people perceive these players, I will break out their playoff numbers in a separate table –
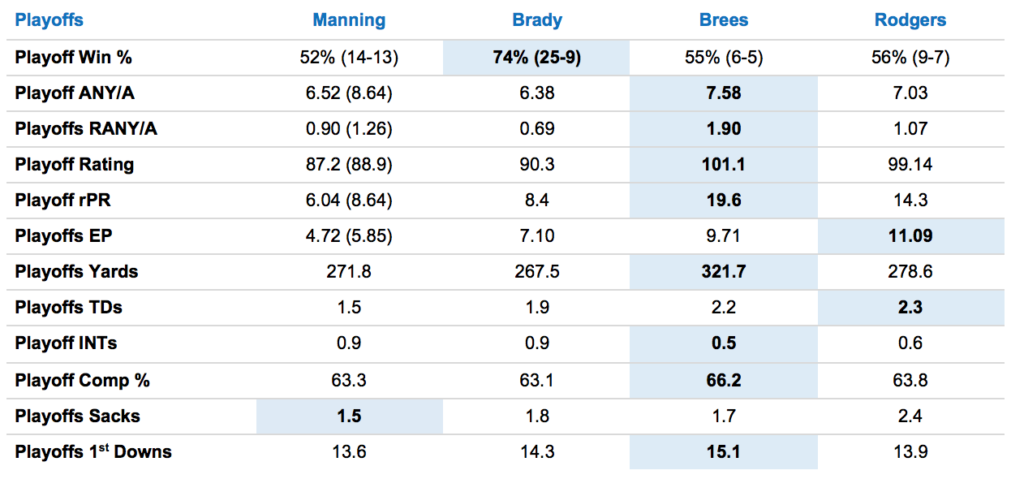 The numbers here probably come as a surprise – I know I didn’t expect Brees to sweep nearly every passing metric for the playoffs. While his smaller sample size comes into play, it doesn’t seem to have affected his win percentage, which is about on par with everyone except Tom Brady.
So there’s our starting point – we can see how each player has performed relative to the others, and while there are some clear leaders in the playoffs, they’ve produced at a similar level overall throughout their careers. Now let’s see how their teams have supported them.
Team Support Measured by Expected Points
As they’re the metrics that seem mostly closely tied to the margin of victory and defeat, I figured we’d start with Expected Points. Mike from Sports Reference defines Expected Points as a way to “break down the contributions each team’s various squads made to the margin of victory.” Those last few words are key; EP are applicable to the margin of victory – or defeat.
With that in mind, I went about measuring the EP of each quarterback’s passing offense against the rest of the team – running game, defense, and special teams. The sum of those three squads make up the Total Support EP number while the point differential is the average margin of wins and losses across their careers.
The EP Gained / Lost metric represents the average EP each quarterback’s running game, defense, and special teams have added or subtracted per game from the passing EP they generated. I also felt that per game average didn’t fully illustrate what effect those added or subtracted points had over the course of each player’s career, so I included the sum or difference in Total EP Gained / Lost.
Finally, since EP is tied to the margin of victory or defeat, I included the Point Differential to give the numbers some context. I also showed what each QB’s passing EP as a percentage of the average point differential in Pass EP % of Outcome so we could see how much credit or blame each quarterback should take for his team’s outcomes on average.
Red indicates negative EP while green indicates positive EP; dark green and dark red indicate who finished first and last in each category respectively.

First off, it’s clear that these players’ passing offenses have been the driving force behind their teams’ success. Compare their passing EP to the average margin of victory and you see that it’s each quarterback’s passing game that has created most or all of that point differential – it looks like most of the time, these guys carry their teams.
That said, we can see the EP support (AKA negative plays) has been very different for one player compared to the other three – Brady is the only one to have positive EP support in any category and amazingly has positive EP in ALL support categories. It’s said that the quarterback affects all other players on the field and while that may be true, we’re not seeing it in these results – every other QB has a higher EP average per game than Brady but gets worse support than him.
If we were to round the numbers, it looks like Manning’s and Rodgers’ team support have cost their teams around a field goal in points, on average, while Brees loses roughly 5 points. Meanwhile, Brady’s support has been worth an extra point to his Patriots. We shouldn’t misinterpret these numbers to suggest that somehow Brady is being carried by great support – it’s clear that Brady’s passing game is the engine that drives the Patriots’ success as a team but he’s the only quarterback of the four whose supporting elements haven’t cost him points.
This has led to his teams actually adding positive EP to his games overall, giving Brady nearly 264 expected points to his overall point differential over the course of his career. Manning and Brees, on the other hand, has had their teams cost them over 1,000 expected points and at the rate Rodgers’ offenses have been producing, Rodgers will likely join them by the end of his career.
Of course, there’s only so much we can see from these per game averages – let’s see what that EP looks like spread out over the course of their careers. After all, a team that provides -5 EP in five games and a team that provides +5 EP in two games and -20 EP in three games will both average out to -5 EP per game. But the first team had five straight bad games while the second team had three good games and two catastrophically bad games. Clearly, not the same thing.
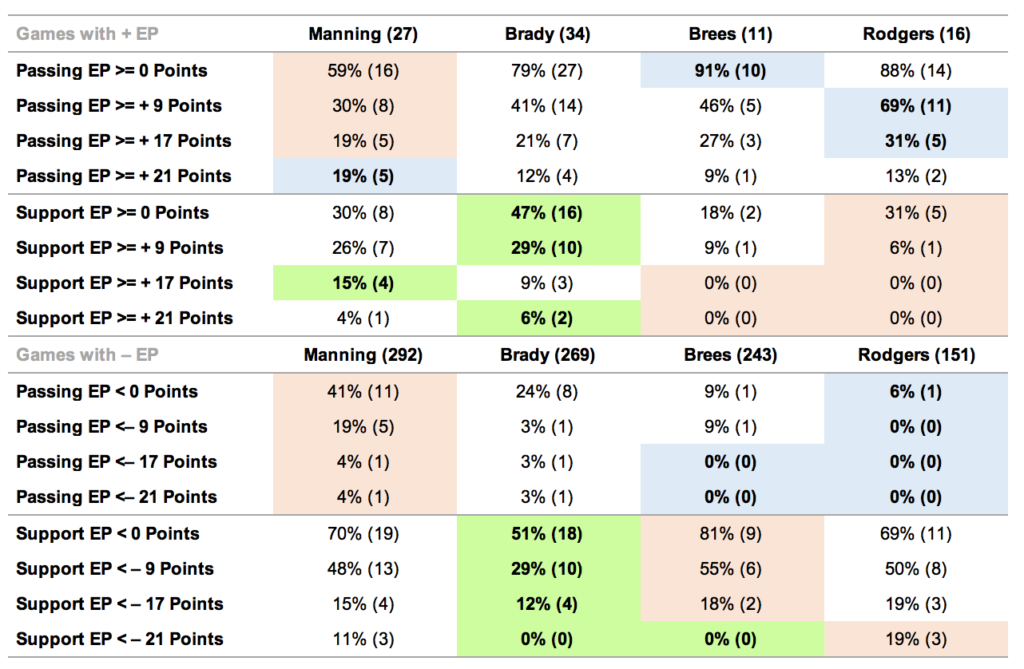
So let’s look at how many games each passer and team have provided positive and negative support – and then let’s see how often that support has created a two-possession lead or deficit (9 points), three-possession lead or deficit (17 points), and while I know 24 points is technically three possessions, I think the odds of any team getting three TDs with three two-point conversions is very low – so I set 3 TDs (21 points) as my threshold for three-possessions. Additionally, we should see how often our QBs do the same, so those passing EP numbers are also included.
The leaders in passing EP are marked blue, the leaders in support EP are marked green, and ones with the least EP in each category are highlighted in red –
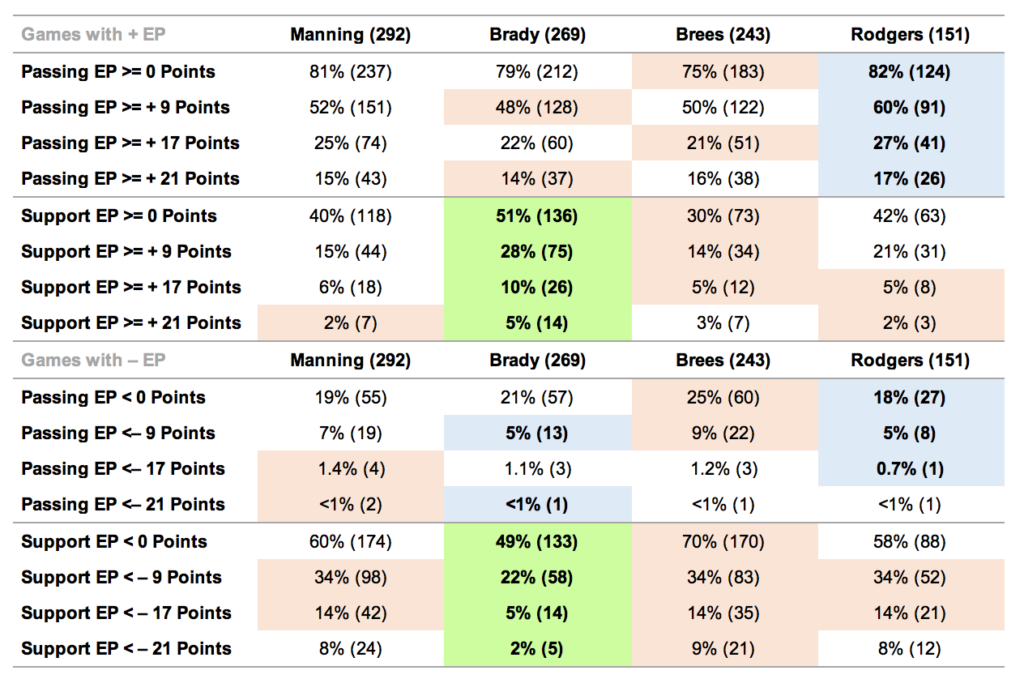
The numbers reflect what we’ve seen before – Aaron Rodgers leads in almost all categories with passing EP, having the largest number of games with positive EP and the fewest with negative EP. Meanwhile, Brady has the most games with positive support and the fewest games with negative support across all categories by a substantial margin, though he’s tied for the lead with Rodgers for the fewest games with negative EP over 9 points.
That all said, when you look at the actual number of games with negative passing EP, it’s really only a handful of difference between these players – they’re all incredible, posting positive EP in the vast majority of their games and two possessions worth of positive EP in about half of their games. These guys are considered the elites of the sport for a reason and these numbers bear that out.
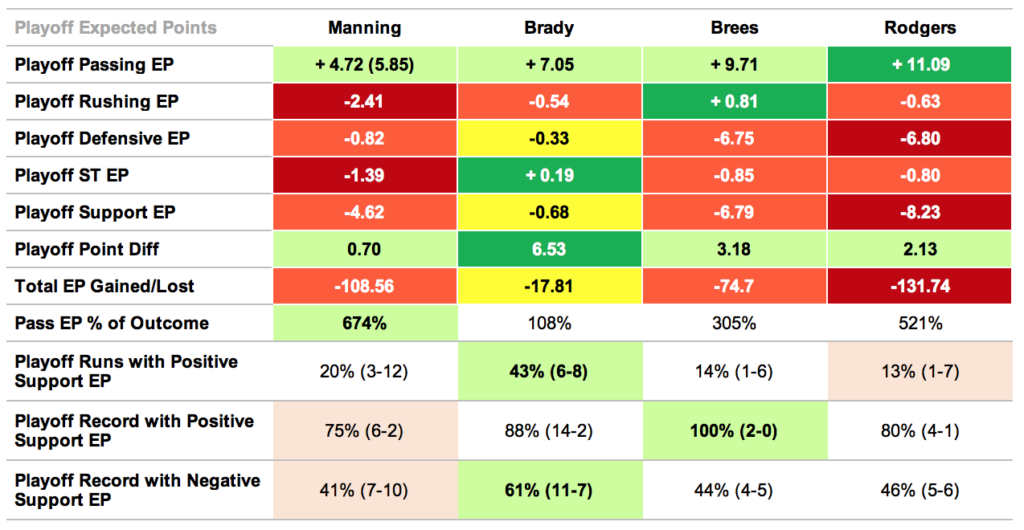
As before, I included their playoff numbers since that’s the core difference in how fans perceive them. One difference here from the previous chart, though – since none of them enjoyed totally positive playoff support, the QB with the smallest deficit of supporting cast EP is highlighted in yellow–
 If you think about it, it’s kind of amazing that despite Manning, Brady and Brees playing over 240 games (Rodgers at 151), a small fraction of them determine how the general public sees these players — the playoff games. Manning has played 292 games and the outcome of 27 will determine how he’s remembered. Brady has played 269 and 34 are what makes him the GOAT to most of the public. Brees has played 243 and the outcome of 11 is what keeps him out of most people’s conversation for GOAT. Kinda nuts – but at least Rodgers still has a lot of his career ahead of him. Hopefully, Green Bay will get the man some help!
With that in mind, I decided to add three rows to this column since we’re dealing with such a small sample size for the playoffs so we can understand the narrative behind the averages a little better – how many playoff appearances they had with positive support EP, their record with that support, and then their record with negative support. While they all had negative support in the playoffs, Brady’s did the least amount of damage – despite both Brees and Rodgers having higher passing EP, their playoff point differential is less than half of Brady’s. Meanwhile, it seems Manning has to assume some responsibility for his lack of playoff success as his passing EP drops dramatically in the playoffs.
That said, in terms of win percentage, they all do better with positive support – Manning seems to do worst but still has an incredible 75% win percentage, way up from his 52% overall.
And while the results so far of this study have shown that Brady has received the most support while not always posting the best efficiency metrics or raw stat totals, we have to give him his due – he is the only QB of the four with a winning playoff record in games with negative EP support.
So how does this all translate to Super Bowls? Two of Manning’s three playoff runs with positive support netted him a Super Bowl title (his other was in 2014 when he was hindered by injuries that would ultimately end his career), while Brees’ and Rodgers’ only playoff run with positive support led to them winning a Super Bowl (Brees’ Special Teams EP in his Super Bowl was nearly 10 points alone!). On the other side, Tom Brady has won three Super Bowls with positive support and two Super Bowls with negative support (though all Super Bowl runs featured at least one game with positive support that contributed more to the margin of victory than passing EP), which certainly adds some credibility to the idea that he’s got a bit more “clutch” to him than the other three quarterbacks.
All that said, we can see how much more the other three quarterbacks lost due to poor playoff support – despite having the lowest passing EP by far, Manning also contributed the most to his team’s point differential, suggesting that overall, they would have done much worse without him.
Below, we see the numbers that tell the story of Manning’s playoff struggles – he’s generated the fewest games with positive EP and the most games with negative EP as a percentage and his poor games have been more catastrophic than the others, while his great games have been more dominant than the others. His passing offenses seem to be “feast or famine” in the playoffs. Beyond that, the story stays the same for the other QBs – Rodgers and Brees generate the best playoff passing EP but suffer the worst support EP of the four QBs, while Brady’s great EP performances seem to be hindered the least by his supporting squads.
 So, what is the deal with Manning in the playoffs? We’ve established his support was poor in general, but poor support hasn’t hindered the other QBs as much as it has Peyton (though both Brees and Rodgers playoff sample size is much smaller than Manning’s). It’s a question many have asked and for my money, probably most satisfyingly answered in Scott Kacsmar’s two-part article on Football Outsiders, which you can read here and here.
His critics seem to feel that the pressure and anxiety caused by the high-stakes “lose and you’re out” playoffs format causes Manning to play worse. Perhaps this is true – but I find it hard to believe that he can, for example, run the same “levels” play over and over in the regular season but once the playoffs start, he suddenly can’t make the reads and throws he’s made literally thousands of times before. I’d need to see film study done to believe this theory – if someone can show me that Manning consistently made more bad reads and missed open receivers in the playoffs, while under the same amount of pressure as usual, I can believe it was psychological.
But there are other possible explanations. The first is that the small number of playoff games can skew numbers due to a high degree of variability found in small sample sizes. Perhaps Manning was just unfortunate that he had a higher percentage of his poor games in the playoffs than the other QBs. After all, his career efficiency averages, even when adjusted for opponent like DVOA, suggest he’s had the same percentage of bad games overall as the other three QBs. I find this plausible but perhaps a bit unsatisfying.
Ultimately, it’s something we won’t be able to figure out here, so let’s move on to looking at support measured by traditional metrics. That will come in Part II.
