≡ Menu

One of the very first posts at Football Perspective measured how various passing stats were correlated with wins.  One of the main conclusions from that post was that passer rating, because of its heavy emphasis on completion percentage and interception rate, was not the ideal way to measure quarterback play. But what about ESPN’s Total QBR, a statistic invented specifically to improve on — and supersede — traditional passer rating?

As a reminder, we can’t simply correlate a statistic with wins to determine the utility of that metric. The simplest way to remember this is that 4th quarter kneeldowns are highly correlated with wins. Just because you notice it’s raining when the ground is wet doesn’t mean a wet ground causes rain; i.e., just because two variables are correlated doesn’t mean variable A leads to variable B (alternatively, variable B could lead to variable A, variable C could lead to both variable A and B, or the sample size could be too small to determine any legitimate causal relationship). That said, it at least makes sense to begin with a look at how various statistics have correlate with wins.

The Sample Set

Throughout this post, I will be looking at a set of quarterback data consisting of the 152 quarterback seasons from 2006 to 2013 where the player had at least 14 games with 20+ action plays. Games where the quarterback had fewer than 20 plays were excluded, but the quarterback was still included if he otherwise had 14 such games.

The next step was to sum the weekly quarterback data on various metrics, including wins, and create season data. [1]For ESPN’s QBR, I took a weighted average of the weekly QBR data. I should note that this is not the way ESPN calculates QBR. As explained to me via email, the scaling function that gives the … Continue reading This allowed me to measure the correlation between a quarterback’s statistics over those 14+ games with that player’s winning percentage in those games.

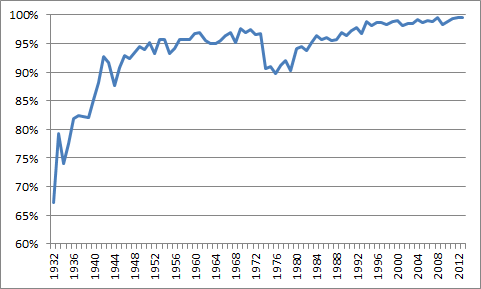
As it turns out, ESPN’s Total QBR is very highly correlated with wins, with a 0.68 correlation coefficient. [2]As a reminder, the correlation coefficient is a measure of the linear relationship between two variables on a scale from -1 to 1. If two variables move in the same direction, their correlation … Continue reading This is to be expected; after all, Total QBR is based off Expected Points Added on the team level, which generally tracks wins and losses. The second most correlated statistic with wins was Adjusted Net Yards per Attempt, my favorite non-proprietary quarterback metric. After ANY/A, both traditional passer rating and touchdowns per attempt were the next most correlated statistics with wins (after all, this is only a step or two away from saying scoring points is correlated with wins). In another unsurprising result, passing yards had almost no correlation with wins, while pass attempts had a slight negative correlation (as any Game Scripts observer would know).  Take a look:

StatCC
ESPN QBR0.68
ANY/A0.57
Passer Rating0.56
TD/Att0.54
NY/A0.46
Yd/Att0.45
INT/Att-0.43
Cmp%0.33
Sack Rate-0.21
Pass Yds0.16
Attempts-0.10

When ESPN first introduced QBR, I wrote that I was intrigued by the possibility of this metric, but frustrated that the specific details of the formula remained confidential. At the time, a clutch weight feature was included in the calculations, which made the metric more of a retrodictive statistic than a predictive one. Since then, ESPN has tweaked the formula several times, and the clutch weight has been capped. [3]When Dean Oliver was on the Advanced NFL Stats podcast, he noted that the formula was tweaked in 2013 so that the “clutch index” part of the formula was essentially capped. He added … Continue reading ESPN is not engaged in academia, so I understand why they have not published all the fine print; as a researcher, I’m still frustrated by that decision. Still, with 8 years of QBR data now publicly available, we can answer two questions: does Total QBR predict wins and how sticky is Total QBR?

We know that a high Total QBR is correlated with winning games, but we also know that there’s limited value to such a statement. If having a high Total QBR was one of the driving factor behind winning games, than such a variable would manifest itself in all games, not just the current one. So with my sample of 152 quarterbacks, I used a random number generator to divide each quarterback season into two half-seasons. Then I calculated each quarterback’s average in several different categories and measured the correlation between a quarterback’s average in such category in each half-season with his winning percentage in the other half-season. [4]Then I did the entire process again, using a new set of random numbers, and averaged the results. The results:

StatCC
ESPN QBR0.31
Wins0.28
ANY/A0.25
Passer Rating0.25
TD/Att0.24
NY/A0.22
Yd/Att0.20
Cmp%0.17
Pass Yds0.16
INT/Att0.15
Sack Rate0.14
Attempts0.06

As you would expect, all of our correlations are now smaller. But ESPN’s quarterback rating metric remains the best measure to predict wins. Perhaps even more impressively, Total QBR is more correlated with future wins than past wins. That’s pretty interesting. Another interesting result is that passer rating fares pretty well here, although much of the same issues as before remain with using correlation to derive causal direction. [5]For example, because passer rating is biased towards high completion percentage and low interception rates, quarterbacks who play with the lead tend to produce strong passer ratings; well, playing … Continue reading

One other concept to remember is that our sample of quarterbacks consists of players who were heavily involved in at least 14 games. That makes sure Peyton Manning, Tom Brady, and Drew Brees are involved, while filtering out some Christian Ponder, Blaine Gabbert, and Brandon Weeden seasons. In other words, the data set contains more above-average quarterbacks than a random sample would, so we may not be able to justify certain conclusions from this study.

The other important question is whether Total QBR is predictive of itself; i.e., how “sticky” is this metric over different time periods. We know that interceptions are very random, and knowing a quarterback’s prior interception rate is not all that helpful in predicting his future interception rate. Where does Total QBR fall along those lines?

StatCC
Pass Yds0.69
Attempts0.66
Sack Rate0.56
Cmp%0.49
Passer Rating0.49
ESPN QBR0.47
ANY/A0.46
NY/A0.45
TD/Att0.43
Yd/Att0.42
Wins0.28
INT/Att0.2

The most “sticky” stats were passing yards and pass attempts, which in retrospect isn’t too surprising. These reflect the style of the offense, the talent of the quarterback, and the quality of the defense, so they should be easier to predict. The second-least sticky metric was wins, which also makes sense. After that, ESPN’s Total QBR fits in a narrow tier with most of our other metrics as being somewhat predictable.

Conclusion

The numbers here indicate that Total QBR is worth examining.  It may be a proprietary measure of quarterback play, but it’s not a subjective one with no basis in reality.  It does seem to be the “best” measure of quarterback play, although whether the tradeoff in accuracy for transparency is worth it remains up to each individual reader. One of the drawbacks I see in Total QBR is the failure to incorporate strength of schedule. And while no other traditional passer metric does, either, it’s also easy enough to make those adjustments. Hopefully, an SOS-adjusted Total QBR measure will be released soon (I’ll note that the college football version does include a strength-of-schedule adjustment).  My sense is that Total QBR is underutilized because (1) ESPN haters hate it because it’s an ESPN statistic, (2) it’s proprietary, and (3) analytics types disliked it because of the (now-eliminated) clutch rating.  While I would not suggest making it the only tool at your disposal, it does appear to deserve a prominent place in your toolbox.

References

References
1 For ESPN’s QBR, I took a weighted average of the weekly QBR data. I should note that this is not the way ESPN calculates QBR. As explained to me via email, the scaling function that gives the “final” QBR on a 0-100 scale is nonlinear; as a result, you can’t just calculate a weighted average of the individual game QBR values to get season QBR. Instead, you need to have the “points per play”-like value that’s behind QBR and calculate the weighted average of that (and weight based on the capped clutch weights, not even the action plays), then re-apply the scaling function to get it back on the 0-100 scale. So while I’m recreating QBR, I’m not recreating it the way ESPN would. That disclaimer aside, I don’t think my method will bias these results.
2 As a reminder, the correlation coefficient is a measure of the linear relationship between two variables on a scale from -1 to 1. If two variables move in the same direction, their correlation coefficient will be close to 1. If two variables move with each other but in opposite directions (say, the number of hours you spend watching football and your significant other’s happiness level), then the CC will be closer to -1. If the two variables have no relationship at all, the CC will be close to zero.
3 When Dean Oliver was on the Advanced NFL Stats podcast, he noted that the formula was tweaked in 2013 so that the “clutch index” part of the formula was essentially capped. He added (beginning at 13:45): “The most clutch plays are ending up counting essentially the same as all other plays. [What] we ended up deciding is that for games that are out of reach, when quarterbacks are putting up meaningless statistics because they are playing against a defense that is not trying as hard because they know that the game is essentially over – so that you can get your yards but we’re just trying to run out the clock – so we still keep in a clutch weight reduction effectively, associated with garbage time. But there isn’t the increase in clutch weight associated with clutch plays.”
4 Then I did the entire process again, using a new set of random numbers, and averaged the results.
5 For example, because passer rating is biased towards high completion percentage and low interception rates, quarterbacks who play with the lead tend to produce strong passer ratings; well, playing with the lead is pretty highly correlated with winning, and winning is also correlated with future wins.
{ 26 comments }

Okay, that title could be the opener to any number of jokes. But I mean “strange season” in the way Football Perspective has used the phrase before. Take a look at Cleveland’s schedule and results from 2013:

Score
Week Day Date Rec Opp Tm Opp
1 Sun September 8 boxscore L 0-1 Miami Dolphins 10 23
2 Sun September 15 boxscore L 0-2 @ Baltimore Ravens 6 14
3 Sun September 22 boxscore W 1-2 @ Minnesota Vikings 31 27
4 Sun September 29 boxscore W 2-2 Cincinnati Bengals 17 6
5 Thu October 3 boxscore W 3-2 Buffalo Bills 37 24
6 Sun October 13 boxscore L 3-3 Detroit Lions 17 31
7 Sun October 20 boxscore L 3-4 @ Green Bay Packers 13 31
8 Sun October 27 boxscore L 3-5 @ Kansas City Chiefs 17 23
9 Sun November 3 boxscore W 4-5 Baltimore Ravens 24 18
10 Bye Week
11 Sun November 17 boxscore L 4-6 @ Cincinnati Bengals 20 41
12 Sun November 24 boxscore L 4-7 Pittsburgh Steelers 11 27
13 Sun December 1 boxscore L 4-8 Jacksonville Jaguars 28 32
14 Sun December 8 boxscore L 4-9 @ New England Patriots 26 27
15 Sun December 15 boxscore L 4-10 Chicago Bears 31 38
16 Sun December 22 boxscore L 4-11 @ New York Jets 13 24
17 Sun December 29 boxscore L 4-12 @ Pittsburgh Steelers 7 20

[continue reading…]

{ 3 comments }

Predictions in Review: NFC North

During the 2013 offseason, I wrote 32 articles under the RPO 2013 tag. In my Predictions in Review series, I review those preview articles with the benefit of hindsight. Previously, I reviewed the AFC West, the NFC West, the AFC South, the NFC South, and the AFC North. Today, the NFC North.

The Detroit Lions will win more games in 2013, June 21, 2013

In 2012, Detroit finished 4-12, but they seemed like an obvious pick to have a rebound season. The Lions went 3-9 in games decided by 8 or fewer points that year, which was the worst mark in the league. Since such a poor record is usually a sign of bad luck rather than bad skill, Detroit wouldn’t need to do much to improve on their 4-win season. The Lions had 6.4 Pythagorean wins, and no team fell as far short of their Pythagorean record in 2012 as Detroit. There was one other reason I highlighted as to why Detroit would win more games in 2013: the Lions recovered only 33% of all fumbles that occurred in Detroit games. As a result, the team recovered 7.6 fewer fumbles than expected.

Of course, none of this was a surprise: Vegas pegged Detroit as an average team entering the season. And even though the Lions did finish 7-9, a three-win improvement wasn’t enough to save Jim Schwartz’ job. After a 3-9 record the year before, the 2013 Lions went 4-6 in games decided by 8 or fewer points, which included losses in the team’s final three games.  Detroit did improve when it came to fumble recoveries, but only slightly: the Lions recovered 42.6% of all fumbles in their games in 2013, which was 3.6 recoveries fewer than expected.

What can we learn: When it comes to records in close games and fumble recovery rates, we should expect regression to the mean.  Last year, the Colts (6-1) and Jets (5-1) had the best records in close games; Andrew Luck has been doing this for two years now, but no such benefit of the doubt should be given to the Jets. Meanwhile, Houston (2-9) and Washington (2-7) had the worst records in close games. All else being equal, we would expect both of those teams to improve on their wins total in 2014 (for the 2-14 Texans, it will take some work not to win more games in 2014; and, of course, such rebound seasons are already baked into the Vegas lines).

As far as fumble recovery rates, well, that’s one area where the Jets are hoping for some regression to the mean.

The 2012 Chicago Bears had the Least Strange Season Ever, August 2, 2013

Here’s what I wrote about the 2012 Bears:

The 2012 Bears played two terrible teams, the Titans and the Jaguars. Those were the two biggest blowouts of the season for Chicago. The Bears had five games against really good teams (Seattle, San Francisco, Houston, and the Packers twice): those were the five biggest losses of the season. Chicago had one other loss, which came on the road against the next best team the Bears played, Minnesota.

But the Bears didn’t just have a predictable season. That -0.89 correlation coefficient [between Chicago’s opponent’s rating and location-adjusted margin of victory] is the lowest for any 16-game season in NFL history. In other words, Chicago just had the least strange season of the modern era.

This post was not about predicting Chicago’s 2013 season but analyzing a quirky fact I discovered. The Bears struggled against the best teams in 2012, and that cost Lovie Smith his job. In 2013, Chicago’s season was much more normal; in fact, the Bears had a slightly “stranger” season than the average team.

The Bears did manage to defeat the Bengals and Packers (without Aaron Rodgers), but Chicago still finished below .500 against playoff teams thanks to losses to New Orleans, Philadelphia, and Green Bay (with Aaron Rodgers). After a 2-6 performance against playoff teams in 2012, I suppose a 2-3 record is an improvement. But the irony is that the reason Chicago’s season was less normal in 2013 wasn’t due to better play against the best teams, but because Chicago lost to Minnesota and Washington. In the first year post-Lovie, the Bears missed the playoffs because they lost to two of the worst teams in the league, causing them to miss out on the division title by one half-game. Here’s one stat I bet Lovie Smith knows: from 2005 to 2012, Chicago went 30-0 against teams that finished the season with fewer than six wins. As for which teams had the strangest and least strangest seasons in 2013? Check back tomorrow.

Can Adrian Peterson break Emmitt Smith’s rushing record?, August 3, 2013

What a difference a year makes. Eight months ago, the debate regarding whether Adrian Peterson could break Smith’s record was a legitimate talking point. After a “down” season with 1,266 yards in 14 games, nobody is asking that question anymore. Of course, Peterson never had much of a chance of breaking the record anyway, which was the point of my post. Not only had Smith outgained him Peterson through each of their first six seasons, and not only did Smith enter the league a year earlier than Peterson, but Emmitt Smith was also the leader in career rushing yards after a player’s first six seasons.

Peterson just turned 29 years old. He ranks sixth in career rushing yards through age 28, but Smith has a 1,119 yard advantage when it comes to rushing yards through age 28. Barry Sanders has them both beat, of course, but he retired after his age 30 season. The problem for Peterson? He needs to run for 8,241 yards during his age 29+ seasons to break Smith’s record. The career leader in yards after turning 29 is Smith with 7,121 yards.

What can we learn: Unless Peterson finds the fountain of youth, Smith’s record won’t be challenged for a long, long time.

Witnesses to Greatness: Aaron Rodgers Edition, August 30, 2013

In late August, I wondered if we had taken Rodgers’ dominance for granted. After all, he had a career passer rating of 104.9, the best ever. Then in 2013, he produced a passer rating of … 104.9, the fifth best mark among qualifying passers.

Passer rating stinks, as we all know, but Rodgers is dominant in nearly every metric. If we break passer rating down into its four parts we see:

  • Entering 2013, Rodgers was the career leader in completion percentage. Drew Brees now holds a 0.1% edge over Rodgers in this category. Rodgers completed 66.6% of his passes last year, the 5th best mark of 2013.
  • Rodgers was the career leader in interception rate entering 2013, and still holds that crown. Believe it or not, his 2.1% interception rate last year ranked only 12th.
  • With a 5.9% touchdown rate in 2013 (5th best), he remains the active leader in touchdown percentage. Everyone ahead of him on the career list began their career before 1960.
  • Rodgers was the active leader in yards/attempt prior to 2013, and then he had another dominant year by producing an 8.7 average (2nd best). He’s now widened his lead in this metric and should remain the active leader for the foreseeable future.

What can we learn: That Rodgers is the man? Of course, this year we got to see that first-hand. The Packers went 6-3 in Rodgers’ 9 starts and 2-4-1 without him, but remember, he threw just two passes in his Bears start, which the Packers lost. Count that as a non-Rodgers game, and Green Bay went 6-2 with him and 2-5-1 without him. From there, one might infer that he added 3.5 wins to the Packers last year, tied for the 4th most ever from a quarterback relative to his backups.

The only area where Rodgers struggles is with sacks, and it’s worth remembering that all of his other rate stats are slightly inflated because they do not include sacks in the denominator. He’s still the man, of course, but sacks, era adjustments, and the fact that he isn’t done producing top seasons is why he “only” ranked 12th and 14th on these lists.

{ 1 comment }

Comparing 2014 Vegas Projections to Estimated Wins

Three weeks ago, Vegas released the first set of 2014 win totals for all 32 teams. I immediately wondered how those win totals compare to the estimated wins I created based on 2013 DVOA ratings. I tweeted a request for someone to write such an article, and Warren Sharp (@SharpFootball) was kind enough to oblige. Warren runs SharpFootballAnalysis.com, where he provides handicapping analysis.

One other note before I let Warren take over. If you missed the post on estimating team wins using DVOA, I included this disclaimer:

Even Football Outsiders won’t use these [projections] for more than a starting point — their preseason projections will have the customary tweaks for things like teams getting new quarterbacks, injuries (or the lack thereof) in 2013, rookies, offensive line continuity, etc.

Please keep that note in mind. So when you see “Football Outsiders projects Green Bay to win 7.8 games this year,” that’s just shorthand for “Green Bay’s 2013 offensive, defensive, and special teams ratings, when regressed based on historical data, project a 7.8-win season.” I’m sure with a healthy Aaron Rodgers, Football Outsiders expects more than 7.8 wins in 2013, but the regression formula is ignorant of that fact. And now, I’ll let Warren take over.


On March 7, CG Technology, formerly Cantor Gaming, became the first Las Vegas book to set win totals. For eight teams (25%), the win totals were within one half-game of the estimated DVOA projections: The two sources see eye to eye on Washington, Chicago, Cincinnati, Miami, Detroit, Dallas, Cleveland, and the New York Giants.

For 11 teams (34%), Las Vegas was more enthusiastic than DVOA was, i.e., the books projected higher win totals. The biggest outliers here were Green Bay (10 projected wins by CG vs 7.8 by DVOA) and Houston (8.5 vs 6.5). For Green Bay, we can presume that injuries were the biggest reason for the discrepancy: in addition to Rodgers, Randall Cobb, Clay Matthews, and Casey Hayward all missed significant action. As for the Texans, my guess is that Vegas sees the Colts dropping back two wins from 2013, and the AFC South remains pretty poor.  Houston won 10 games in 2011 and 12 games a year ago, and now faces a pretty easy schedule (the rest of the division, Buffalo, Oakland, the AFC North and NFC East; note that last year, Houston had to face the AFC West, NFC West, New England, and Baltimore.) The Texans were also just 2-9 in games decided by seven or fewer points, a trend that is unlikely to continue.

For the remaining 13 teams (41%), Las Vegas projected fewer wins than DVOA. The two standouts in this category were Arizona (7.0 vs 8.6) and St. Louis (6.5 vs 8.0). As we’ll get to later, CG and Football Outsiders are in considerable disagreement about the fortunes of the NFC West teams.

In some cases, the borderline playoff teams are the most interesting to analyze. There were four teams that DVOA had at sub-.500 that the linemakers have in playoff contention: Green Bay, Houston, Pittsburgh (9.0 vs 7.7) and Baltimore (8.5 vs 7.3). Arizona was the only team in the opposite situation, where Las Vegas projects a losing record despite the DVOA estimates pointing towards a winning record.

The table below shows the numbers for all 32 teams. The Packers had 8.5 wins in 2013, Vegas has set Green Bay’s 2014 wins total at 10.0, and DVOA projects the Packers at 7.8 wins. Therefore, Vegas is 2.2 wins higher on Green Bay than DVOA, Vegas is 1.5 wins higher on Green Bay than the Packers’ 2013 result, and DVOA expects 0.7 fewer wins from Green Bay this year. [continue reading…]

{ 5 comments }

Take heart, Browns fans: there was a 50% chance Cleveland would recover this

Take heart, Browns fans: there was a 50% chance Cleveland would recover this fumble.

There are few statistics more random in all of sports than fumble recoveries. When a football is on the ground, it’s not the case that better teams are more likely to fall on the ball than bad teams: in the NFL, recovering fumbles is nearly all luck and little skill. This is a fact widely accepted by all statisticians, but I figured I would still crunch the numbers just to confirm.

I looked at all teams from 1990 to 2012. First, I looked at fumble recovery rates for teams on their own fumbles. The correlation coefficient between fumble recovery rate in Year N and fumble recovery rate in Year N+1 was 0.00. In other words, there is simply no correlation between fumble recovery rates from year to year. Nada. Zilch. (Of course, fumble recovery rates do vary by type, but that appears to be muted when analyzing fumbles in the aggregate.)

I then looked at fumble recovery rates for teams on their opponent’s fumbles. The correlation coefficient there from year-to-year was -0.02. In other words, there is simply no correlation between recovering your opponent’s fumbles in one year and the next. The best way to predict each team’s fumble recovery rate is to simply project teams to recover about half of all their fumbles. [1]Actually, the best number is usually just shy of fifty percent. If words like regression cause your eyes to roll over, consider this: from 1990 to 2012, the top 20 teams in fumble recovery rate recovered 75.4% of their own fumbles; the following year, they recovered 50.4% of their own fumbles.

With that disclaimer out of the way, who were the best and worst teams at recovering fumbles in 2013? Let me walk through the Cowboys as an example. Last year, Dallas fumbled on offense 18 times, and lost 8 of them. Based on the league-wide average 47.6% recovery rate last year, the Cowboys lost 0.6 fewer fumbles than expected (a negative number here means the team did not lose as many fumbles as they “should” have). Cowboys opponents fumbled 16 times and lost 13 of them; as a result, Dallas recovered 5.4 more fumbles than we would have expected. Overall, this means the Cowboys recovered 6.0 more fumbles than expected, the highest number from last season; overall, on the 31 fumbles in Cowboys games, Dallas recovered 67.6% of them. [continue reading…]

References

References
1 Actually, the best number is usually just shy of fifty percent.
{ 6 comments }

The Best 40-Yard Dash Times since 1999

A month ago, I looked Jadeveon Clowney’s impressive time in the 40-yard dash. In that post, I argued that all 40-yard times must be adjusted for weight. Well, thanks to the good folks at NFLSavant.com, 40-yard dash times are available for many players going back to 1999. Which made me wonder: which players have posted the best and worst times after adjusting for weight?

After playing around with the data, I noticed that two other variables were correlated with 40-yard dash times: height and year. The best way to explain the relationship is through the best-fit linear regression formula, which is:

40 yard time = 10.0084 – 0.00326 * Year – 0.00214 * Height + 0.00605 * Weight

What does that mean? For every year since 1999, the average time has been increased by three thousands of a second. That may not seem like very much, but it does make a 4.45 time from 1999 equivalent to a 4.40 time today. Similarly, taller players have an advantage, to the tune of two thousands of a second per inch. The effect is so tiny not to matter, but an extra eight inches means you should expect a 4.5 to turn into a 4.48. [1]In retrospect, I think this understates the effect of height. There are enough tall, slow quarterbacks — who are really outliers on the speed scale, since they are not particularly heavy … Continue reading The big variable, of course, remains player weight. A 6’5, 260 pound player in 2014 would be expected to run the 40 in 4.85 seconds; make that player weigh 220 pounds, and his expected time drops to 4.61.

Courtesy of the data from NFL Savant, I calculated the expected 40-yard dash time of about 4500 players since 1999; the expected time is based solely on the formula presented at the top of this post. A couple of disclaimers: I’ve tried to link each player to their appropriate PFR page, but there is some name overlap, so forgive any errors. Also, in order to make the tables sort correctly, I’ve included an 8 for the round of any undrafted player or 2014 prospect. [continue reading…]

References

References
1 In retrospect, I think this understates the effect of height. There are enough tall, slow quarterbacks — who are really outliers on the speed scale, since they are not particularly heavy — to confuse the regression. At least, I think.
{ 16 comments }

How will DeSean Jackson age?

DeSean Jackson crosses the goal line before discarding the ball

DeSean Jackson crosses the goal line before discarding the ball.

If you believe the rumors, the Eagles are desperately trying to trade wide receiver DeSean Jackson; absent an eligible suitor, and Philadelphia may even cut the three-time Pro Bowler. This is a pretty weird situation; what’s even weirder is how few tangible reasons have been given as to why the Eagles desire to remove him from the roster.

Jackson has a cap hit of $12.75M this year and $12M in each of the next two seasons; that’s obviously a significant amount, and I don’t doubt that Philadelphia feels a bit of buyer’s remorse on that contract. But reading the tea leaves indicates that a high salary cap figure is only part of the issue; unfortunately, without knowing the other reasons, it’s impossible to suggest whether a team would be wise to trade for him. This might be a Randy Moss-to-New England situation, or it could just as easily be a Santonio Holmes-to-the-Jets disaster. [continue reading…]

{ 10 comments }
Sanchez tries to understand the formula for wins above expectation

Sanchez tries to understand the formula for wins above expectation.

On Friday, the Jets released Mark Sanchez. I don’t have much in the way of a post mortem, but it felt odd not to have at least some post on the subject. And despite watching every Sanchez start for four years, it still takes me by surprise when I see that his career record is 33-29. That winning record came despite Sanchez being one of the worst starters in the league for most of his career. Through five seasons, he has a career Relative Adjusted Net Yards per Attempt average of -1.03. Among the 140 quarterbacks to enter the NFL since 1970 who have started 40 games, only one other passer (who will remain nameless for now) had a winning record with a worse RANY/A than Sanchez; the next worst quarterback with a winning record over that time frame is Trent Dilfer, who finished 58-55 with a career -0.85 RANY/A.

If you grade quarterbacks by #Winz, Sanchez is above-average. If you look at passing statistics — i.e., ANY/A — he’s one of the worst in the league. So I thought I would quantify that gulf and see if Sanchez was the quarterback with the largest disparity between winning percentage and passing statistics.

First, I ran a regression on team wins (pro-rated to 16 games) and Relative ANY/A for every year since 1970. The best fit formula was 8.00 + 1.756 * RANY/A. In other words, for every 1.00 ANY/A above league average, a team should expect to win 1.756 more games. For a team to expect to win 11 games, they need to finish 1.71 ANY/A better than average.

Next, I calculated the career RANY/A — i.e., the ANY/A relative to league average — for every quarterback to enter the league since 1970. For example, Sanchez has a RANY/A of -1.03. This means you would expect his teams to win 6.19 games every season, for a 0.387 winning percentage. In reality, Sanchez’s Jets have a 0.632 winning percentage, which means he has an actual winning percentage that is 0.146 higher than his expected winning percentage. As it turns out, that differential puts him in the top ten, but it is not the best mark.

That honor belongs to Mike Phipps. Here’s how to read the table below, which shows all 140 quarterbacks to enter the league since 1970 and start at least 40 games. Phipps entered the league in 1970 and last played in 1981, starting 71 games in his career. He finished with a career RANY/A of -1.52; as a result, he “should have” won only 23.6 games. In reality, he won 39 games, meaning he won 15.4 more games than expected. On a percentage basis, his RANY/A would imply a .333 expected winning percentage; his actual winning percentage was 0.549, and that difference of +0.216 is the highest in our sample. [continue reading…]

{ 11 comments }

Wazzup????

Wazzup????

Some quarterbacks and wide receivers just go together. Peyton Manning and Marvin Harrison. Dan Marino and Mark Clayton and Mark Duper. Joe Namath and Don Maynard. John Hadl and Lance Alworth. But quarterbacks play with lots of receivers, and receivers generally play with several quarterbacks. We don’t remember most combinations, but that doesn’t mean they were all unproductive. So I thought it might be interesting to look at every wide receiver since 1950, find his best single season in receiving yards, and record who was his team’s primary quarterback that season.

Jerry Rice’s best year came with Steve Young, not Joe Montana. Randy Moss set the touchdown record with Tom Brady, but his best year in receiving yards was with Daunte Culpepper. Lynn Swann’s best year was with Terry Bradshaw, but John Stallworth’s top season in receiving yards came with Mark Malone. James Lofton’s best season was with Lynn Dickey, Isaac Bruce’s best year was with Chris Miller, Torry Holt’s top season came with Marc Bulger, and Tim Brown’s top year was with Jeff George.

This is little more than random trivia, but this site does not have aspirations for March content higher than random trivia. In unsurprising news, 25 different players had their best season in receiving yards (minimum 300 receiving yards) while playing with Brett Favre. That includes a host of Packers, but also a couple of Jets and Vikings, too (including one future Hall of Famer).

After Favre, Marino is next with 22 players, and he’s followed by Manning and Fran Tarkenton (20). From that group, I suspect that Tarkenton might surprise some folks. That is, unless they realized that he was the career leader in passing yards when he retired and played for five years with the Giants and thirteen with Minnesota.

The table below shows every quarterback who was responsible for the peak receiving yards season of at least five different receivers (subject to the 300 yard minimum threshold). For each quarterback, I’ve also listed all of his receivers. [continue reading…]

{ 10 comments }

Matt Schaub and a franchise quarterback in the same sentence

Matt Schaub and a franchise quarterback in the same sentence.

The Texans and Raiders recently made a couple of veteran quarterback acquisitions. The team with the first overall pick in May’s draft signed Ryan Fitzpatrick and then traded Matt Schaub to Oakland, owners of the fifth overall selection. Will either team now be deterred from spending a top five pick on Teddy Bridgewater, Blake Bortles, or Johnny Manziel? Putting aside your feelings on those players, one would certainly hope not simply as a matter of principle. The idea that a journeyman quarterback would cause an organization to pass on a potential franchise quarterback is absurd. If the Texans choose to select Jadeveon Clowney over a quarterback with the first overall pick, that’s fine, but the reason isn’t going to be because Houston is confident that Fitzpatrick is the quarterback of the future.

I thought it would be interesting to review the last 20 years of NFL history and identify situations where a team added a veteran quarterback and then still selected a passer in the first round of the draft. There weren’t quite as many examples as I originally expected, although part of the explanation is that there simply aren’t that many quarterbacks drafted in the first round, period. In addition, the 2011 lockout prevented this from happening that year, but teams that spent high picks on quarterbacks went after veterans once the lockout ended. Minnesota traded for Donovan McNabb after drafting Christian Ponder, the Titans signed Matt Hasselbeck and gave him the starting job over Jake Locker, and even the Panthers brought in Derek Anderson to do something for Cam Newton. But let’s look at some of the examples more similar to Schaub-to-Oakland or Fitzpatrick-to-Houston: [continue reading…]

{ 5 comments }

Meaningless receiving yards

Shorts makes a meaningful catch

Shorts makes a meaningful catch.

Which player led the league in meaningless receiving yards last year? Wait, what are meaningless receiving yards?

I am defining a meaningless receiving yard as one where:

  • On third or fourth down, a player gained fewer yards than necessary for the first down.
  • The receiving yard(s) came in a loss and when the player’s team trailed by at least 28 points.
  • The receiving yard(s) came in a loss and when the player’s team trailed by at least 21 points with fewer than 15 minutes remaining.
  • The receiving yard(s) came in a loss and when the player’s team trailed by at least 14 points with fewer than 8 minutes remaining.
  • The receiving yard(s) came in a loss and when the player’s team trailed by at least 9 points with fewer than 3 minutes remaining.

This definition is not perfect — Le’Veon Bell had a 29-yard reception on 3rd-and-30 last season against the Patriots, and then rushed for a first down on 4th-and-1 — but I think it gets us close enough to perfect that I feel comfortable using it. The results aren’t too surprising — two Jaguars ranked in the top three, separated by the player who led the league in receiving yards — but that doesn’t have to be the end of the analysis. [continue reading…]

{ 7 comments }

Don't worry, this will all make sense by the end. I think.

Don't worry, this picture's presence will make sense by the end. I think.

Two years ago, I wrote this post on running back aging curves. One conclusion from my research was that age 26 was the peak age for running backs, which was immediately followed by a steady decline phase until retirement. In that study, I only wanted to look at very good-to-excellent running backs in the modern era; as a result, I was forced to limit myself to just 36 players. I’ve been meaning to update that post, but wasn’t quite sure what methodology to use.

Last year, Neil wrote a very interesting post on quarterback aging curves. In it, Neil computed the year-to-year differences in Relative ANY/A at every age. While reviewing that post, a lightbulb went off. We can greatly increase the sample size if we only look at running backs from year-to-year, and not just the best running backs on the career level.

There are 723 running backs since 1970 who had at least 150 carries in consecutive seasons and who were between 21 and 32 in the first of those two seasons. For each running back pair of seasons, I calculated how many rushing yards the player gained in Year N and many yards he gained in Year N+1. Take a look:

[continue reading…]

{ 28 comments }

No, Peyton, you are #1

No, Peyton, you are #1.

While working on a different post, I needed to derive a quick-and-dirty formula to identify the top 100 or so quarterbacks in NFL history. Here is how I went about doing that:

1) Calculate the Relative ANY/A of each quarterback in every season since 1950. ANY/A, of course, is Adjusted Net Yards per Attempt, defined as (Gross Pass Yards + 20*Pass_TDs – 45*INTs – Sack Yards Lost) divided by (Pass Attempts + Sacks). For quarterback seasons before 1969, we do not have sack data, so that part of the analysis is ignored (I could have used estimated sack data, but I being lazy).

2) For each quarterback season, multiply each quarterback’s number of dropbacks by his Relative ANY/A to derive a Passing Value over Average metric.

3) Pro-rate non-16 game seasons to 16 games.

4) Calculate a career grade for each quarterback based on the sum of his best five seasons.

Then I realized that this data, while background material for a separate post, was probably interesting to folks in its own right.  Hence today’s post. You should not be surprised to see that Peyton Manning is number one on this list. Here’s how to read his line. His best year came in 2004, when he produced 2113 Adjusted Net Yards over Average. Last year was his second best season — his gross numbers were more impressive, of course, but he produced “only” 2,031 ANY over average. Manning’s other three best years came in ’06, ’05, and ’03. Overall, he produced 8,115 Adjusted Net Yards over Average over his five best seasons, the best of any quarterback in this study (by a large margin). The table below shows the top 100 passers since 1950 (you can change the number of quarterbacks displayed in the dropdown box). [continue reading…]

{ 71 comments }

Reminder: Neil Paine now at FiveThirtyEight

In December, I let you know that Nate Silver’s new FiveThirtyEight had made the smart decision to hire Neil Paine.  On Monday, the website opened its doors, so I wanted to make sure my readers were aware that Neil is (thankfully) back in the writing game.  You can read all of Neil’s posts here. Of course, the full site is worth checking out, too.

{ 2 comments }
Chris Berman has already copyrighted Teddy 'Bridge over troubled' Water.

Chris Berman has already copyrighted Teddy 'Bridge over troubled' Water.

Sometimes, it’s hard to believe that it’s 2014. With draft season now in full gear, I wanted to take a few minutes and look at the stats of the top college quarterbacks from last year. Unfortunately, that’s easier said than done. I couldn’t find a site that presented a full list of all college quarterback stats, including sacks, which is, of course, insane.

College football records sacks as rushing plays for the offense; as a result, knowing how many sacks Johnny Manziel or Teddy Bridgewater took last year is not that easy to find. So here’s what I did:

1) Using team game log data, I found the number of sacks for each defense in each game.

2) Next, I recorded the percentage of team pass attempts recorded by each quarterback for his offense in each game (usually close to 100%).

3) I synched up these two sets of data, and multiplied each quarterback’s percentage of team pass attempts by the number of sacks by his opponent’s defense in that game.

That provided me with some useful estimated sack data. From there, I calculated each quarterback’s Adjusted Net Yards per Attempt average, which is simply (Gross_passing_yards + 20*PassTDs – 45*INTs – Estimated_sack_yards_lost) / (Pass_attempts + Estimated_sacks). I did this for the 140 quarterbacks with the most pass attempts in the FBS (sorry, Jimmy Garoppolo fans) in 2013.

Since the number of pass attempts vary wildly at the college level, I also calculated a Value Over Average statistic. The 140 quarterbacks had an average ANY/A of 6.44, so the Value metric (which is what the table is sorted by) is simply (ANY/A – 6.44) * (Pass_attempts + Estimated_sacks). Here’s how to read Bridegwater’s line, the Louisville quarterback who many believe will be the first quarterback selected in the draft.

Bridgewater provided the 5th most passing value by this formula, completing 303 of 427 passes for 3,970 yards with 31 touchdowns and 4 interceptions. He took 25.5 sacks and lost 185 yards, and had a sack rate of 6% (if I included the percent sign, the table would not sort correctly). Bridgewater also averaged 13.1 yards per completion and had a 9.34 ANY/A average, which combined with his number of dropbacks, means he added 1,310 adjusted net yards of value over average. By default, the table below only shows the top 25, but you can sort and/or search to find each of the 140 quarterbacks (and you can change the number of quarterbacks displayed via the dropdown box to the left). [continue reading…]

{ 7 comments }

The Best Punt Returners in NFL History

Six years ago, I wrote a series of posts looking at the best returners in NFL history. Today, I want to update that list by examining the best punt returners in NFL history. As with most statistics, yards per punt return has fluctuated throughout most of NFL history. The graph below shows the average in this metric from 1941 through 2013:

y pr [continue reading…]

{ 7 comments }

Jones catches another bomb

Jones catches another bomb.

In November, I noted that Chris Johnson was the career leader in average length of rushing touchdown. Since then, he’s actually dropped to number two, as his six rushing touchdowns covered “only” 84 yards in November and December. But what about the career leader in average length of receiving touchdown?

That title belongs to former Giants wide receiver Homer Jones.  A star in the late ’60s, 19 of Jones’ 36 career touchdowns went for 50 or more yards. The table below shows all 413 players to record at least 35 receiving touchdowns (including the postseason) from 1940 to 2013.  While Jones leads in average touchdown length, I think it makes more sense to sort the list by median touchdown length, although that doesn’t matter much for Jones.  For each player listed, I’ve included both their average and median touchdown length, the years they played, and a best guess at their primary position.  The table by default shows 50 entries, but you can change that; in addition, the table is fully sortable and searchable. [continue reading…]

{ 8 comments }

How Bad Was Ray Rice in 2013?

Rice just barely averaged his height in 2013

Rice just barely averaged his height in 2013.

The 2013 season was a disaster for Ray Rice, and 2014 isn’t off to a very good start, either. Last season, Rice carried 214 times for just 660 yards and four touchdowns, producing an anemic 3.1 yards per carry average. On November 9th, I asked whether Rice was already washed up; at the time it felt a bit premature, but in retrospect, such a view seems much more reasonable. Averaging so few yards per carry over such a large number of carries is pretty rare. How rare?

As a disclaimer, I’m in the camp that thinks YPC is an overrated statistic. In 2013, Marshawn Lynch, Eddie Lacy, and Frank Gore all averaged around the league average of 4.17 yards per carry, but that doesn’t make them average backs. So consider much of this post to be a bit of trivia and fun with stats, rather than the best way to identify running back productivity. With that disclaimer out of the way, I calculated each player’s “yards above league average” for each season since 1950, which is the product of a player’s number of carries and the difference between his YPC average and the league average YPC rate.

For example, since Rice averaged 3.08 YPC on 214 carries, he gets credited for being 231 yards below average in 2013. By this measure, Rice was the worst running back in the league. He was worse than his teammate Bernard Pierce (who actually had a lower YPC average but on fewer carries, so he finished 197 yards below average), worse than Willis McGahee (-198) or Rashard Mendenhall (-217), and even worse than Trent Richardson (-220). And this wasn’t your typical worst season in the league, either: his 2013 performance ranks as the 15th worst in this metric since 1950: [continue reading…]

{ 2 comments }

Free Agency Roundup

Happy Friday, folks.

Dr. Jene Bramel (@JeneBramel), who always has interesting insights on defensive players and injuries in the NFL, is producing multiple daily updates for his excellent blog over at Footballguys.com. Jene is very high on DeMarcus Ware (calling the Broncos as good a fit as any schematically for Ware), a bit lukewarm on Jon Beason (“last year showed that he cannot execute sideline to sideline or in coverage”), and thinks the Bears were wise to sign Lamarr Houston.

Sigmund Bloom (@SigmundBloom) handles the blog for offensive players over at Footballguys, and he does a great job of not only telling you what happened, but why the transactions matter from a fantasy perspective.

Bill Barnwell (@billbarnwell) wrote a pair of very good recaps after day 1 and day 2 of free agency.

Mike Tanier (@MikeTanier), who also reviewed the news from day 1 of free agency, later explained why the 49ers traded for Blaine Gabbert and Jonathan Martin.  Mike also contributed an article that is surely near and dear to the hearts of Football Perspective readers: five stats that really should be official.

Three years ago, Matt Waldman (@MattWaldman) wrote this article about new Jet Eric Decker.  Matt also chimes in with his view on the silly test known as the Wonderlic and an in-depth description of how he scouts quarterbacks.

Former NFL safety Matt Bowen (@MattBowen41) argues that the position is more important than ever, and which would explain the large contracts given to Jairus Byrd, T.J. Ward, and Donte Whitner. [continue reading…]

{ 1 comment }

How Have Previous Eric Deckers Fared?

Decker learns how to run a Papa Johns franchise

Decker learns how to run a Papa John's franchise.

Just a few minutes before press time, the Jets signed Eric Decker, generally considered the best wide receiver available in free agency. But for weeks, the #hotsportstake on Eric Decker has been pretty clear: he’s a product of playing with Peyton Manning and alongside Demaryius Thomas (and Wes Welker and Julius Thomas). It would take you awhile to find a discussion of Decker’s free agent candidacy without hearing the phrase “he’s not a number one wide receiver.” This sort of analysis is obviously lazy, but it’s also a fascinating counter to an unmade argument. In the same way that Joe Namath is now an underrated quarterback, it’s fair to wonder: if so many people are calling Decker overrated, how can he be overrated?

In today’s post, I want to look at how the previous ten Eric Deckers have fared. What’s an Eric Decker? A gritty hard working player who runs great routes receiver who met each of the following criteria:

  • Finished as a top-20 fantasy wide receiver (with 1 point per 10 yards, 6 points per touchdown, 0.5 points per reception as the scoring system) in Year N
  • Was not his team’s top fantasy wide receiver in Year N
  • Played for a different team in Year N+1

[continue reading…]

{ 7 comments }

Recapping the News From Day 1 of Free Agency

What uniform will DeMarcus be Waring in 2014? [punches self in face]

What uniform will DeMarcus be Waring in 2014? {punches self in face}.

Free agency kicked off at 4PM yesterday, the start of what may be the dumbest day of the year. Some absurdly large contracts were dished out, as always, but free agent signings weren’t the only news stories on Tuesday.  The new regime in Tampa Bay appears ready to move on from the Darrelle Revis era, possibly via a trade to the Browns or an outright release. The Cowboys ended their game of renegotiating chicken with DeMarcus Ware by cutting him; he was joined on the waiver wire by Chicago DE Julius Peppers, 49ers CB Carlos Rogers and Steelers OLB LaMarr Woodley.

One of the first major signings came in Miami, where 29-year-old Branden Albert was finally brought to South Beach. The Dolphins tried to trade for Albert to replace Jake Long last year, but talks with the Chiefs fell apart, leaving the team to turn first to Jonathan Martin and then Bryant McKinnie at left tackle. The Dolphins gave Albert big money — a five-year deal worth $46M with $25M guaranteed – but after last year’s headache, this is probably money well spent.

The Bucs added former Bengals defensive end Michael Johnson as soon as free agency opened, luring him with a whopping five-year, $43.75M ($24M guaranteed) deal.  Tampa Bay desperately needed to improve the pass rush, and Johnson will team with Gerald McCoy to make the defensive line a strength of the team. And while losing Revis will hurt, Tampa Bay signed Alterraun Verner late in the day to 4-year, $26.5M deal with $14M guaranteed.  That’s a pretty reasonable deal: If Verner plays out that contract, Tampa will have saved nearly $40M compared to what they would have paid Revis over that time.

The Browns played a bit of whack-a-mole on Tuesday.  Cleveland lost inside linebacker D’Qwell Jackson to Indianapolis before the start of free agency, and replaced him yesterday with former Cardinal Karlos Dansby (initially reported as four years, $24M, $14M guaranteed). Dansby, as you may recall, was arguably the second best free agent signing of 2013, so this was probably an upgrade (but the Browns got older). More curious was the team’s decision to pass on resigning safety T.J. Ward (who signed a reasonable $5.75M/Yr deal with the Broncos) and sign former 49er Donte Whitner to a four-year deal worth $28M. To replace Whitner, the 49ers signed longtime Colts safety Antoine Bethea. [continue reading…]

{ 14 comments }

Predictions in Review: AFC North

During the 2013 offseason, I wrote 32 articles under the RPO 2013 tag. In my Predictions in Review series, I review those preview articles with the benefit of hindsight. Previously, I reviewed the AFC West, the NFC West, the the AFC South, and the NFC South. Today, the AFC North.

Marvin Lewis, Jim Mora, and the Playoffs, May 30, 2013

In this article, I noted that Marvin Lewis had coached the Bengals for ten seasons without recording a playoff victory.  That was pretty unique: Since 1966, only Jim Mora had coached a team for longer without notching a playoff victory, and he was fired by the New Orleans Saints in his 11th year after a 2-6 start. Well, Lewis now stands alone in the Super Bowl era, as the only coach to fail to record a playoff win in 11 straight seasons and then be brought back for season twelve.

Since I wrote that article, though, I’ve become much more sympathetic to Lewis.  For years, it was easy to take pot shots at his ridiculous use of challenges or his failure to be aggressive when the situation warranted it, but I now think Lewis is one of the better coaches in the league.  He seems to have a knack for connecting with his players, he’s surrounded himself with very good coaches, and you get the sense that he has more on his plate organizationally than the typical head coach.  He’s the de facto GM, unless you consider Mike Brown the real man building the franchise.  And he’s developed one of the most talented rosters in the league, even if Andy Dalton turns into a pumpkin every January.

Of course, that is just cold comfort to Bengals fans who have witnessed the team go 0-11 in the Lewis era when it comes to recording a playoff victory. On the other hand, Cincinnati didn’t win a playoff game in any of the 12 seasons immediately preceding the Lewis hire, either.  But Lewis’ streak is particularly notable for just how rare his tenure has been in today’s environment. [continue reading…]

{ 1 comment }

One Play Away

Football Perspective accepts guest posts, and Andrew Healy submitted the following post. And it’s outstanding. Andrew Healy is an economics professor at Loyola Marymount University. He is a big fan of the New England Patriots and Joe Benigno.


The Browns were one play away from the Super Bowl

How much did this player lower Cleveland's Super Bowl odds?

The Catch. The Immaculate Reception. The Fumble. We remember all these plays, but which mattered the most? More specifically, what plays in NFL history had the biggest impact on who won the Super Bowl?

The answer to this question is kind of surprising. For example, two of those famous plays are in the top 20, but the other wasn’t even the most important play in its own game. Going all the way back to Lombardi’s Packers, the memorable and important plays overlap imperfectly.

Here, I try to identify the twenty plays that shifted the probability of the eventual Super Bowl winner the most. According to this idea, a simple win probability graph at Pro-Football-Reference.com identifies a not-surprising choice as the most influential play in NFL History: Wide Right. What is surprising is that they give Buffalo a 99% chance of winning after Jim Kelly spiked the ball to set up Scott Norwood’s kick. Obviously, that’s way off. [1]I think it happens because their model basically gives you credit for your expected points on the drive, which is enough to win since Buffalo was down by a point.

A better estimate would say him missing the kick lowered the Bills chances of winning from about 45% to about 0%. Norwood was about 60% for his career from 40-49 yards out, and 2 for 10 from over 50. Moreover, he was 1 for 5 on grass from 40-49 before that kick. But the conditions in Tampa that night were close to ideal for kicking. It’s hard to put an exact number on things, but around 45% on that 47-yard kick seems about right.

So that 45 percentage point swing in a team’s chances of being the champ is what I’m going to call our SBD, or Super Bowl Delta, value. I’m going to identify the twenty plays with the biggest SBD values, the ones that swung the needle the most.

Here are the ground rules for making the cut. [continue reading…]

References

References
1 I think it happens because their model basically gives you credit for your expected points on the drive, which is enough to win since Buffalo was down by a point.
{ 20 comments }

xp avgThe NFL’s Competition Committee is currently considering rules changes to eliminate the boredom associated with the extra point. As you can see from the graph above, extra points are practically automatic now, to the tune of a 99.6% conversion rate in 2013. In fact, extra points have been close to automatic for awhile; the success rate was even as high as 96.8% in 1973, the last year the goal posts were still right on the goal line. The conversion rate was depressed for about 15 years before bouncing back to 97% in 1989, and there have been just 18 missed extra points total in the last three years. I don’t disagree that something could be done to improve the quality of the game.

The simplest alternative is to make touchdowns worth seven points instead of six, and to allow a team to gamble one of those points in the hopes of getting two points by “going for two.” In other words, we would have the system we have now, except that the song and dance of actually kicking the extra point is replaced with an automatic point.

Another solution is to eliminate the extra point entirely, requiring that teams go for two after every touchdown. I won’t try to answer the subjective question of whether or not this would make for a more enjoyable fan experience; the more interesting question to me is whether or not this would lead to more upsets. In other words, if teams had to go for two after every touchdown, would this lead to the better team winning more or less often? I posed this question on the Footballguys.com message boards and got into a good discussion there, much of which I’ll summarize here.

Before analyzing, we must recognize that the two-point play is not like a typical NFL play. A team that’s great in short yardage (say, Carolina) would probably be better off than most teams at converting on these attempts. Likewise, teams that excel in goal-line defense but maybe don’t have great corners (like say, Carolina) would probably be better off, too. But I think, on average, good teams are better at converting two point plays than bad teams, and, on average, good teams are better at preventing two point conversions than bad teams.

So how would such a rule change impact NFL games? One argument that this rule change would make the better team more likely to win is that this would present an additional hurdle for the weaker team. By replacing a play where everyone is successful with a competitive play, this increases the sample size, generally a bad thing for underdogs. Right now, a weaker team only needs to match the stronger team touchdown for touchdown (and field goal for field goal and safety for safety). But if the weaker team matches the better team under this new regime, the weaker team, on average, will still be trailing. By increasing the sample size of relevant plays, the weaker team needs to outplay the better team for longer, making it harder to pull the upset.

On the other hand, the argument is probably more convincing the other way that a mandatory “go for two” rule would lead to more upsets. That’s because the 2-point conversion play is a high-leverage play, and the inclusion of more high-leverage plays is generally a positive circumstance for the underdog. Imagine a rule change where the NFL made going for 2 mandatory, but made the successful outcome worth 20 points. That environment would almost certainly make things better for weaker teams: instead of having to outplay the better team for 60 minutes, the weaker team could be outplayed and win as long as they won on two or three key plays. That’s taking the example to its extreme, but one could argue that the same idea holds with the conversion worth two points, even if the effect would obviously be muted.

Here’s another way to think about it.  Let’s ignore games that aren’t very competitive, because the outcomes of those games won’t change under the current format or the “mandatory go for two” environment.  But there are three other types of games: [continue reading…]

{ 10 comments }

The prevailing view is that Vegas is an example of an efficient market. If there were obvious trends that oddsmakers ignored, it would be easy for people to make money gambling on football, and we know that’s not the case. But I thought it would be interesting to investigate some claims I’ve heard over the years, so I’m introducing the Efficient Vegas tag to Football Perspective.

One theory I’ve heard is that when good teams play bad teams, the smart money is to bet on the bad teams. That’s not because Vegas doesn’t know what it was doing, but that oddsmakers know that fans like to bet on good teams when they play bad ones. But is this true? Here is how I decided to test that question.

From 1990 to 2013, there were 792 games that met the following four criteria: [continue reading…]

{ 26 comments }

Austin and the Rams blew out the Colts

Austin and the Rams were nonconformists.

In week 10 of the 2013 season, the Rams traveled to Indianapolis. By the end of the season, St. Louis had an SRS grade of +2.2, meaning they were 2.2 points better than average. The Colts finished 2013 with an SRS grade of +4.1; if you award three points for home field, we would expect Indianapolis to have defeated St. Louis by 4.8 points (the Colts, in fact, were 9-point favorites). What happened? You probably remember: Tavon Austin had a record-setting day, the Rams jumped out to a 28-0 halftime lead, and Andrew Luck wasn’t able to mount one of his patented comebacks. St. Louis posted a Game Script of 23.2, the second largest result of the season, en route to a 38-8 victory.

Instead of a 4.8-point loss, the Rams won by 30 points. That difference of 34.8 points made it the least-conforming game of the 2013 season. What was the most? In week 6, the Chiefs (SRS of +6.1) hosted the Raiders (SRS of -8.0) and won, 24-7.

The table below shows every regular season game in 2013.  The “Boxscore” cell is linked to the boxscore for that game on PFR, the “Exp” column shows the expected result, and the “Diff” column — by which the table is sorted — shows the difference between the expected result and the actual result. [continue reading…]

{ 4 comments }

What Teams Might Sign Jimmy Graham?

What uniform will Graham be wearing in 2014?

What uniform will Graham be wearing in 2014?

On February 28th, the Saints elected to use the non-exclusive franchise tag on Jimmy Graham. The big dispute now is whether Graham should be classified as a tight end or a wide receiver; if Graham is classified as a tight end, the tag is worth $7.0 million, a number that jumps to $12.3 million if he’s labeled a wide receiver. An arbitrator will decide which position Graham plays for New Orleans, but it’s the type of tag the Saints used that’s interesting to me.

By using the non-exclusive tag, any team can sign Graham to a contract… provided such a team is willing to give up two first round draft picks to the Saints on top of the huge contract needed to lure Graham. On the surface, giving up so much capital for a tight end non-quarterback seems absurd, as the new Collective Bargaining Agreement has increased the value of rookies to a team. Players in their first four seasons contribute nearly half of all value provided by NFL players each season, and these players are now on very cheap contracts. As a result, teams should be even more hesitant to trade draft picks for players than they were before.

But that analysis doesn’t foreclose the idea that for a handful of teams, giving up picks for Graham could be a smart idea. And here’s something important to keep in mind: a team can sign Graham after the draft, giving up only 2015 and 2016 first round picks. We can all agree that there is some time value to draft picks; what does this mean for those future first round picks? Are they equivalent to a 2014 2nd and 2014 3rd? Well, probably not, but they’re not equal to two 2014 firsts, either.

Signing Graham would be a poor decision for most teams, but a team that meets several of these qualifications could justify the decision:

  • In a win-now window, i.e., a team that has a very good chance of winning a title in 2014 and 2015, and just an average chance down the road.
  • That would benefit specifically from harming the Saints
  • One offensive playmaker away from being a challenger
  • Expecting to have very good records in 2014 and 2015
  • In great salary cap shape, mitigating the impact of a large Graham contract

The Seahawks, with huge contracts on the horizon for Russell Wilson, Earl Thomas, and Richard Sherman, along with several others, are probably out of the mix because Seattle is not in great long-term cap shape. And for most teams, giving up two first round picks is just too much. But there are a few teams that might find this to be a very tempting move:

[continue reading…]

{ 20 comments }

Terry Bradshaw finished his career with 212 touchdowns, 210 interceptions and a 70.9 passer rating. Kurt Warner threw 208 touchdowns against only 128 interceptions, and his 93.7 passer rating ranks 8th in NFL history and 2nd among retired players. But Bradshaw played from 1970 to 1982, while Warner played from 1998 to 2009. As a result, comparing their raw statistics holds very little meaning. Comparing across eras is very challenging, but not impossible. And in this case, once you place the numbers in the proper context, Bradshaw’s numbers were arguably more impressive than Warner’s numbers.

Let’s start with Bradshaw and begin by looking at his Relative ANY/A for each year of his career. For new readers, ANY/A stands for Adjusted Net Yards per Attempt, defined as

(Gross Pass Yards + 20 * PTDs – 45 * INTs – Sack Yds)/(Attempts + Sacks)

Relative ANY/A simply compares a quarterback’s ANY/A average to league average, a necessary element when comparing quarterbacks across eras. In the graph below, the size of the bubble corresponds to how many attempts Bradshaw had in each season, while the Y-Axis shows Bradshaw’s Relative ANY/A (by definition, 0 is equal to league average).  The graph shows a clear story: for the first five years of his career, Bradshaw was a below-average quarterback, but over the rest of his career, he was one of the best in football. His best year came in 1978 when Bradshaw finished with a RANY/A of +2.0, which was the third best mark in football (only a hair behind Roger Staubach and Dan Fouts). Those stats, combined with a 14-2 record, led to Bradshaw being named the AP’s MVP that season. [continue reading…]

{ 41 comments }

Was Smith's fast finish a sign of things to come?

Was Smith's fast finish a sign of things to come?

In Geno Smith’s first 12 NFL starts, he completed 179 of 327 passes (54.7%) for 2,256 yards, with 8 touchdowns and 19 interceptions. Those numbers translate to a 6.9 yards per attempt average, quite respectable for a rookie, and a 4.8 Adjusted Yards per Attempt average, abysmal for anybody. But over the last four weeks of the year, Smith went 68/116 (58.6%) for 790 yards with 4 touchdowns and 2 interceptions. His yards per attempt actually went down slightly to 6.8, but he averaged 6.7 AY/A, much closer to league average. Touchdowns and interceptions are less sticky statistics than yards per attempt, but Jets fans looking for reasons for optimism would cling to the massive flip in touchdown-to-interception ratio over the final quarter of the season.

The real question is whether any of that matters. In general, I’m a Splits Happen type of analyst, but I thought I would run some numbers. As it turns out, perhaps there is some reason to think Smith’s strong December (subject to the caveats below) is a sign of good things to come.  Here’s what I did:

From 1990 to 2013, there were 51 quarterbacks who threw at least 224 passes during their rookie season. Toss out the 2013 rookies (EJ Manuel, Smith, and Mike Glennon), along with the nine quarterbacks who threw fewer than 100 passes in year two (Jimmy Clausen, Ryan Leaf, Kyle Orton, Chad Hutchinson, Andrew Walter, Bruce Gradkowski, Chris Weinke, Ken Dorsey, and Matt Stafford), and that leaves us with 39 quarterbacks who threw at least 224 passes as a rookie since 1990 and then at least 100 passes in their second season. For those quarterbacks, I calculated their Y/A and AY/A averages over their final 4 games of the season, and their Y/A and AY/A averages over the first 1-12 games of the season (with the 224 pass attempts minimum, I felt pretty confident that we would have a large enough sample on the “early” portion of the season).  Then I looked at how those 39 quarterbacks fared in their second years.

The table below shows all 39 quarterbacks, plus the 2013 rookies.  Here’s how to read the table below.  Heath Shuler, a rookie for Washington in 1994, had 150 “early” season attempts, defined as all pass attempts before the final 4 games of the season.  His early year Y/A average was 5.0 and his AY/A average was 2.8.  Shuler had 115 “late” season attempts, defined as pass attempts in the final four games.  His Y/A in the late part of the season was 7.9, and his AY/A was 7.8.  As a result, Shuler improved his Y/A by 3.0 and his AY/A by 5.0 over the final four games of the season.  In Year N+1 — i.e., 1995 for Shuler — he had 125 pass attempts, and averaged 6.0 Y/A and 3.9 AY/A. [continue reading…]

{ 10 comments }

The Top Ten Free Agent Acquisitions of 2013

Mike Wallace did not prove to be a steal.

Mike Wallace did not prove to be a steal.

On March 11, the 2014 League Year — and the start of free agency — officially begins. But before we turn our attention to Michael Vick and Eric Decker and Greg Hardy and the free agent class of 2014, I thought it would useful to look back at last year’s free agency class.

If there’s one rule of free agency, it’s don’t get too excited: of the many men who signed with new teams a year ago, just three of them made the Pro Bowl in 2013. Just one of them was named a first-team All-Pro by the Associated Press. March optimism may be enticing, but it is usually misplaced. For example, I reviewed the top 20 free agents identified by Pro Football Talk at the start of free agency last year; thirteen of those players wound up switching teams in free agency, but few were impact players.

At wide receiver, Mike Wallace, Greg Jennings, and Danny Amendola all fell far short of expectations, and even Wes Welker produced a below-average stat line for by his standards. The Rams spent big money to acquire Jake Long and Jared Cook; while neither player was bad, the Rams offense was just as uninspiring in 2013 as it was before either of them arrived in St. Louis. Outside linebackers Paul Kruger and Connor Barwin were brought to Cleveland and Philadelphia to bring the heat, but the duo combined for just 9.5 sacks despite playing in 32 games. The big move in the secondary was Tampa Bay’s signing of Dashon Goldson; and while he provided an upgrade for the Bucs, it was not one commensurate with his contract.

On the positive side, cornerbacks Sean Smith and Dominique Rodgers-Cromartie played well enough in Kansas City and Denver.  Meanwhile, the two best signings may have Cliff Avril and Michael Bennett helped bring a championship to Seattle.  But in general, big free agent contracts don’t tend to live up to expectations, and last year was no exception.

[continue reading…]

{ 12 comments }
Previous Posts