by Chase Stuart
on March 11, 2014
During the 2013 offseason, I wrote 32 articles under the RPO 2013 tag. In my Predictions in Review series, I review those preview articles with the benefit of hindsight. Previously, I reviewed the AFC West, the NFC West, the the AFC South, and the NFC South. Today, the AFC North.
Marvin Lewis, Jim Mora, and the Playoffs, May 30, 2013
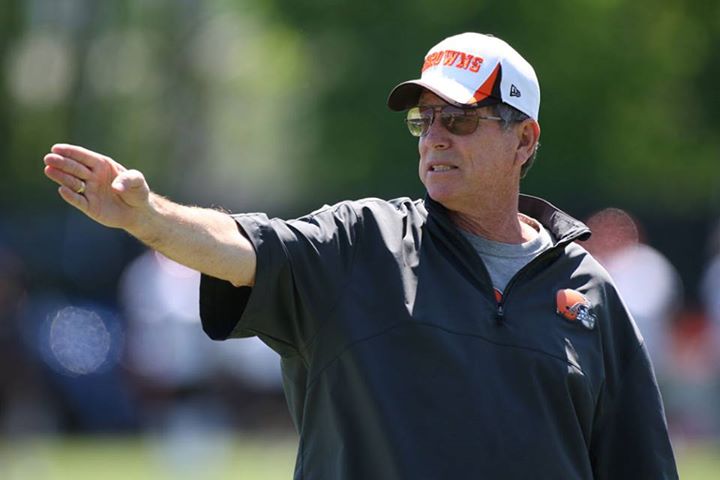
In this article, I noted that Marvin Lewis had coached the Bengals for ten seasons without recording a playoff victory. That was pretty unique: Since 1966, only Jim Mora had coached a team for longer without notching a playoff victory, and he was fired by the New Orleans Saints in his 11th year after a 2-6 start. Well, Lewis now stands alone in the Super Bowl era, as the only coach to fail to record a playoff win in 11 straight seasons and then be brought back for season twelve.
Since I wrote that article, though, I’ve become much more sympathetic to Lewis. For years, it was easy to take pot shots at his ridiculous use of challenges or his failure to be aggressive when the situation warranted it, but I now think Lewis is one of the better coaches in the league. He seems to have a knack for connecting with his players, he’s surrounded himself with very good coaches, and you get the sense that he has more on his plate organizationally than the typical head coach. He’s the de facto GM, unless you consider Mike Brown the real man building the franchise. And he’s developed one of the most talented rosters in the league, even if Andy Dalton turns into a pumpkin every January.
Of course, that is just cold comfort to Bengals fans who have witnessed the team go 0-11 in the Lewis era when it comes to recording a playoff victory. On the other hand, Cincinnati didn’t win a playoff game in any of the 12 seasons immediately preceding the Lewis hire, either. But Lewis’ streak is particularly notable for just how rare his tenure has been in today’s environment. [continue reading…]
Tagged as:
Ben Roethlisberger,
Bengals,
Browns,
Josh Gordon,
Marvin Lewis,
Norv Turner,
Predictions In Review 2013,
Ravens,
Steelers
{ }
by Chase Stuart
on May 31, 2013
Turner describing a route. I think.
With
Norv Turner, you know what
you’re going to get. Turner was fired in San Diego after the Chargers failed to make the playoffs in each of the last three years, but as usual, Turner was able to find a nice landing spot. He’ll be the Browns offensive coordinator in 2013, which will mark his 29th straight year in the NFL. Turner started as a receivers coach with the Rams in 1985 and hasn’t been out of work for very long ever since.
And while he has a reputation for having great running games, he also has habit of sending his receivers down the field. That’s no accident. Ernie Zampese, a longtime assistant under Don Coryell, became the Rams offensive coordinator in 1987, and Turner’s teams have been running a variation of the vertical Coryell/Zampese system ever since.
I ranked all players (minimum 500 receiving yards) in yards per reception in each year since Turner was united with Zampese in ’87. In six of those seasons, one of five different Turner receivers led the NFL in yards per reception. In addition, Turner’s top receiver (in terms of YPR) finished in the top five in that metric thirteen more times. The table below shows the rank of the highest-ranked receiver (in terms of YPR) in Turner’s offense in each of the last 26 years.
[continue reading…]
Tagged as:
Browns,
Josh Gordon,
Norv Turner,
RPO 2013
{ }
by Chase Stuart
on October 29, 2012
For years, I was an unabashed Philip Rivers supporter. I had no preexisting affinity for the Chargers or Rivers, but in all the metrics I care about, Rivers was always one of the best. In 2008, 2009, and 2010, Philip Rivers led the league in yards per attempt. He finished first in ANY/A in ’08 and second in ’09 and ’10; he finished second in NY/A in ’08 and then first in NY/A in 2009 and 2010. Simply put, going into the 2011 season, no quarterback had been better over the last three years.
| Rank |
Player |
Tm |
Gms |
Cmp |
Att |
Cmp% |
Yds |
TD |
Int |
Rate |
Sk |
Y/A |
SkYds |
AY/A |
ANY/A |
Y/G |
| 1 |
Philip Rivers |
SDG |
48 |
986 |
1505 |
65.5% |
12973 |
92 |
33 |
103.8 |
88 |
8.62 |
545 |
8.86 |
8.02 |
270.3 |
| 2 |
Tom Brady |
NWE |
33 |
702 |
1068 |
65.7% |
8374 |
64 |
17 |
102.9 |
41 |
7.84 |
261 |
8.32 |
7.78 |
253.8 |
| 3 |
Drew Brees |
NOR |
47 |
1224 |
1807 |
67.7% |
14077 |
101 |
50 |
98.1 |
58 |
7.79 |
412 |
7.66 |
7.20 |
299.5 |
| 4 |
Aaron Rodgers |
GNB |
47 |
1003 |
1552 |
64.6% |
12394 |
86 |
31 |
99.4 |
115 |
7.99 |
730 |
8.20 |
7.19 |
263.7 |
| 5 |
Tony Romo |
DAL |
35 |
771 |
1213 |
63.6% |
9536 |
63 |
30 |
94.8 |
61 |
7.86 |
360 |
7.79 |
7.13 |
272.5 |
| 6 |
Matt Schaub |
HTX |
43 |
1012 |
1537 |
65.8% |
12183 |
68 |
37 |
94.7 |
80 |
7.93 |
524 |
7.73 |
7.02 |
283.3 |
| 7 |
Peyton Manning |
CLT |
48 |
1214 |
1805 |
67.3% |
13202 |
93 |
45 |
95.4 |
40 |
7.31 |
251 |
7.22 |
6.93 |
275.0 |
| 8 |
Kurt Warner |
CRD |
31 |
740 |
1111 |
66.6% |
8336 |
56 |
28 |
95.2 |
50 |
7.50 |
354 |
7.38 |
6.75 |
268.9 |
| 9 |
Ben Roethlisberger |
PIT |
43 |
858 |
1364 |
62.9% |
10829 |
60 |
32 |
92.5 |
128 |
7.94 |
852 |
7.76 |
6.53 |
251.8 |
| 10 |
Eli Manning |
NYG |
48 |
945 |
1527 |
61.9% |
11261 |
79 |
49 |
88.3 |
73 |
7.37 |
507 |
6.97 |
6.33 |
234.6 |
| 11 |
Donovan McNabb |
TOT |
43 |
887 |
1486 |
59.7% |
10846 |
59 |
36 |
85.4 |
95 |
7.30 |
684 |
7.00 |
6.15 |
252.2 |
| 12 |
Matt Ryan |
ATL |
46 |
885 |
1456 |
60.8% |
10061 |
66 |
34 |
86.9 |
59 |
6.91 |
354 |
6.77 |
6.27 |
218.7 |
| 13 |
Kyle Orton |
TOT |
43 |
901 |
1504 |
59.9% |
10427 |
59 |
33 |
84.8 |
90 |
6.93 |
562 |
6.73 |
6.00 |
237.0 |
| 14 |
Joe Flacco |
RAV |
48 |
878 |
1416 |
62.0% |
10206 |
60 |
34 |
87.9 |
108 |
7.21 |
788 |
6.97 |
5.96 |
212.6 |
| 15 |
Brett Favre |
TOT |
45 |
923 |
1411 |
65.4% |
10183 |
66 |
48 |
88.1 |
86 |
7.22 |
599 |
6.62 |
5.84 |
226.3 |
| 16 |
Jay Cutler |
TOT |
47 |
981 |
1603 |
61.2% |
11466 |
75 |
60 |
82.9 |
98 |
7.15 |
625 |
6.40 |
5.67 |
244.0 |
| 17 |
Matt Cassel |
TOT |
45 |
860 |
1459 |
58.9% |
9733 |
64 |
34 |
83.9 |
115 |
6.67 |
644 |
6.50 |
5.62 |
211.6 |
| 18 |
David Garrard |
JAX |
46 |
885 |
1417 |
62.5% |
9951 |
53 |
38 |
84.7 |
117 |
7.02 |
777 |
6.56 |
5.56 |
216.3 |
| 19 |
Jason Campbell |
TOT |
44 |
836 |
1342 |
62.3% |
9250 |
46 |
29 |
85.1 |
114 |
6.89 |
759 |
6.61 |
5.57 |
205.6 |
| 20 |
Carson Palmer |
CIN |
36 |
719 |
1181 |
60.9% |
7795 |
50 |
37 |
81.4 |
63 |
6.60 |
481 |
6.04 |
5.34 |
216.5 |
| 21 |
Ryan Fitzpatrick |
TOT |
33 |
603 |
1040 |
58.0% |
6327 |
40 |
34 |
74.9 |
83 |
6.08 |
465 |
5.38 |
4.57 |
175.8 |
| 22 |
Matt Hasselbeck |
SEA |
35 |
668 |
1141 |
58.5% |
7246 |
34 |
44 |
71.2 |
80 |
6.35 |
503 |
5.21 |
4.46 |
207.0 |
[continue reading…]
Tagged as:
Chargers,
Norv Turner,
Offensive Line,
Philip Rivers
{ }
by Chase Stuart
on June 26, 2012

Now just hold on. I never said you are what your record in close games says you are.
Which coaches have the best records in close games? That’s a complicated question that either means everything or nothing, depending on whom you ask. But putting aside what it means, what are the actual results?
I defined a close game as one where a team was trailing or leading by three points entering the 4th quarter since 1940.
The table below shows the coaching records in close games for all coaches who were head coaches in at least 20 close games. You can use the search box below to search for any individual coach. Note that coaches who coached prior to 1940 are included, but only their performances in games beginning in 1940 are listed below.
[continue reading…]
Tagged as:
Bill Belichick,
Bill Parcells,
Norv Turner,
Vince Lombardi
{ }