≡ Menu

Do Championships Matter?

Adam Steele comes to us today with a philosophical question regarding the nature of fandom. We thank him for it.


After a weekend in which all four games were coin flips decided on the final play, I started thinking about how much the results actually matter to fans in the long run. We’ve had the primacy of titles drilled into our heads throughout our lives – hoisting the Lombardi trophy is why you play the game, there’s only one winner and 31 losers, etc. And sure, in the most literal sense, attempting to win a championship is the reason we hold a season every year.

But how much do championships really matter to fans? My sense is that they matter far less than you’d initially think. If you ask a group of fans to name their most cherished football memories, a majority of their answers will probably not be related to winning it all.

Think about all the amazing player seasons throughout football history. The vast majority of them did not result in a ring. Did fans of Randy Moss, Barry Sanders, Dan Marino, or J.J. Watt enjoy their heroes less because they don’t have the jewelry? Doubtful. It’s more likely that fans will wax poetic about how they got to watch these legends play.

In many cases, even average players and coaches on perennially losing franchises become local heroes in their communities. Fans fall in love with players they feel a connection with irrespective of the number of titles those athletes bring home. This is why long suffering fanbases of ringless teams often have the most loyal and devoted followers; it’s more about the journey than the destination.

Quantifying Fan Priorities

There’s actually pretty strong empirical evidence that championships are not the most important thing to fans. From 2003-2016, ESPN ran a series called Ultimate Standings (insert hyperlink ESPN The Magazine’s 2016 Ultimate Standings). They surveyed fans across all four major North American sports to come up with a formula for determining which teams reward their fans the most. The responses were whittled down into seven broad categories, weighted by importance:

Fan relations – 27%
Money spent per win – 27%
Players – 15%
Ownership – 13%
Stadium experience – 12%
Championships – 4%
Coaching – 3%

Well look at that! Championships are way down the list of things that fans consider important. Teams that make a genuine effort to connect to their communities engender loyal fans regardless of on-field results. Regular season wins matter but only if fans aren’t being gouged in the process; less frequent winning is acceptable if being a diehard fan is affordable for the average Joe. Players are judged by their effort and likability more than their performance. Having a solid ownership situation and a fun stadium to attend are also several times more important than past or potential championships.

Does this post resonate with you? What are your favorite memories as a sports fan? Would you trade those memories for a championship? Let me know in the comments.

{ 0 comments }

Fast and Faster

Fast and Faster.

The number one storyline in the NFL in week one isn’t the health of Robert Griffin III, but the presence of two other men occupying FedEx Field that night. The football world is anxiously awaiting to see how Chip Kelly’s offense, piloted by Michael Vick, will work in the NFL. We don’t know much, but we do know that the coach plans to incorporate the fast-paced, up-tempo style that his teams used at Oregon to obliterate opponents.

In May, I took a stab at discussing tempo in the NFL, and I presented a couple of lists that measured the number of plays run per second of possession in the NFL. Today, I want to revisit the questions of tempo and pace using more precise measurements.  Let’s start with some league-wide data. The table below shows the average number of seconds between snaps for NFL teams last season. I’ve excluded a number of plays from this sample, including all plays at the start of a quarter, all overtime plays, plays after a changes of possession, and plays in the final three minutes of the first half or five minutes of the second half (where teams are less likely to operate at their normal pace).

secs btw plays
[continue reading…]

{ 8 comments }

Will the read option come to Oakland?

Will the read option come to Oakland?

The 2012 Raiders weren’t very good. Oakland finished last season 4-12, with the third-worst SRS rating (-10.8) in the NFL. And the outlook isn’t any better for 2013, either. Oakland has fifty million dollars of dead cap space; as a result, the players on the current roster cost the team only 67 million salary cap dollars, nearly $30M less than the next-lowest team. According to Pro Football Focus, Oakland’s five best defensive players last season were Lamarr Houston, Desmond Bryant, Philip Wheeler, Richard Seymour, and Rolando McClain. Only Houston returns in 2013, as Bryant is in Cleveland, Wheeler signed with the Dolphins, Seymour remains a free agent, and McClain has gracefully retired.

The team’s top two offensive players in 2012 were left tackle Jared Veldheer and quarterback Carson Palmer. Palmer is now in Arizona, while Veldheer is out indefinitely with a torn triceps. Brandon Myers (Giants) and Darrius Heyward-Bey (Colts) are also gone, and they combined for 29 starts last season. The big free agent signings were S Charles Woodson (Green Bay), LB Kevin Burnett (Miami), QB Matt Flynn (Seattle), CB Mike Jenkins (Dallas), CB Tracy Porter (Denver).

As a result, there’s little optimism in Oakland entering the season. The Raiders are one of the favorites to land the first pick in the 2014 draft, so the 2013 season will likely be used to see what building blocks actually exist in Oakland. After Terrelle Pryor outplayed Flynn in the preseason, many now think the Raiders going to start Pryor in week 1 because, well, why not? If that’s the case, we’ll have another example to test out a theory that’s widely-accepted by conventional analysts.
[continue reading…]

{ 5 comments }

Leader in Fu Manchus among active quarterbacks (sorry, Mark)

Leader in Fu Manchus among active quarterbacks (sorry, Mark).

Let’s be honest: we all know Aaron Rodgers is great, so we don’t spend much time talking about him. Debating his ability is pointless, so we instead spend countless hours discussing Tony Romo’s intangibles, Tim Tebow’s throwing motion, Colin Kaepernick’s tattoos, and Joe Flacco’s eliteness. Talk radio dies when it discusses Aaron Rodgers: debating the Packers quarterback is as fun as watching paint dry and as illuminating as asking if water is wet.

But we’re doing a disservice to us all when we ignore how great Rodgers is. I mean, we spend lots of time chronicling the feats of Adrian Peterson and Calvin Johnson — why not Rodgers?

One way to measure Rodgers’ greatness is to look at passer rating. Now we know that passer rating is wildly overrated, so perhaps you shouldn’t be too impressed to hear that Rodgers has the highest passer rating in history. But consider: Rodgers has a career 104.9 passer rating, well ahead of Steve Young, who is second at 96.8. Chad Pennington sits at #13 on the career passer rating list (an example of why this metric is one I don’t use), but Young is closer to Pennington (90.1) than he is to Rodgers. But there’s an even better way to show Rodgers’ dominance in this statistic.

Passer rating is made up of four metrics. Let’s take a look at how Rodgers ranks in those four categories:
[continue reading…]

{ 40 comments }

Mike  Wallace dropped Pittsburgh for Miami.

Mike Wallace dropped Pittsburgh for Miami.

In March, Miami signed deep threat extraordinaire Mike Wallace from Pittsburgh. Also this offseason: general manager Jeff Ireland allowed left tackle Jake Long to leave and sign with the Rams, and the Dolphins have filled his position by moving right tackle Jonathan Martin to the blind side.

Much has been made of Martin’s inability to handle that role. Leading up to the 2012 draft, much was made of how Martin only projected as a right tackle in the pros, even though (or perhaps because of what evaluators saw when) Martin played on the left side at Stanford with Andrew Luck. Miami played Martin on the right side of the line for the first eleven games of the season last year, but switched him to the blind side after Long suffered a season-ending injury. Pro Football Focus graded Martin as a terrible pass blocker in his rookie season, and he was even worse in the five starts he made at left tackle: In those games, he allowed an incredible 17 hurries, two hits, and two sacks.

I thought it might be interesting to run some tests on left tackles, building off a study that Jason Lisk ran on offensive linemen:

To do this, I looked at all offensive linemen since 1978 who made at least 1 pro bowl and started 80 or more games in their careers, and then found any season in which that player played in fewer than 10 games before age 34, after starting more than that amount the previous year at the same position. I then compared the team performance in things like points, yards per attempt, sack rate, and rushing yards per carry. As it turns out, we don’t have very many cases that allow us to look at this (19 players). If I had reliable game by game data for offensive linemen participation, I could broaden the study, but for now, I can’t tell which games a lineman missed, like I can with a quarterback or running back. My goal in setting this up the way I did was to find pretty good tackles and try to see if there were any differences the following year when they missed a large chunk of the season.

Our 19 offensive tackles averaged 15.1 games the year before the injury, and only 6.3 games played during the injury season. That’s a difference of 8.8 games played, or over half a season.

In his conclusion, Lisk noted that “The likely effect on a per game basis when playing versus when out with an injury was somewhere between 0.7 to 0.8 Net Yards per Attempt dropoff.” Well, what if we run the same study but (1) limit ourselves to left tackles [1]I changed the cutoffs to 14 starts in Year N and fewer than 9 starts in Year N+1 and (2) look at the yards-per-reception average of the team’s leading receiver? There are only 12 situations to examine, a sample size far too small to really use, but here are the results:

[continue reading…]

References

References
1 I changed the cutoffs to 14 starts in Year N and fewer than 9 starts in Year N+1
{ 3 comments }

Roethlisberger will be without his best targets this year.

Roethlisberger will be without his best targets this year.

While the state of the Steelers’ receiving corps isn’t as shaky as say, that of the New England Patriots, it could certainly be called an area of potential concern for Ben Roethlisberger and the Pittsburgh offense going into 2013. One of the biggest moves on the first day of free agency involved Mike Wallace departing for Miami; meanwhile, Heath Miller’s injury status — while more encouraging than previously thought — will cost him several games, and probably some effectiveness when he does eventually return. All of this comes on the heels of losing stealth HoFer Hines Ward (albeit an older, drastically less effective version) to retirement after the 2011 season.

For Roethlisberger, this downturn in the quality of his receivers is a pretty new phenomenon. In fact, by one measure of career receiving-corps talent (which I’ll explain below), Big Ben has been blessed with the fourth-most gifted receiving group among current starting quarterbacks with more than two years of experience (behind only Peyton Manning, Matt Ryan, and Tony Romo). In fact, Roethlisberger’s 16th-ranked receiving corps in 2012 was by far the least talented group of pass catchers he’s ever had to throw to.

How do you begin to measure the quality of a quarterback’s receiving corps, you ask? Well, pretty much any method is going to fraught with circular logic, especially if a quarterback consistently has the same receivers over several years. His successes are theirs, and vice-versa. However, here’s one stab at shedding at least some light on the issue.

For each team since the NFL-AFL merger, I:

  • Gathered all players with at least 1 catch for the team in the season.
  • Computed their True Receiving Yards in that season; I then determined what percentage of the team’s True Receiving Yards was accumulated by which receiver in each year. For example, Hines Ward had 1,029 TRY in 2009, which represented 25.9% of the 3,979 True Receiving Yards accumulated by all Steelers that year
  • Figured out the most TRY they ever had in a season, a number I’m calling each player’s peak TRY; for Ward, his peak TRY is equal to 1,279.
  • Calculated a weighted average (based on the percentage of team TRY gained by each receiver) of the receivers’ peak TRY (weighted by their TRY during the season in question).

(I also threw out all teams that had a receiver who debuted before 1970, since I don’t know what the real peak TRY of any pre-merger receiver was. I should eventually calculate TRY for pre-merger seasons, of course — thank you Chase & Don Maynard.)

As an example, here are the 2009 Steelers, the most talented corps of receivers Roethlisberger has had in his career:
[continue reading…]

{ 4 comments }

Projecting the 2013 Jets

Let’s start with a picture showing just how ugly the Jets passing game has been over the last four years. The chart below displays where New York has ranked in Net Yards per Attempt, Adjusted Net Yards per Attempt, passer rating, Football Outsiders DVOA, and ANS’s Pass EPA/Play in each season starting in 2009. The black line shows an average of the team’s ranks in those five metrics. On the left, is the team’s rank from 1 to 32.

Jets passing

There are a few things that should be pretty obvious: all data points reside in the bottom half of the picture. New York ranked 18th in passer rating in 2011, its highest ranking in any of the five passing measures over the last four years. The Jets passing game was bad last year and looks to be bad this year, but we’re only talking about measures of degrees. The 11-5 Jets in 2010 ranked 20th in ANY/A and made it to the AFC Championship Game. In Mark Sanchez’s rookie year, the Jets ranked 27th in ANY/A and were leading the Colts at halftime of the AFCCG in Indianapolis.

One interpretation is that Sanchez was steadily improving, as he made gains in most metrics in both 2010 and 2011. I don’t think that’s the correct interpretation, however. Yes, the Jets ranked 18th in passer rating and in the top 20 other three other categories, but the real story is that New York only finished 25th in NY/A. The discrepancy between the statistics is the result of a fluke season with respect to passing touchdowns, which are ignored in NY/A but a part of passer rating, ANY/A, DVOA, and EPA. The Jets ranked 2nd in red zone scoring percentage in 2011, but ranked 17th (2009), 28th (2010), and 25th (2012) in that metric the other three years. Sanchez threw 14 touchdowns from inside the ten-yard line that year, more than double his performance in any other season. Some credited his red zone performance in 2011 to offensive guru Tom Moore’s tenure with the team that year, others believed it was due to the addition of Plaxico Burress, while still more thought it was a sign of Sanchez’ improvement as a passer. In retrospect, I think we can chalk most of that up red zone success up to good old fashioned luck and small sample size.
[continue reading…]

{ 3 comments }

Can Ware excel as a defensive end?

Can Ware excel as a defensive end?

Depending on whom you ask, Tom Landry either revolutionized or invented the 4-3 front. When he became head coach of the expansion Cowboys, Landry’s teams always fielded four down linemen. And by the time he was forced out, the 3-4 fad that dominated the ’80s had subsided, resulting in Dallas running a 4-3 front every season from 1960 to 2004.

In 2005, several key changes happened in Dallas. Bill Parcells was hired as head coach in ’03, but he didn’t implement a scheme shift right way. After Dallas ranked 27th in points allowed in ’04, though, changes were necessary. With two first round picks, the Cowboys selected 3-4 outside linebacker DeMarcus Ware and 3-4 defensive end Marcus Spears. Dallas also signed Jason Ferguson, who had played nose tackle for Parcells with the Jets. With the pieces in place, Dallas ran a 3-4 defense each of the last eight seasons. Ware has become one of, if not the, greatest 3-4 outside linebackers of all time. But after eight years of Parcells, Wade Phillips, and Rob Ryan, Dallas is returning to its 4-3 roots under Monte Kiffin.

Kiffin, of course, is most famous for the outstanding defenses that he and Tony Dungy created in Tampa Bay; the Tampa-2, after all, has became part of football nomenclature. But I don’t want to go into whether the Cowboys are well-positioned to switch fronts (they’re not) or who will play what role in 2013 (Ware and Anthony Spencer are moving to defensive end, Jay Ratliff will move from NT to DT, and newly rich Sean Lee will play as a true middle linebacker, and he might be even more valuable in this system). Instead, I want to take a 30,000 foot view.

In 1974, the 3-4 defense was introduced to the NFL by Bum Phillips in Houston, Lou Saban in Buffalo, and Chuck Fairbanks and Hank Bullough in New England. I thought it would be interesting to see how teams that switched fronts fared in their first season. On caveat: I wanted to exclude schizophrenic teams like the current Bills (4-3 defense in 2009, 3-4 in 2010, 4-3 in 2011 and 2012, and now a 3-4 again in 2013).  According to my records, 74 teams in NFL history have switched from a 4-3 to a 3-4, or vice versa, after running the same front for the three prior years.
[continue reading…]

{ 6 comments }

The new face of the Ravens

The new face of the Ravens.

No team has won back-to-back Super Bowls since the 20032004 Patriots, which means the last eight champions have failed in their bid to repeat. Three of them — the ’06 and ’09 Steelers and the 2012 Giants — failed to even make the playoffs. Some writers have used this as a reason to suggest that Baltimore may be subject to a Super Bowl curse.

Of course, the idea of a curse — or a sample of data — doesn’t mean much in the abstract. Let’s look at some numbers on the 42 Super Bowl winners between 1970 and 2011. On average, those teams had a 0.676 winning percentage in Year N+1 (i.e., the year after they won the Super Bowl). Thirty of those teams made it back to the playoffs, one out of every six of those teams won the Super Bowl, and three more lost in the Super Bowl (the ’78 Cowboys, ’83 Redskins, and ’97 Packers). Some would use this as evidence of a curse — i.e., only 9 of 42 teams made it back to the Super Bowl — but again, we need some context.

I decided to compare Super Bowl winners since 1970 to three other teams: Super Bowl losers, the Simple Rating System champion from that season (which may or may not be a team that made it to the Super Bowl), and an average of all playoff teams from that year. On average, Super Bowl winners have the best winning percentage of that group in the following year. And Super Bowl winners are the most likely to win the Super Bowl. Super Bowl winners are less likely to lose in the Super Bowl the next season than the Super Bowl loser (thanks, Buffalo) or the SRS champ, but the defending champion is still the team most likely to make it back to the Super Bowl. The two Super Bowl teams and the SRS champ also make the playoffs the following season just north of 70%, well ahead of the average playoff team.

The chart below shows all of these results, which makes it pretty clear that being the defending Super Bowl champion is a good thing for future prospects (and it’s not too shabby on a resume, either):
[continue reading…]

{ 9 comments }

For sportswriters, Freeman is writer's block antidote.

I was not a big fan of Josh Freeman as a prospect — he was a mediocre college quarterback — but I think he can be a very good NFL quarterback. I wrote six paragraphs explaining why I liked Freeman in March, and nothing has changed since then. In the past few weeks, friends-of-the-program Bill Barnwell, Mike Tanier, and Danny Tuccitto have all weighed in on Freeman’s up-and-down 2012 campaign. Doug Farrar, with the help Joe Bussell (@NFLosophy), an Operations Assistant and Coordinator with the Bucs from July 2009 through January 2012, provided another interesting take on the Tampa Bay quarterback last week.

Much has been said about Freeman, so I think we’re officially at the “wait and see” point in the game. This may be the year he quiets all the doubters, or 2013 could be another setback season (see 2011). But here’s one thing we do know: in a division with Drew Brees, Matt Ryan, and Cam Newton, Freeman is widely considered the worst starting quarterback in the NFC South. Freeman ranked 16th in Adjusted Net Yards per Attempt last year, but that was still behind Brees (6th), Ryan (7th), and Newton (11th, which ignores the 741 rushing yards and 8 touchdowns he provided on the ground).

For the sake of argument, let’s say that Freeman is again the least valuable quarterback in the NFC South. What does that mean for Tampa Bay’s odds of winning the division? The Bucs had the league’s top rush defense in 2012, and traded for Darrelle Revis, signed Dashon Goldson, and drafted Mississippi State cornerback Johnthan Banks in the offseason. With Doug Martin and the return of guards Davin Joseph and Carl Nicks, the running game should be among the league’s best. You could argue that Tampa Bay could win the division without any improvement from Freeman, if the rest of the team is productive enough.

That made me wonder: how often does the team that ranked last in the division in Adjusted Net Yards per Attempt end up winning its division? As it turns out, pretty infrequently. Since 1950, only nine teams have pulled off that feat, with nearly half of them coming since the league moved to a four-teams-per-division-for-each-division format in 2002.
[continue reading…]

{ 4 comments }

Foster is thankful for a heavy workload.

Foster is thankful for a heavy workload.

Running back workload is a very difficult topic to tackle, and I don’t expect to make much of an indent into the subject today. But I do want to take a few minutes and look at some ways to measure heavy workloads. One school of thought is that the effect of carries is cumulative: Not only is a 25-carry game more likely to cause a running back trouble than a five-carry game, but it’s more than five times as likely to shorten a player’s shelf life. The cumulative effect of taking hit after hit means that carries 16, 17, and 18 hurt a runner more than carries 1, 2, and 3.

I don’t know if that’s true, but let’s investigate. First, I’m only giving a running back credit for his additional carries after his 15th carry of the game. So an 18-carry game goes down as a “3” and a 25 carry game is a “10.” Using this scoring system, Arian Foster had the highest number of “Carries over 15” from last season, with 117. Such a list mostly corresponds to the number of overall rushing attempts for a player, but the exceptions could be revealing.
[continue reading…]

{ 4 comments }

Since Sam Bradford was drafted by the Rams in 2010, the only consistent force in St. Louis has been change. Tackle Rodger Saffold, drafted in the second round of the same draft, is the only other player on the 2010 Rams offense who is still on the team. Bradford has already played under three offensive coordinators (Pat Shurmur as a rookie, Josh McDaniels in 2011, and Brian Schottenheimer last year), which means this is the first time in four years he isn’t learning a new system. And while his rookie season was always overrated, his performance last year was better than you think. After adjusting for one of the league’s toughest schedules, Bradford ranked 18th in Adjusted Net Yards per Attempt, despite being saddled with an inferior set of receivers.

How inferior? The table below shows the top six leaders in receiving yards for St. Louis last season:

Games Receiving
Rk Player Year Age Tm G GS Rec Yds Y/R TD Y/G
1 Chris Givens 2012 23 STL 15 12 42 698 16.62 3 46.5
2 Brandon Gibson 2012 25 STL 16 13 51 691 13.55 5 43.2
3 Danny Amendola 2012 27 STL 11 8 63 666 10.57 3 60.5
4 Lance Kendricks 2012 24 STL 16 14 42 519 12.36 4 32.4
5 Steven Jackson 2012 29 STL 16 15 38 321 8.45 0 20.1
6 Austin Pettis 2012 24 STL 14 2 30 261 8.70 4 18.6

Chances are, unless you’re a Rams fan or play fantasy football, you’ve never even heard of four of those names.  And while Amendola was productive when healthy, he missed five games last year (and it’s worth noting that Bradford’s numbers weren’t worse without Amendola in the lineup). Steven Jackson is of course a great player, but there’s only so much help a 29-year-old running back who catches 38 passes can provide to an ailing passing game.
[continue reading…]

{ 5 comments }

The Steve Smith Post

Smith has excelled despite playing for a ground-based attack

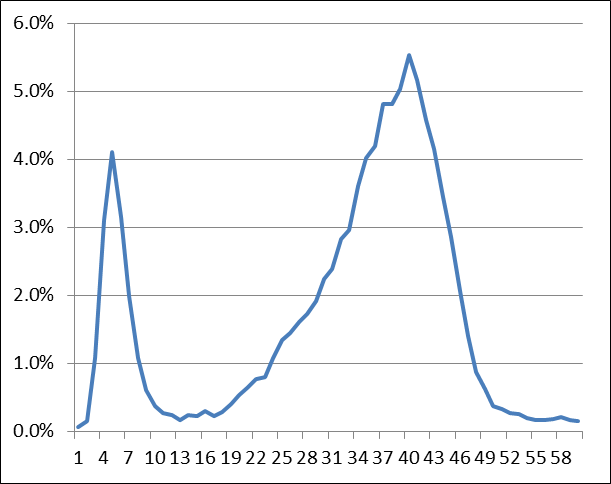
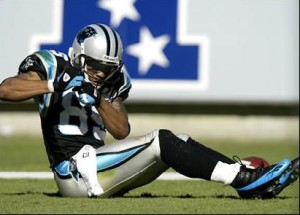
Smith has excelled despite playing for a ground-based attack.

Over the last decade, Carolina’s Steve Smith has been one of the best receivers in the NFL. He’s also been the most under-appreciated. Let’s stroll down memory lane:

  • As a rookie, Smith was a first-team All-Pro returner but caught only ten passes. In his second year, he caught 54 passes for 872 yards and three touchdowns, and bumped those numbers to 88-1,110-7 in 2003. That season, the Panthers made it to the Super Bowl, with Smith as their number one receiving weapon. He caught 18 passes for 404 yards and 3 touchdowns (including one walk-off touchdown) in four playoff games, a 101 yard/game average that would be a sign of things to come. Smith’s fourth season ended in week one, when a tackle by Packers linebacker Hannibal Navies resulted in a broken leg.
  • In 2005, Smith had one of the greatest receiving seasons in history. He led the NFL in receptions, receiving yards, and receiving touchdowns: since 1970, Smith, Sterling Sharpe (1992), and Jerry Rice (1990) are the only players to win the receiving triple crown. [1]Pre-merger list: Lance Alworth (1966), Dave Parks (1965), Johnny Morris (1964), Raymond Berry (1959, 1960), Pete Pihos (1953), Elroy Hirsch (1951), Don Hutson (1936, 1941 through 1944), and … Continue reading I ranked Smith’s 2005 as the 12th best regular season by a wide receiver since 1932, and then Smith added 335 receiving yards, 38 rushing yards and five total touchdowns (including a punt return) in three playoff games.
  • In 2006, Smith missed two games early in the season, and Jake Delhomme missed three games late. The backup quarterback was Chris Weinke. How bad was Chris Weinke? Two years before the Wildcat faze landed in South Beach, the Panthers had DeAngelo Williams taking direct snaps in this game against the Falcons (Carolina completed four passes) instead of having Weinke behind center. In the 11 Smith/Delhomme games, Smith totaled 73 receptions for 1,043 yards and 8 TDs, and also rushed for sixty-one yards and a score. That’s over 100 yards from scrimmage and nearly a touchdown a game, slightly better numbers than he produced during his scorched-earth 2005 campaign.
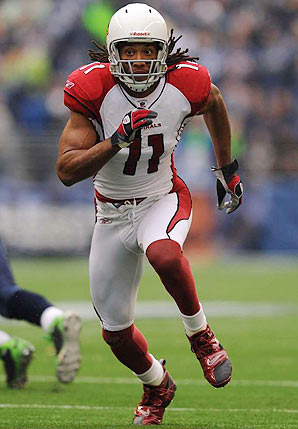
  • In 2007, 44-year-old Vinny Testaverde, David Carr, and 23-year-old Matt Moore started 13 games for Carolina after Jake Delhomme suffered a season-ending elbow injury in week three. Smith still caught 87 passes for 1,002 yards and 7 scores (four in the first two weeks before Delhomme was hurt), and rushed for sixty-six yards. Many give Larry Fitzgerald a pass for poor quarterback play, but Smith deserves extra credit for catching 87 passes when Carolina finished 28th in passing yards and 30th in Net Yards per Attempt. Drew Carter (517 receiving yards), Jeff King (406), Keary Colbert (332) were the only other receivers of note for the ’07 Panthers, which meant all eyes were always on Smith. Perhaps a better measure of Smith’s performance that year: he was responsible for 30.5% of all Panthers receptions in 2007, second in the league only to the first edition of Jay Cutler loves Brandon Marshall (31.3%).
  • In 2008, Delhomme was back, although Smith was suspended for the first two games of the season. But his fourteen game stat line was typical Smith: 78 catches, 1,421 yards, and 6 touchdowns. His 101.5 receiving yards per game average was a league and personal best. But wait: the 2008 Panthers finished 32nd in the league in pass attempts that year. Think for a second how crazy it is to lead the league in receiving yards per game on the least-pass happy team in the NFL. The Seahawks (last year’s cellar dweller in pass attempts), even with Russell Wilson, didn’t produce an 800-yard receiver last year. In terms of receiving yards per team pass attempt, Smith’s 2005 season was the best in modern history, with Smith’s 2008 season as the second best. In the 14 games in which Smith played in 2008, the Panthers passed only 352 times, meaning Smith averaged an absurd 4.04 yards per team pass attempt.

Let’s take a step back now. From 2005 to 2008, Smith played in 48 games (including playoffs) with Delhomme as quarterback, the equivalent of three full seasons. He caught 299 passes for 4,686 yards, averaged 101.3 yards per game from scrimmage, and scored 38 touchdowns. In other words, when not playing with quarterbacks so bad that they make Jake Delhomme look like Joe Montana, Smith was producing average numbers that would be career highs for just about every receiver not named Jerry Rice. And he did it on a run-first team.

But in the team’s postseason game against the Cardinals, the clock struck midnight on Jake Delhomme’s career: the Panthers quarterback went 17/34 for 205 yards with five interceptions, and then threw 8 touchdowns against 18 interceptions in 11 starts in 2009. Delhomme ranked 31st in passer rating and ANY/A that season, ahead of only JaMarcus Russell on both counts. Smith’s production suffered — 65-982-7 — but that falls on the quarterback. Smith sat out the meaningless 2009 finale, but in the final four games of the season — with Matt Moore starting — he caught 19 passes for 378 yards and three touchdowns.

Yet things went from bad to worse for Smith. In 2010, Moore and Jimmy Clausen combined to produce some of the worst quarterbacking in NFL history. Carolina finished the season 2-14, with just 2,289 passing yards, and a pitiful 2.9 ANY/A average. As a point of reference, the 2012 Cardinals threw for 3,005 yards and averaged 3.4 ANY/A. [2]The 2010 Cardinals, who finished 31st in passing yards and 31st in ANY/A, were at 2,921 yards and 3.7 ANY/A. A 31-year-old Smith had a miserable 46-catch, 554-yard, 2-touchdown season in 14 games, but if any season deserves a pass, it’s that one.

Most thought that after 2010, Smith was washed up. Instead, he experienced a career revival after the team drafted Cam Newton. In 2011, Smith ranked 5th in the NFL in receiving yards with 1,394, even though Carolina team ranked 23rd in pass attempts. The Panthers threw even less frequently last year, but Smith still picked up 1,174 receiving yards at the age of thirty-three (and he ranked 8th in yards per team pass attempt).

Summary

Smith lost prime seasons at age 25 (broken leg), 30 (Delhomme PTSD), and 31 (Clausen/Moore dumpster fire). At age 24, he had a breakout season punctuated by an outstanding postseason. Then, from ages 26 to 29, he was historically excellent whenever he and a halfway respectable quarterback shared the field. At ages 32 and 33, he’s been very productive on run-heavy teams: only Jerry Rice and Don Maynard have gained more receiving yards at those ages than Smith.

Smith, like Jimmy Smith, may never make the Hall of Fame. But for a very long stretch he was one of the best players in the game, and only bad luck prevented him from having a more remarkable career. When Ronde Barber said that Smith — and not Rice, or Randy Moss, or Calvin Johnson — was the toughest receiver he ever faced, I wasn’t surprised. Smith, in a bigger market and with even halfway decent quarterback play (not to mention being hampered by FoxBall), would be a Hall of Fame lock.

There’s still a chance for Smith to wind up in Canton. He’s not washed up just yet, although the clock is certainly ticking on Smith’s chances of getting pregnant. After lining up inside on only 9.5% of all routes last year, new wide receivers coach (and former teammate) Ricky Proehl, is working with Smith as the team plays to use him in the slot more this season. Perhaps Smith has one more dominant season left in him. Carolina wasn’t as bad as its record was last year, so another playoff berth isn’t out of the question, either. One thing I know: I’ll enjoy watching him in 2013, because it’s not often we get a chance to watch an all-time great.

Previous “Random Perspective On” Articles:
AFC East: Buffalo Bills, Miami Dolphins, New England Patriots, New York Jets
AFC North: Baltimore Ravens, Cincinnati Bengals, Cleveland Browns, Pittsburgh Steelers
AFC South: Houston Texans, Indianapolis Colts, Jacksonville Jaguars, Tennessee Titans
AFC West: Denver Broncos, Kansas City Chiefs, Oakland Raiders, San Diego Chargers
NFC East: Dallas Cowboys, New York Giants, Philadelphia Eagles, Washington Redskins
NFC North: Chicago Bears, Detroit Lions, Green Bay Packers, Minnesota Vikings
NFC South: Atlanta Falcons, Carolina Panthers, New Orleans Saints, Tampa Bay Buccaneers
NFC West: Arizona Cardinals, San Francisco 49ers, Seattle Seahawks, St. Louis Rams

References

References
1 Pre-merger list: Lance Alworth (1966), Dave Parks (1965), Johnny Morris (1964), Raymond Berry (1959, 1960), Pete Pihos (1953), Elroy Hirsch (1951), Don Hutson (1936, 1941 through 1944), and Ray Flaherty (1932).
2 The 2010 Cardinals, who finished 31st in passing yards and 31st in ANY/A, were at 2,921 yards and 3.7 ANY/A.
{ 16 comments }

Two house-keeping notes before we get to today’s post. First, today’s a pretty big day for our friend Neil Paine: he’s getting married. I’ll be there to celebrate with him in Philadelphia, but I know you guys will be with us in spirit. Congrats to Kaitlyn and Neil!

And another set of confetti must be reserve for the seven members of the Pro Football Hall of Fame Class of 2013: Larry Allen, Cris Carter, Jonathan Ogden, Warren Sapp, Curley Culp, Dave Robinson, and Bill Parcells. Tonight, those men will be inducted into the Hall of Fame, a must-see event for any football fan.

Today’s post focuses on one player already enshrined in Canton and one future Hall of Famer. As a general disclaimer, it’s best not to take too seriously what comes out of the mouths of football players, especially this time of year. That said, Adrian Peterson, part-cyborg, part-Minnesota Vikings running back, recently told Dan Wiederer of the Minneapolis Star Tribute that he thinks he will break Emmitt Smith’s career rushing record:

Q Forget about Eric Dickerson’s record for a minute. Last December, we talked about Emmitt Smith’s record and I told you you were on pace to get there in Week 4 of 2019. You said sooner and promised to come back with a timetable. Emmitt had 18,355 yards. You’re now 9,506 away. We need a week and a year. When do you get there?

A Man. Oh boy. I have to do some calculations. I’ve been in the league seven years. I’m already right around [9,000]. Calculate it out … Let’s think. Maybe get a couple 2,000 yard seasons … I’ve got … Hmmm … 2017.

Q What week in 2017?

A Man. I better go late. I’m already getting too far in front of myself. I’ll say Week 16. There it is. Week 16 in 2017. Whoo. That’s pushing it, huh? But hey, pushing it is the only way to do it. You know it.

Just to break it down for you in full, that gives Peterson 79 games to amass the 9,506 yards he needs to reach Smith. That comes out to a per-game average of 120.3 yards per contest with the assumption that Peterson avoids injury and doesn’t miss a game between now and Week 16 of 2017. Yes, it’s pushing it indeed. But good fun to consider, right?

Let’s talk reality. Peterson has rushed for 8,849 rushing yards in his six-year career, and was 27-years-old last year. The first problem for Peterson is that he was 937 yards behind Smith’s pace before Peterson even entered the league. That’s because Peterson, born in March, entered the league at 22, while Smith, born in May, entered at age 21. Unless you think we should compare the two by seasons and not age — and more on why that’s a bad idea later — we need to give Smith full credit for one extra year. In fact, here’s a chart comparing the two players in career rushing yards through age X. Smith also rushed for slightly more yards from ages 22 to 27 (9223-8849) than Peterson, but when you factor in his age 21 performance, Smith has a big lead on Peterson through age twenty-seven. You might recall I presented a similar chart when comparing Jason Witten to Tony Gonzalez and Jerry Rice.
[continue reading…]

{ 14 comments }

Here is a recap of the 2012 Chicago Bears season.  Notice anything strange? Trick question!

Score
Week Day Date OT Rec Opp Tm Opp
1 Sun September 9 boxscore W 1-0 Indianapolis Colts 41 21
2 Thu September 13 boxscore L 1-1 @ Green Bay Packers 10 23
3 Sun September 23 boxscore W 2-1 St. Louis Rams 23 6
4 Mon October 1 boxscore W 3-1 @ Dallas Cowboys 34 18
5 Sun October 7 boxscore W 4-1 @ Jacksonville Jaguars 41 3
6 Bye Week
7 Mon October 22 boxscore W 5-1 Detroit Lions 13 7
8 Sun October 28 boxscore W 6-1 Carolina Panthers 23 22
9 Sun November 4 boxscore W 7-1 @ Tennessee Titans 51 20
10 Sun November 11 boxscore L 7-2 Houston Texans 6 13
11 Mon November 19 boxscore L 7-3 @ San Francisco 49ers 7 32
12 Sun November 25 boxscore W 8-3 Minnesota Vikings 28 10
13 Sun December 2 boxscore L OT 8-4 Seattle Seahawks 17 23
14 Sun December 9 boxscore L 8-5 @ Minnesota Vikings 14 21
15 Sun December 16 boxscore L 8-6 Green Bay Packers 13 21
16 Sun December 23 boxscore W 9-6 @ Arizona Cardinals 28 13
17 Sun December 30 boxscore W 10-6 @ Detroit Lions 26 24

[continue reading…]

{ 4 comments }

If you don’t play fantasy football, you probably have no idea what this title means. Of course, it’s 2013, so if you don’t play fantasy football, you’re now the oddball. “PPR” stands for points per reception. About half of all fantasy leagues do not give any points for receptions, while the other half includes some sort of PPR format. And while the value of every player is dependent on each league’s scoring system, few players see their value fluctuate between scoring systems quite like Wes Welker. Or, at least, that’s how it seems. Is there a way to measure this effect?

First, a review of Welker’s numbers since he joined the Patriots:

Games Receiving
Rk Player Year Age Draft Tm Lg G GS Rec Yds Y/R TD Y/G
1 Wes Welker 2012 31 NWE NFL 16 12 118 1354 11.47 6 84.6
2 Wes Welker 2011 30 NWE NFL 16 15 122 1569 12.86 9 98.1
3 Wes Welker 2010 29 NWE NFL 15 11 86 848 9.86 7 56.5
4 Wes Welker 2009 28 NWE NFL 14 13 123 1348 10.96 4 96.3
5 Wes Welker 2008 27 NWE NFL 16 14 111 1165 10.50 3 72.8
6 Wes Welker 2007 26 NWE NFL 16 13 112 1175 10.49 8 73.4

Welker doesn’t get many touchdowns, and while he has respectable yardage totals, he is only exceptional when it comes to piling up receptions. Welker has 672 receptions over the last six seasons, easily the most in the NFL (in fact, it’s the most ever over any six-year stretch). Brandon Marshall (592) and Reggie Wayne (578) are the only two players even within 100 catches of Welker. Over that same time frame, he ranks 4th in receiving yards, but only tied for 17th in receiving touchdowns.

Giselle approves of Welker's form

Giselle approves of Welker's form.

So how can we measure how much more valuable Welker is in PPR-leagues than non-PPR leagues? One way is to use VBD, which is a measure of how much value a player provided over the worst starter (or some other baseline). For example, Welker scored 173 fantasy points and ranked as WR12 in non-PPR leagues last season. If you are in a start-three wide receiver league, the worst starter would be WR36, who scored 111 fantasy points. That means Welker provided 62 points of VBD.
[continue reading…]

{ 2 comments }

Did you just grab my torch?

Did you just grab my torch?

Randy Moss and Cris Carter. Torry Holt and Isaac Bruce. Reggie Wayne and Marvin Harrison. From time to time, a franchise with a star wide receiver manages to draft another one. At that point, we just wait and see how long it takes the young pup to steal the spotlight. Everyone succumbs to age, and eventually, the torch will be passed to the younger receiver. Even the GOAT wasn’t immune to Father Time (well, at least while he was in SF), as Terrell Owens eventually surpassed Jerry Rice as the 49ers top wideout.

Last year, Julio Jones and Roddy White both finished in the top 12 in fantasy points scored by wide receivers (using the formula 0.5 point per reception, 0.1 points per yard, and 6 points per touchdown). Since 1970, there have been 20 different pairs of wide receivers who met the following criteria:

  • Each wide receiver finished in the top 12 in fantasy points (using a 0.5 PPR scoring system)
  • The receivers were at least four years apart in age; and
  • The younger receiver was 26 year old or younger.

2012 FalconsJulio Jones (23) and Roddy White (31) (Matt Ryan)

Let’s start with the most recent entry.  At just 23 years old, Jones has established himself as one of the game’s best wide receivers.  White is presumably on the downside of his career, but he’s had a remarkable run.  Wide receiver numbers must be adjusted for era, but here’s a fun stat: White has topped 80 catches, 1100 yards, and 6 touchdowns in six straight seasons (2007-2012), a feat previously accomplished by only Marvin Harrison and Jerry Rice.
[continue reading…]

{ 7 comments }

Every year at Footballguys.com, I publish an article called Rearview QB, which adjusts quarterback (and defense) fantasy numbers for strength of schedule. I’ve also done the same thing using ANY/A instead of fantasy points, and today I revive that concept for the 2012 season.

Let’s start with the basics. Adjusted Net Yards per Attempt is defined as (Passing Yards + 20 * Passing Touchdowns – 45 * Interceptions – Sack Yards Lost) divided by (Pass Attempts plus Sacks). ANY/A is my favorite explanatory passing statistic — it is very good at telling you the amount of value provided (or not provided) by a passer in a given game, season, or career.

Let’s start with some basic information. The league average ANY/A in 2012 was 5.93. Peyton Manning averaged 7.89 ANY/A last year, the highest rate in the league among the 39 passers with at least 75 attempts. Since the Broncos star had 583 pass attempts and 21 sacks in 2012, that means he was producing 1.96 ANY/A over league average on 604 dropbacks. That means Manning is credited with 1,185 Adjusted Net Yards above average, a metric I simply call “VALUE” in the table below. Manning led the league in that category, with Tom Brady, Drew Brees, Aaron Rodgers, and Matt Ryan rounding out the top five. Remember, the ANY/A and VALUE results aren’t supposed to surprise you, so it makes sense that the best quarterbacks finish near the top in this category every year.
[continue reading…]

{ 21 comments }

Is there a harder award to predict in football? It would have been impossible to predict who would win the award this time last year, as eventual winner Bruce Arians wasn’t even a head coach until October. Of course, that doesn’t excuse my terrible selection. As I said last year, predicting in the pre-season which coach will ultimately win the award is so difficult that Vegas doesn’t even offer odds on the event. For reference, below is a look at every coach to ever be selected by the Associated Press as NFL Head Coach of the Year: for what it’s worth, Arians saw the biggest increase in winning percentage of any COTY winner. Arians also broke a tenure deadlock: until last season, both 1st and 2nd-year coaches had won the award 15 times, but now first-year head coaches are in the lead having won the award 16 out of 57 times (28%).

[continue reading…]

{ 2 comments }

Scott Kacsmar recently wrote about Robert Griffin III’s struggles on third downs last season. Despite Griffin’s otherworldly rate stats, that was one area where he really struggled in 2012. I thought it would be interesting to take a look at how all quarterbacks fared on “third downs” last season. I put that in quotes because I’m including fourth down data, but don’t want to write third and fourth down throughout this post. Regular readers may recall I did something similar last November, but now we can work with full 2012 season numbers.

To grade third down performance, I included sacks but threw out all rushing data (not for any moral reason, just in the interest of time). The first step in evaluating third down performance is to calculate the league average conversion rate on third downs for each distance. Next, I came up with a best-fit smoothed line based on the data, which is based off the following formula:

Conversion Rate = -0.0001 * Distance^2 – 0.0224 * Distance + 0.5301

Take a look at the table below. For example, there were 309 passes (i.e., pass attempts or sacks — scrambles are not included) and the league-wide conversion rate was 51.1%. Using the best-fit formula, the smoothed rate is 50.8%. There is nothing groundbreaking here — the conversion rates drop as the “to go” number increases, but it helps to quantify what we already know.

To GoPassesFirst DownsRateSmoothed Rate
130915851.1%50.8%
241520850.1%48.5%
348720742.5%46.2%
451222744.3%43.9%
555922640.4%41.6%
654122842.1%39.2%
752118134.7%36.8%
842614333.6%34.5%
936511631.8%32%
1072822030.2%29.6%
112137133.3%27.2%
121533925.5%24.7%
131352417.8%22.2%
141072220.6%19.7%
151432215.4%17.2%
166258.1%14.6%
17681217.6%12%
185036%9.5%
195335.7%6.8%
204836.3%5%

[continue reading…]

{ 23 comments }

Last week, I wrote about how the 2012 Redskins were powered by a pair of rookies in Robert Griffin III and Alfred Morris. The only team whose rookies had more passing/rushing/receiving yards in NFL history was the 2012 Colts, while the only non-expansion team with a higher percentage of yards from rookies was the ’55 Colts.

In the comments, Shattenjager pointed out that the list I presented was pretty quarterback-heavy. So I thought a fun thing to do would be to use PFR’s Approximate Value (AV) system instead of yards, and re-run the numbers.

The table below shows all non-expansion teams since 1950 that had at least 25% of their AV come from rookies. For each team, I’ve listed their record and winning percentage, total team AV, their rookie AV, and the percentage compiled by rookies. Then I listed their top four rookies in terms of AV.
[continue reading…]

{ 3 comments }

Last week, I examined the Chargers hiring of former Broncos offensive coordinator Mike McCoy. What I found was that, on average, teams that go outside the organization to hire offensive coordinators saw no uptick in offensive production in the new coach’s first season. And in general, the list consisted of a lot of uninspiring names.  The history of hiring defensive coordinators is a little more successful, at least according to the eyeball test. Chuck Pagano, Rex Ryan, Mike Smith, and Mike Tomlin are some of the more recent hires, and of course Bill Belichick’s work as defensive coordinator under Bill Parcells was the launch pad for two head coaching jobs.

This year, the only team that hired a defensive coordinator was Jacksonville, who tapped Gus Bradley as the Jaguars newest head coach. There’s an entirely new regime in Jacksonville (led by owner Shad Khan and general manager David Caldwell), but it’s hard not to view the Bradley selection in light of the team’s previous hire. In 2012, the Jaguars chose “hotshot” offensive coordinator Mike Mularkey, who was coming off a successful season as the coordinator of the great Falcons offense. A year later, the Jags are picking the defensive coordinator for the league’s top defense in 2012, at least as measured by points allowed.

The table below shows all of the instances I’ve identified since 1990 where a team hired a new head coach who had been a defensive coordinator for a different team in the prior year. Here is how the Bradley line reads. In 2012, Bradley was the Defensive Coordinator for Seattle; after the season, he was hired to become the head coach of the Jaguars. With the Seahawks, Bradley’s defense ranked 1st in points allowed, 4th in yards allowed, and 7th in PFR’s EPA allowed.
[continue reading…]

{ 3 comments }
Year QBrec Cmp Att Cmp% Yards TD TD% Int Int% Y/A Y/C PRate ESPN QBR Sk Yds NY/A ANY/A Sk%
2004 1-6-0 95 197 48.2 1043 6 3.0 9 4.6 5.3 11.0 55.4 13 83 4.57 3.21 6.2
2005 11-5-0 294 557 52.8 3762 24 4.3 17 3.1 6.8 12.8 75.9 28 184 6.12 5.63 4.8
2006 8-8-0 301 522 57.7 3244 24 4.6 18 3.4 6.2 10.8 77.0 25 186 5.59 4.99 4.6
2007 10-6-0 297 529 56.1 3336 23 4.3 20 3.8 6.3 11.2 73.9 27 217 5.61 4.82 4.9
2008* 12-4-0 289 479 60.3 3238 21 4.4 10 2.1 6.8 11.2 86.4 62.56 27 174 6.06 6.00 5.3
2009 8-8-0 317 509 62.3 4021 27 5.3 14 2.8 7.9 12.7 93.1 69.75 30 216 7.06 6.89 5.6
2010 10-6-0 339 539 62.9 4002 31 5.8 25 4.6 7.4 11.8 85.3 65.88 16 117 7.00 6.09 2.9
2011* 9-7-0 359 589 61.0 4933 29 4.9 16 2.7 8.4 13.7 92.9 59.39 28 199 7.67 7.45 4.5
2012* 9-7-0 321 536 59.9 3948 26 4.9 15 2.8 7.4 12.3 87.2 67.39 19 136 6.87 6.59 3.4
Career 78-57-0 2612 4457 58.6 31527 211 4.7 144 3.2 7.1 12.1 82.7 213 1512 6.43 5.94 4.6

In 2011, Eli Manning threw for 4,933 yards and won the Super Bowl. Last year, he threw for 3948 yards and missed the playoffs. It’s tempting to think that something was “wrong” with Manning last year. Another narrative would be that 2011 was a career year far out of line with anything else he’s done, which would make 2012 was the real Manning. I’m not sure I buy either of those explanations.

Let’s start by comparing Manning’s numbers in 2011 and 2012. Yes, his passing yards dropped, but that’s a meaningless metric on its own. He threw 53 fewer passes in 2012, a partial explanation for why his yards declined. And while his yards per attempt did drop from 8.4 to 7.4, about 20% of that dip was mitigated by the fact that he took fewer sacks (his Net Yards per Attempt dropped from 7.7 to 6.9). In addition to improving his sack rate, Manning’s touchdown and interception rates were virtually identical, which means his decline was limited to pass attempts and yards per attempt.

We can break down the numbers on why his yards per attempt declined thanks to some additional data courtesy of NFLGSIS. In 2011, Manning averaged 8.4 yards per attempt. That was a result of three things: a 61.0% completion rate, 5.82 yards after the catch (per completion), and 7.92 Air Yards per Completed Pass. In 2012, Manning averaged 7.4 yards per attempt, with a 59.9% completion rate, 4.33 average YAC, and 7.97 Air Yards per Completed Pass.

The tiny drop in completion percentage is more than offset by the better sack rate, and if Manning was throwing incomplete passes instead of taking sacks, that’s a good thing. As for what happens when he completed a pass, his entire decline was in the form of yards after the catch. In 2011, he ranked 3rd in Air Yards per Completed Pass and 6th in YAC per completion; in 2012, he ranked 2nd in AY/CP and 30th in YAC per completion.

Now there’s some evidence to indicate YAC might be more on the quarterback than Air Yards. Other studies, and what I think is popular opinion, is that YAC is more about the receiver than the quarterback. But let’s further investigate why the Giants dipped in YAC. The table below shows a more precise breakdown. For both 2011 (in blue) and 2012 (in red), you can see the number of Receptions, Air Yards per Reception, YAC per reception, and Yards per Reception. The rows show each of the Giants top three receivers, top tight end, and top running back, along with the other players at wide receiver, tight end, and running back.
[continue reading…]

{ 8 comments }

Britt smoked the Eagles secondary

Britt smoked the Eagles secondary.

Kenny Britt’s story is hardly a secret. As a freshman at Rutgers in 2006, his 64-yard catch turned the tide in the biggest win in school history. The next year, he was part of a dynamic offense: Ray Rice rushed for 2,012 yards, Tiquan Underwood caught 65 passes for 1100 yards and 7 touchdowns, and Britt was the big play threat, gaining 1,232 yards and 8 touchdowns on 62 catches. In 2008, Britt caught 87 passes for 1,371 yards and 7 touchdowns. After his junior year, the dynamic college receiver made the obvious move and declared for the NFL Draft. He then watched his hometown Giants take Hakeem Nicks one pick before the Titans made Britt the first Rutgers player ever to be selected in the first round.

Before analyzing his NFL career, I think it’s important to remember that Britt is young for his class year: he played in his first NFL game before he was old enough to legally drink. Despite the young age, Britt didn’t disappoint, producing 701 receiving yards as a rookie in ’09. He even produced a signature moment, catching the game-winning touchdown pass from Vince Young in what was one of the greatest comeback drives of all time (no, really — I swear).

Britt’s 2010 season looks like modest improvement on the surface, but his 775 yards and 9 touchdowns don’t tell the full story. According to Pro Football Focus, Britt only ran passing routes on 253 snaps that season, but averaged a whopping 3.1 yards per route run, easily the highest rate in the league. The obvious follow-up question is why didn’t he run more routes? Well, the 2010 Titans were a run-heavy team centered around Chris Johnson; Tennessee finished 30th with just 474 pass attempts. Britt also missed nearly five full games with a hamstring injury, and Tennessee tended to place Nate Washington on the field in their 1-WR sets. Those seem like reasonable explanations for overlooking why a 22-year-old would play a limited number of snaps. The impressive part is his insane production.
[continue reading…]

{ 13 comments }

How did I end up with John  Hadl's helmet? It's actually a funny story

How did I end up with John Hadl's helmet? It's actually a funny story.

In 2011, Mike Mularkey and Joe Philbin were offensive coordinators for high-powered offenses. Those success seasons — on the backs of elite quarterbacks and wide receivers — were springboards for head coaching jobs in 2012. Mularkey’s work with Matt Ryan, Roddy White, Julio Jones, and Tony Gonzalez got him the top spot in Jacksonville, while Philbin (with an assist from head coach and play caller Mike McCarthy) parlayed big numbers from Aaron Rodgers, Jordy Nelson, Greg Jennings, Jermichael Finley, James Jones, and Randall Cobb into the Dolphins head coaching job. Mularkey, of course, was one-and-done with the Jaguars, while Philbin had an uneven first year in Miami.

Mike McCoy’s work with Peyton Manning, Demaryius Thomas, and Eric Decker in 2012 (and Tim Tebow in 2011) helped him become the Chargers head coach in 2013. McCoy is one of three 2012 offensive coordinators who will be head coaches this season. [1]As for the other six head coaching changes? Doug Marrone (Syracuse) and Chip Kelly (Oregon) jump from college to Buffalo and Philadelphia, while Marc Trestman goes from Canada to Chicago. Gus Bradley … Continue reading The other two are are Bruce Arians (who goes from OC/interim HC/COTY in Indianapolis to Head Coach in Arizona) and Rob Chudzinkski (OC in Carolina, HC in Cleveland). I’m not sure if Arians really qualifies, but in any event, it’s McCoy who truly represents the “hot shot offensive coordinator –> head coaching job” rungs on the coaching ladder. His 2012 Broncos finished 2nd in points scored, 4th in yards, and 1st in both Net Yards per pass Attempt and Adjusted Net Yards per pass Attempt.

We’re working on our database of offensive coordinators, but it’s not 100% complete just yet. Let me know if I’ve missed any, but the table below represents all of the instances I’ve identified since 1990 where a team hired a new head coach who had been an offensive coordinator for a different team in the prior year. Here is how the McCoy line reads. In 2012, McCoy was the Offensive Coordinator for the Denver Broncos; after the season, he was hired to become the head coach of the Chargers. With the Broncos, his offense ranked 2nd in points, 4th in yards, and 1st in Adjusted Net Yards per Attempt.
[continue reading…]

References

References
1 As for the other six head coaching changes? Doug Marrone (Syracuse) and Chip Kelly (Oregon) jump from college to Buffalo and Philadelphia, while Marc Trestman goes from Canada to Chicago. Gus Bradley was the sole defensive coordinator hire, moving from Seattle to Jacksonville, while Andy Reid (Philadelphia to Kansas City) was the one “retread” hire. Sean Payton also moves from the naughty step back into the head coaching job in New Orleans.
{ 8 comments }

Vernon Davis as Art Monk

After the voters did not select Shannon Sharpe as part of the 2009 Hall of Fame Class, I wrote this post comparing Sharpe to Art Monk. While many viewed Sharpe as a receiver playing tight end, I noted that the Redskins used Monk not just as a wide receiver, but as an H-Back and as a tight end. My friend and football historian Sean Lahman once wrote this about Monk:

Even though Monk lined up as a wide receiver, his role was really more like that of a tight end. He used his physicality to catch passes. He went inside and over the middle most of the time. He was asked to block a lot. All of those things make him a different creature than the typical speed receiver…. His 940 career catches put him in the middle of a logjam of receivers, but he’d stand out among tight ends. His yards per catch look a lot better in that context as well.

I haven’t heard anyone else suggesting that we consider Monk as a hybrid tight end, but coach Joe Gibbs hinted at it in an interview with Washington sportswriter Gary Fitzgerald:

“What has hurt Art — and I believe should actually boost his credentials — is that we asked him to block a lot,” Gibbs said. “He was the inside portion of pass protection and we put him in instead of a big tight end or running back. He was a very tough, physical, big guy.”

With Michael Crabtree likely to miss most if not all of the 2013 season due to a torn Achilles, the 49ers may consider moving Vernon Davis from tight end to wide receiver. The most likely explanations for Davis playing exclusively at wide receiver in mini-camp are (a) he doesn’t need more practice at tight end while his route-running could probably use some refining, (b) the 49ers have several young tight ends who could benefit from more reps in mini-camp, and (c) the wide receiver group is currently depleted, and it’s June, so why not try something outside the box?
[continue reading…]

{ 3 comments }

Steve Johnson doesn't care about the NFL schedule

Steve Johnson doesn't care about the NFL schedule.

Chris Brown of buffalobills.com is not happy with the way the Bills’ schedule shakes out. Again. Last year, this is what Brown wrote after examining the 2012 schedule:

After playing what is expected to be a physical contest with the 49ers in San Francisco in Week 5 [Chase: In retrospect, not that physical], the Bills then face the Cardinals in Arizona in Week 6. The Cards will have the benefit of three extra days of prep time for Buffalo as their Week 5 game is on Thursday night.

The very next week when the Bills play host to Tennessee, the Titans will also have three extra days of prep time for Buffalo because they’re playing on Thursday night the previous week (Week 6) as well.

The Bills look to get a break as they’ll have a bye week in Week 8 to get two weeks to prep for the Texans in Houston. But that extra prep time will be a wash because Houston also has their bye in Week 8.

Finally while the Bills are battling the Texans in Houston, the Patriots will be on their couches watching at home while their head coach grinds tape for two weeks to prepare for the Bills who travel to New England in Week 10 as the Pats have their bye in Week 9.

Brown’s claims were accurate: Buffalo did face a team coming off extra rest (i.e., more than eight days) four times in five weeks. Of course, those were the only times all season the Bills played a team coming off extra rest. Still, if we look at the 2012 season, it’s fair to say the Bills got the short end of the scheduling stick.

But they don’t have the biggest beef. Philadelphia faced four teams coming off bye weeks last year, tying the ’09 Falcons, ’05 Chargers, ’03 Cowboys, and ’99 Chargers for facing the most teams coming off a bye week since 1994.
[continue reading…]

{ 3 comments }

Matt Stafford won the 2012 ESPY for most double chins in a leading role

Matt Stafford won the 2012 ESPY for most double chins in a leading role.

Last year’s article on the Lions was somewhat negative. Detroit went 4-12 in 2012, but the Lions are going to win more games this year. This is the type of article that Jason Lisk, Bill Barnwell, Brian Burke, or Aaron Schatz could write in their sleep. But I’m writing it while watching TV, writing a more complicated article, working out, taking out the trash, and tweeting. Let’s see Lisk do that!

The Lions went 3-9 in games decided by 8 or fewer points last year, giving them the most losses and the worst winning percentage of all teams in one-possession games. While this might imply that the Lions lack the mental fortitude to win close games, you might recall that in 2011, the Minnesota Vikings (2-9) and the Indianapolis Colts (1-7) were the worst two teams in such situations and then made the playoffs last year.

Another way to convey similar information is to look at each team’s Pythagorean record, which is calculated based on a team’s points scored and points allowed and is a better predictor of future winning percentage than past winning percentage. The table below shows each team’s number of wins, points scored and allowed, and number of Pythagorean wins for 2012, using 2.57 as my exponent(which produced the best fit for recent years). The table is sorted by the difference between actual wins and Pythagorean wins:
[continue reading…]

{ 20 comments }

In 2008, Larry Fitzgerald had a fantastic regular season capped off by a historically great postseason; in the Super Bowl, he set the record for receiving yards in a season, including playoff games, with 1,977 yards. Of course, 2008 was decades ago in today’s era of what have you done for me lately. The table below shows Fitzgerald’s stats over the past four seasons. The final two columns show the total number of receiving yards generated by all Cardinals players and Fitzgerald’s share of that number.

YearRecYdsYPRTDARI Rec YdsPerc
200997109211.313420026%
201090113712.66326434.8%
201180141117.68395435.7%
20127179811.24338323.6%

2009 was the last season of the Kurt Warner/Anquan Boldin Cardinals. The 97 receptions and 13 touchdowns look great, although hitting those marks and not gaining 1,100 receiving yards is very unusual. Fitzgerald was only responsible for 26% of the Cardinals receiving yards that season, although one could give him a pass since he was competing with another star receiver for targets.

Can Fitzgerald rebound in 2013?

Can Fitzgerald rebound in 2013?

In 2010, Derek Anderson, John Skelton, Max Hall, and Richard Bartel were the Cardinals quarterbacks: as a group, they averaged 5.8 yards per attempt on 561 passes. Arizona’s passing attack was bad, but without Boldin, Fitzgerald gained 34.8% of the team’s receiving yards. Steve Breaston chipped in with 718 receiving yards yards while a 22-year-old Andre Roberts was third with 307 yards. In other words, Fitzgerald performed pretty much how you would expect a superstar receiver to perform on a team with a bad quarterback and a mediocre supporting cast: his raw numbers were still very good (but not great) because he ate such a huge chunk of the pie. After the 2010 season, I even wondered if he could break any of Jerry Rice’s records (spoiler: he can’t).

In 2011, Skelton, Kevin Kolb and Bartel combined for 3,954 yards on 550 passes, a 7.2 yards per attempt average (Kolb was at 7.7 Y/A). That qualifies as a pretty respectable passing game and Fitzgerald appeared to have a monster year, gaining 35.7% of the Cardinals’ receiving yards (Early Doucet was second with 689 yards and Roberts was third with 586 yards). It’s always hard splicing out cause and effect, but my takeaway is that with a more competent passing game, Fitzgerald continued to get the lion’s share of the team’s production but unlike in 2010, this led to great and not just good numbers.
[continue reading…]

{ 12 comments }

Turner describing a route. I think.

Turner describing a route. I think.

With Norv Turner, you know what you’re going to get. Turner was fired in San Diego after the Chargers failed to make the playoffs in each of the last three years, but as usual, Turner was able to find a nice landing spot. He’ll be the Browns offensive coordinator in 2013, which will mark his 29th straight year in the NFL. Turner started as a receivers coach with the Rams in 1985 and hasn’t been out of work for very long ever since.

And while he has a reputation for having great running games, he also has habit of sending his receivers down the field. That’s no accident. Ernie Zampese, a longtime assistant under Don Coryell, became the Rams offensive coordinator in 1987, and Turner’s teams have been running a variation of the vertical Coryell/Zampese system ever since.

I ranked all players (minimum 500 receiving yards) in yards per reception in each year since Turner was united with Zampese in ’87. In six of those seasons, one of five different Turner receivers led the NFL in yards per reception. In addition, Turner’s top receiver (in terms of YPR) finished in the top five in that metric thirteen more times. The table below shows the rank of the highest-ranked receiver (in terms of YPR) in Turner’s offense in each of the last 26 years.
[continue reading…]

{ 2 comments }
Previous Posts