≡ Menu

One of the greatest receivers ever

As noted yesterday, Steve Smith played on teams that didn’t pass very often (just 94% as often as the average team) or pass well (his average team’s passing offense produced a -0.12 Relative ANY/A). He’s the only player in the top 20 in career receiving yards who played on teams that were below average in both categories; Muhsin Muhammad and Joey Galloway are the only other such players in the top 40, and Eric Moulds (who ranks 49th) is the only other such player in the top 75 in career receiving yards. There’s a reason that Smith has long been a Football Perspective favorite.

Using the results from Friday’s post and Saturday’s post, we can sum the results to see which receivers really played in the most disadvantageous environments. To do that we need to convert each player’s results in both Pass Ratio and Relative ANY/A into Z-scores.

For Pass Ratio, the average for this group of 200 players was 102.5%, and the standard deviation was 6.7%. So for Smith, whose teams passed on 93.6% of plays, he has a Z-Score in the Pass Ratio variable of -1.33, since his teams were 1.33 standard deviations below average (102.5% minus 93.6% is 8.9%, and 8.9% divided by 6.7% is 1.33). For Relative ANY/A, the average was +0.35 and the standard deviation was 0.63. For Smith, he has a Z-Score in pass efficiency of -0.74, since his teams were 0.12 ANY/A below average (+0.35 minus -0.12 is 0.47, and 0.47 divided by 0.63 gives us how many standard deviations his teams were below average).

Note that the averages here for both pass quantity and quality are above average. That’s not surprising, but it is noteworthy. One, the players with the most receiving yards tended to play on better passing offenses, but we also give more weight to a player’s best seasons, which tend to come when they play with good quarterbacks who frequently pass.

The table below shows the full results for all 200 players. Here’s how to read the Jerry Rice line. He is the career leader in receiving yards with 22,895, and he played from 1985 to 2004. His average team had a RANY/A of +1.57, which was 1.91 standard deviations above average. His average team also had a Pass Ratio of 105.8% of league average, which was 0.51 standard deviations above average. Add those numbers together, and he has a Z-Score total of 2.42. [continue reading…]

{ 0 comments }

The Steve Smith Postseason Post

Today’s guest post comes from Adam Harstad, who is also part of the Smitty Fan Club. You can follow Adam on twitter at @AdamHarstad.


One of the greatest playoff receivers ever

Smith considers letting the chip roll off his shoulder.

IS STEVE SMITH THE GREATEST POSTSEASON WR IN HISTORY?

Prior to this last weekend’s slate of games, I remarked to several friends what a treat it was that we got to watch Calvin Johnson, Larry Fitzgerald, and Steve Smith all playing on the same weekend. In addition to being three of the best receivers of the last decade, all three could lay claim to the best per-game postseason numbers in history, depending on where you set the cut-offs.

Calvin Johnson had only appeared in one postseason game prior to this season, but he made it count with 12/211/2 receiving in a losing effort. Calvin was actually the fourth player in history to top 10 receptions, 200 yards, and 2 touchdowns in a single playoff game, [1]Oddly, all four receivers to reach those marks were active this past weekend; in addition to Calvin Johnson, they were Reggie Wayne, Steve Smith, and T.Y. Hilton. but each of the three previous have played additional games to bring their per-game numbers down. Among players who appeared in at least one playoff game, Calvin’s 211-yard “average” was the best by a mile.

If you moved the cutoff to 6 games, Larry Fitzgerald’s postseason averages took over the spotlight. Following the 2008 NFL season, Fitzgerald had arguably the greatest postseason run by a wide receiver, hauling in 6/101/1, 8/166/1, 9/152/3, and 7/127/2 in his four games, including what would have been the Super Bowl-winning touchdown and a likely MVP performance if not for some heroics from Ben Roethlisberger and Santonio Holmes. Fitzgerald followed that up with a strong showing in the 2009 playoffs, catching 12/159/2 over two games. All told, Fitzgerald had 53/705/9 receiving in just six postseason appearances, for a per-game average of 8.8/118/1.5. [continue reading…]

References

References
1 Oddly, all four receivers to reach those marks were active this past weekend; in addition to Calvin Johnson, they were Reggie Wayne, Steve Smith, and T.Y. Hilton.
{ 1 comment }
Megatron at his best

Megatron at his best.

In his seven-year career, Calvin Johnson has already recorded 9,328 receiving yards. And for those curious about these sorts of things, he’s the career leader in receiving yards per game at 88.0, too. But Johnson has also benefited greatly from playing on teams that have thrown a weighted average of 635 pass attempts per season.

What is a weighted average of team pass attempts? I’m defining it as an average of pass attempts per season weighted by the number of receiving yards by that player. Why use that instead of a simple average? When thinking about whether a receiver played for a run-heavy or pass-happy team, we tend to think of that receiver during his peak years. If he caught 10 passes for 150 yards as a rookie on a very pass-happy team, that should not be given the same weight as the number of pass attempts his team produced in his best season. For example, here is how I derived the 635 attempt number for Megatron.

Twenty-one percent of his career receiving yards came in 2012, when Detroit passed 740 times (excluding sacks). Therefore, 21% of his team pass attempts average comes from that season, while 18% comes from his 2011 season, 16% from his 2013 season, and so on. In the table below, the far right column shows how we get to that 635 figure: by multiplying in each season the percentage of career receiving yards recorded by him in that season by Detroit’s Team Pass Attempts.

YrRecYdTPAPercTM * %
2013149263416%101.4
2012196474021.1%155.8
2011168166618%120
2010112063312%76
200998458510.5%61.7
2008133150914.3%72.6
20077565878.1%47.6
Total93284354100%635.2

There are 121 players with 7,000 career receiving yards. Unsurprisingly, Johnson has the highest weighted average number of team pass attempts, which must be recognized when fawning over his great raw totals. Marques Colston is just a hair behind Johnson, but no other player has an average of 600+ team pass attempts.

The table below contains data for all 121 players (by default, the table displays only the top 25, but you can change that). Here’s how to read it, starting with the GOAT: Jerry Rice ranks first in career receiving yards, and he played from 1985 to 2004. Rice played in 303 games, gained 22,895 receiving yards, and his teams threw a weighted average of 547 passes per season. Among these 121 players, that rank Rice as playing for the 25th highest or most pass-happy team. Rice also averaged 76 receiving yards per game, which ranks 5th among this group. [continue reading…]

{ 16 comments }

Predictions in Review: NFC South

During the 2013 offseason, I wrote 32 articles under the RPO 2013 tag. In my Predictions in Review series, I review those preview articles with the benefit of hindsight. Previously, I reviewed the AFC West, the NFC West, and the the AFC South. Today, the NFC South.

Who Will Win 2013 Head Coach of the Year, July 25, 2013

For reasons that are not quite clear to me, I have an unusual fascination with the Coach of the Year award. There’s no harder award to predict in all of sports, since the winner is essentially the coach of the team that had the least predictable (in a good way) season. Still, I threw my hat into the ring in 2014 and predicted that Sean Payton would win Coach of the Year. Here is what I wrote in July:

Rob Ryan is now in charge of a defense that ranked last in yards allowed, net yards per attempt allowed, rushing yards allowed, rushing yards per carry allowed, first downs allowed, Expected Points Added, and defensive DVOA. The 2012 Saints also ranked 31st in points allowed. Ryan himself won’t fix that, but first round pick Kenny Vaccaro should begin to help the problem secondary.

But the real reason for optimism is the always explosive Saints offense. Drew Brees, Jimmy Graham, and Darren Sproles are three of the more unique players in the NFL, and help give the Saints an outstanding passing offense. Of course, New Orleans passing attack was great before either Graham or Sproles arrived, as the Brees/Payton engine (with a dash of Marques Colston and Lance Moore) is at times unstoppable. …

Predicting who will win AP Coach of the Year is a fool’s errand, but I’m willing to put my chips on Brees and Payton leading the Saints to the playoffs in a “bounceback” year. The real question is whether that will be enough to convince the voters to select Payton.

As it turned out, Payton did lead a resurgent Saints team from 7-9 in 2012 to 11-5 in 2013; unfortunately for him, a playoff berth was not enough to get him Coach of the Year. That honor instead went to Ron Rivera, although in my eyes, Andy Reid was an immensely more deserving choice.

What can we learn: In week 16, the Panthers defeated the Saints on a touchdown pass with 28 seconds left in the game; had New Orleans won that game, the Saints would have finished 12-4 and won the division and a first round bye, knocking Rivera’s Panthers down to the 5 seed. Would that have been enough to swing the COTY award to Payton? Probably not, although it likely would have meant Reid would have won the honor. The Coach of the Year award remains impossible to predict.
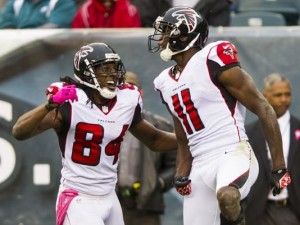
Did you just grab my torch?

Did you just grab my torch?.

Julio Jones and Roddy White star in Stealing The Torch, July 31, 2013

My other three NFC South posts were more walks down memory lane than predictions. The Falcons post was a look at other star wide receiver tandems that were similar to Julio Jones and Roddy White in 2012. This was a fun way to look at comparable receivers, but there was nothing fun about the Atlanta offense in 2013.  Jones averaged 116.0 yards per game last year, but that came over just five games. A foot injury suffered against the Jets in week 5 ended what looked to be a special season: Jones was leading the league in receptions (41) and was second in receiving yards (580) at the time. White, meanwhile, had an absymal start to his season that dragged on for months.

Hamstring and ankle injuries caused White to miss three full games and hampered his production in most of the others. At the end of November, he just 20 catches for 209 yards; at that point, the Falcons were 2-9, and I won’t fault you if you put Atlanta on “ignore” for the rest of the year. But White exploded with 43 catches for 502 yards in December, joining Josh Gordon (658) and Alshon Jeffery (561) as the only players with 500+ receiving yards in December 2013.

The Steve Smith Post, August 7, 2013

In August, I decided to compile the loose odds and ends I had collected on Steve Smith over the years. When the time comes, I plan on using that post to augment Smith’s Hall of Fame case. Unfortunately for Smith, the time may be coming sooner than he’d like. On December 1st, I wrote that Smith’s poor production may have been a reason for why Cam Newton’s numbers had declined.

Smith has had largely the same role in the Panthers offense for years, so it’s not unreasonable to compare his advanced metrics from each of Newton’s seasons.  In 2013, Smith caught 58.2% of his targets, which is in line with his production from 2012 (52.9%) and 2011 (61.2%). However, Smith started running much shorter routes — according to NFLGSIS, his average reception came just 8.9 yards downfield in 2013, compared to around 12 yards over the prior two years. Smith’s YAC also decreased (which is unusual, as shorter passes tend to lead to more YAC, making this another bad sign); as a result, his yards per target dropped from 10.8 in 2011 to 8.5 in 2012 to just 6.8 in 2013.  It was a down year in a Hall of Fame caliber career. Smith turns 35 in May; unfortunately, it seems safe to suggest that the best is behind him.

Can Tampa Bay Win the NFC South With the Worst Passing Attack?, August 13, 2013

Just about everyone assumed the Bucs would have the worst starting quarterback in the NFC South. What interested me was the rest of the team. The question I posed was more trivia than analysis: how often does the team with the worst passing attack in the division wind up winning the division?

The answer: Since 1950, only nine teams pulled off that feat, with nearly half of them coming since the league moved to a four-teams-per-division-for-each-division format in 2002. No team pulled off that feat in 2013, although the Panthers ranked 3rd in the NFC South in Adjusted Net Yards per Attempt. The team that ranked last in the division was, of course, the Bucs.

The Bucs ranked 32nd in NY/A and finished the year 4-12. But remember: Tampa Bay faced the hardest schedule in the league in 2013. Early DVOA estimates project the Bucs for 7.7 wins in 2014, and there are reasons for optimism in Tampa Bay in 2014.

{ 3 comments }

You probably didn’t know it, but Cam Newton is having a down year, at least statistically.

Year GS Cmp Att Cmp% Yds TD TD% Int Int% Y/A AY/A Y/C Y/G Sk Yds NY/A ANY/A Sk%
2011 16 310 517 60.0 4051 21 4.1 17 3.3 7.8 7.2 13.1 253.2 35 260 6.87 6.24 6.3
2012 16 280 485 57.7 3869 19 3.9 12 2.5 8.0 7.6 13.8 241.8 36 244 6.96 6.65 6.9
2013 11 208 337 61.7 2353 17 5.0 9 2.7 7.0 6.8 11.3 213.9 31 235 5.76 5.58 8.4

Carolina’s defense has been outstanding, of course, so an 8-3 record and a seven-game winning streak have overshadowed any flaws in Newton’s game. The Panthers have held an average lead of 5.05 points per second this year, the third best rate in the league. As a result of that high Game Script, Newton is asked to do less on offense, but that doesn’t explain the declining efficiency numbers. Newton’s taking slightly more sacks and his rushing numbers are down across the board, but the biggest decline comes with respect to yards per completion.
[continue reading…]

{ 16 comments }

True Receiving Yards, Part I

One of many Rams greats to wear #29

One of many Rams greats to wear #29.

As you guys know, Neil Paine is the man. Here’s the latest reason: he came up with a metric called True Receiving Yards, the latest in a long line of thoughts in our Wide Receiver Project. So, what are True Receiving Yards?

We start with Adjusted Catch Yards, defined as 5 * Receptions + Receiving Yards + 20 * Receiving Touchdowns.

1) Then, we convert each player’s Adjusted Catch Yards to the same scale as pure receiving yards using the following formula:

Adjusted Catch Yards * League Receiving Yards / League Adjusted Catch Yards

2) Next, we adjust for how often the receiver’s team passed.  We use the following formula:

[Result in Step 1] * League_Avg_Team_Pass_Attempts / Team_Pass_Attempts

For purposes of this post, Team Pass Attempts include sacks.

3) Then we adjust for the league passing environment, by using this formula:

[Result in Step 2] * by (214.54/Avg_Team_Receiving_Yards_Per_Game).

Why 214.54? Because that’s how many yards the average NFL team has passed for in each season since 1970.

4) Finally, we need to adjust for schedule length. This one’s pretty simple:

[Result in Step 2] * 16 / Team Games

As it turns out, the single-season leader in True Receiving Yards is….. Harold Jackson for the 1973 Rams. That will probably surprise some folks; heck, it surprised me. So let’s walk through Jackson’s season by comparing it to Calvin Johnson’s 2012. Jackson caught 40 passes for 874 yards and 13 touchdowns. That gives him 1,334 Adjusted Catch Yards, while Megatron’s 122-1964-5 translates to 2,674 Adjusted Catch Yards, more than twice what Jackson produced.

1) First, we need to convert those ACY numbers into receiving yards.  In 1973, that conversion ratio is 65.5%, and in 2012, it was 64.5%; this means Jackson is credited with 874 receiving yards (ironically, his actual number) while Johnson is pushed down to only 1,725 yards. This is because Johnson had a ton of yards but only five touchdowns.  In other words, based on his receptions, receiving yards, and receiving touchdowns, Johnson was more like a 1,725-yard receiver last year.

2) Jackson’s Rams had just 288 Team Pass Attempts, while the average team in 1973 averaged 373.3 pass attempts. So we need to bump Jackson up by 29.6%, which would give him 1,132 receiving yards. The 2012 Lions had 769 Team Pass Attempts compared to a league average of 592.4; therefore, we need to give Johnson credit for only 77% of his ACY, bringing him down to 1,329 receiving yards.

3) Next, we adjust for league environment. In 1973, the average team passed for 159 yards per game, which means we need to bump Jackson up by 34.6% (the result of 214.54 divided by 159); this gives him 1,524 receiving yards. For Megatron, since the average team in 2012 passed for 246 yards per game, we need to multiply his result in step 2 by 87.2%, leaving him with only 1,159 receiving yards.

4) For Calvin Johnson, that’s it: he is credited with 1,159 True Receiving Yards, after reducing his numbers for playing in a pass-happy offense, playing in a pass-happy era, and not having many touchdowns. For Jackson, his 1,524 gets pro-rated to a 16-game season, giving him 1,742 True Receiving Yards.
[continue reading…]

{ 33 comments }

Smith likes ranking receivers by yards per team attempt

Smith likes ranking receivers by yards per team attempt.

When I wrote my ode to Steve Smith earlier this week, I discovered an incredible stat. In 2008, Smith played in 14 games and gained 1,421 receiving yards. But the more incredible part is that the Panthers passed only 352 times in 2008, meaning Smith averaged an absurd 4.04 yards per team pass attempt. At this point, we all know that passing yards is a meaningless way to measure quarterbacks: yards per attempt is a much better indicator of talent. It’s much easier to throw for 4,000 yards on 600 attempts than it is on 500 attempts, and it’s silly to pretend otherwise. But most analysts don’t make the same adjustment when dealing with the man catching those passes. But it’s much easier to gain 1,500 receiving yards on a team that passes 700 times than it is to do it on a team that passes only 500 times. Hence my interest in Yards per Team Pass Attempt as a statistic.

So, how absurd was Smith’s 4.04 Yards per attempt average? We have individual player game logs going back to 1960, so I went through and measured every game each receiver “played” in each season since then. I use that word in quotes, because it’s possible that a receiver was active in a game but did not record any statistics, and therefore he may not show up in our game logs. That caveat aside, the table below shows the single-season leaders since 1960 in Receiving Yards per Team Pass Attempt (minimum 170 passes, so I could bring in Paul Warfield), with only the games in which the player “played” counting in the attempts column. As always, the table is sortable and searchable, and you can click the arrows at the bottom to scroll to the next names on the list (the table contains the 138 receivers to average 2.75 Yd/Att.)
[continue reading…]

{ 5 comments }

The Steve Smith Post

Smith has excelled despite playing for a ground-based attack

Smith has excelled despite playing for a ground-based attack.

Over the last decade, Carolina’s Steve Smith has been one of the best receivers in the NFL. He’s also been the most under-appreciated. Let’s stroll down memory lane:

  • As a rookie, Smith was a first-team All-Pro returner but caught only ten passes. In his second year, he caught 54 passes for 872 yards and three touchdowns, and bumped those numbers to 88-1,110-7 in 2003. That season, the Panthers made it to the Super Bowl, with Smith as their number one receiving weapon. He caught 18 passes for 404 yards and 3 touchdowns (including one walk-off touchdown) in four playoff games, a 101 yard/game average that would be a sign of things to come. Smith’s fourth season ended in week one, when a tackle by Packers linebacker Hannibal Navies resulted in a broken leg.
  • In 2005, Smith had one of the greatest receiving seasons in history. He led the NFL in receptions, receiving yards, and receiving touchdowns: since 1970, Smith, Sterling Sharpe (1992), and Jerry Rice (1990) are the only players to win the receiving triple crown. [1]Pre-merger list: Lance Alworth (1966), Dave Parks (1965), Johnny Morris (1964), Raymond Berry (1959, 1960), Pete Pihos (1953), Elroy Hirsch (1951), Don Hutson (1936, 1941 through 1944), and … Continue reading I ranked Smith’s 2005 as the 12th best regular season by a wide receiver since 1932, and then Smith added 335 receiving yards, 38 rushing yards and five total touchdowns (including a punt return) in three playoff games.
  • In 2006, Smith missed two games early in the season, and Jake Delhomme missed three games late. The backup quarterback was Chris Weinke. How bad was Chris Weinke? Two years before the Wildcat faze landed in South Beach, the Panthers had DeAngelo Williams taking direct snaps in this game against the Falcons (Carolina completed four passes) instead of having Weinke behind center. In the 11 Smith/Delhomme games, Smith totaled 73 receptions for 1,043 yards and 8 TDs, and also rushed for sixty-one yards and a score. That’s over 100 yards from scrimmage and nearly a touchdown a game, slightly better numbers than he produced during his scorched-earth 2005 campaign.
  • In 2007, 44-year-old Vinny Testaverde, David Carr, and 23-year-old Matt Moore started 13 games for Carolina after Jake Delhomme suffered a season-ending elbow injury in week three. Smith still caught 87 passes for 1,002 yards and 7 scores (four in the first two weeks before Delhomme was hurt), and rushed for sixty-six yards. Many give Larry Fitzgerald a pass for poor quarterback play, but Smith deserves extra credit for catching 87 passes when Carolina finished 28th in passing yards and 30th in Net Yards per Attempt. Drew Carter (517 receiving yards), Jeff King (406), Keary Colbert (332) were the only other receivers of note for the ’07 Panthers, which meant all eyes were always on Smith. Perhaps a better measure of Smith’s performance that year: he was responsible for 30.5% of all Panthers receptions in 2007, second in the league only to the first edition of Jay Cutler loves Brandon Marshall (31.3%).
  • In 2008, Delhomme was back, although Smith was suspended for the first two games of the season. But his fourteen game stat line was typical Smith: 78 catches, 1,421 yards, and 6 touchdowns. His 101.5 receiving yards per game average was a league and personal best. But wait: the 2008 Panthers finished 32nd in the league in pass attempts that year. Think for a second how crazy it is to lead the league in receiving yards per game on the least-pass happy team in the NFL. The Seahawks (last year’s cellar dweller in pass attempts), even with Russell Wilson, didn’t produce an 800-yard receiver last year. In terms of receiving yards per team pass attempt, Smith’s 2005 season was the best in modern history, with Smith’s 2008 season as the second best. In the 14 games in which Smith played in 2008, the Panthers passed only 352 times, meaning Smith averaged an absurd 4.04 yards per team pass attempt.

Let’s take a step back now. From 2005 to 2008, Smith played in 48 games (including playoffs) with Delhomme as quarterback, the equivalent of three full seasons. He caught 299 passes for 4,686 yards, averaged 101.3 yards per game from scrimmage, and scored 38 touchdowns. In other words, when not playing with quarterbacks so bad that they make Jake Delhomme look like Joe Montana, Smith was producing average numbers that would be career highs for just about every receiver not named Jerry Rice. And he did it on a run-first team.

But in the team’s postseason game against the Cardinals, the clock struck midnight on Jake Delhomme’s career: the Panthers quarterback went 17/34 for 205 yards with five interceptions, and then threw 8 touchdowns against 18 interceptions in 11 starts in 2009. Delhomme ranked 31st in passer rating and ANY/A that season, ahead of only JaMarcus Russell on both counts. Smith’s production suffered — 65-982-7 — but that falls on the quarterback. Smith sat out the meaningless 2009 finale, but in the final four games of the season — with Matt Moore starting — he caught 19 passes for 378 yards and three touchdowns.

Yet things went from bad to worse for Smith. In 2010, Moore and Jimmy Clausen combined to produce some of the worst quarterbacking in NFL history. Carolina finished the season 2-14, with just 2,289 passing yards, and a pitiful 2.9 ANY/A average. As a point of reference, the 2012 Cardinals threw for 3,005 yards and averaged 3.4 ANY/A. [2]The 2010 Cardinals, who finished 31st in passing yards and 31st in ANY/A, were at 2,921 yards and 3.7 ANY/A. A 31-year-old Smith had a miserable 46-catch, 554-yard, 2-touchdown season in 14 games, but if any season deserves a pass, it’s that one.

Most thought that after 2010, Smith was washed up. Instead, he experienced a career revival after the team drafted Cam Newton. In 2011, Smith ranked 5th in the NFL in receiving yards with 1,394, even though Carolina team ranked 23rd in pass attempts. The Panthers threw even less frequently last year, but Smith still picked up 1,174 receiving yards at the age of thirty-three (and he ranked 8th in yards per team pass attempt).

Summary

Smith lost prime seasons at age 25 (broken leg), 30 (Delhomme PTSD), and 31 (Clausen/Moore dumpster fire). At age 24, he had a breakout season punctuated by an outstanding postseason. Then, from ages 26 to 29, he was historically excellent whenever he and a halfway respectable quarterback shared the field. At ages 32 and 33, he’s been very productive on run-heavy teams: only Jerry Rice and Don Maynard have gained more receiving yards at those ages than Smith.

Smith, like Jimmy Smith, may never make the Hall of Fame. But for a very long stretch he was one of the best players in the game, and only bad luck prevented him from having a more remarkable career. When Ronde Barber said that Smith — and not Rice, or Randy Moss, or Calvin Johnson — was the toughest receiver he ever faced, I wasn’t surprised. Smith, in a bigger market and with even halfway decent quarterback play (not to mention being hampered by FoxBall), would be a Hall of Fame lock.

There’s still a chance for Smith to wind up in Canton. He’s not washed up just yet, although the clock is certainly ticking on Smith’s chances of getting pregnant. After lining up inside on only 9.5% of all routes last year, new wide receivers coach (and former teammate) Ricky Proehl, is working with Smith as the team plays to use him in the slot more this season. Perhaps Smith has one more dominant season left in him. Carolina wasn’t as bad as its record was last year, so another playoff berth isn’t out of the question, either. One thing I know: I’ll enjoy watching him in 2013, because it’s not often we get a chance to watch an all-time great.

Previous “Random Perspective On” Articles:
AFC East: Buffalo Bills, Miami Dolphins, New England Patriots, New York Jets
AFC North: Baltimore Ravens, Cincinnati Bengals, Cleveland Browns, Pittsburgh Steelers
AFC South: Houston Texans, Indianapolis Colts, Jacksonville Jaguars, Tennessee Titans
AFC West: Denver Broncos, Kansas City Chiefs, Oakland Raiders, San Diego Chargers
NFC East: Dallas Cowboys, New York Giants, Philadelphia Eagles, Washington Redskins
NFC North: Chicago Bears, Detroit Lions, Green Bay Packers, Minnesota Vikings
NFC South: Atlanta Falcons, Carolina Panthers, New Orleans Saints, Tampa Bay Buccaneers
NFC West: Arizona Cardinals, San Francisco 49ers, Seattle Seahawks, St. Louis Rams

References

References
1 Pre-merger list: Lance Alworth (1966), Dave Parks (1965), Johnny Morris (1964), Raymond Berry (1959, 1960), Pete Pihos (1953), Elroy Hirsch (1951), Don Hutson (1936, 1941 through 1944), and Ray Flaherty (1932).
2 The 2010 Cardinals, who finished 31st in passing yards and 31st in ANY/A, were at 2,921 yards and 3.7 ANY/A.
{ 16 comments }

Smith has excelled despite playing for a ground-based attack

Smith has excelled despite playing for a ground-based attack.

We don’t rank quarterbacks by passing yards because “passing yards” is largely a function of pass attempts. The same is true for receiving yards, as the number of times a team passes the ball has a big impact on a receiver’s yardage total. I’ve spent some time this year looking at ways to rank wide receivers and am throwing another log on that fire today. One idea I like in theory is receiving yards per team pass attempt, as it helps to solve the problem of dealing with receivers who play on pass-heavy teams.

But there are some obvious drawbacks to that approach. There are more passing options on the field now than ever before, so it’s tough to use receiving yards per team pass attempt across eras. For example, Jim Benton in 1945 owns the record in this metric at 5.36 yards per team attempt in 1945; even if you consider that high number a byproduct of World War II, Harlon Hill averaged 4.5 yards per team pass in 1956 for the Bears. Carolina’s Steve Smith is the single-season leader in yards per team attempt since 1970. And he also holds down the #2 on that list. Smith averaged 3.48 yards per team pass attempt in 2005; three years later, he averaged 3.43 Yd/TPA (but in the 14 games he played, Smith averaged an absurd 4.04 Yd/TPA).

A few weeks ago, I ranked receivers by their percentage of team receiving yards in their best six seasons. I thought it would be fun to do the same thing with yards per team pass attempt (excluding sacks). The results are listed below for the top 200 receivers; I’ve also included the six years selected for each receiver to come up with their average. As always, you can use the search box to find your favorite receiver, and the table is sortable, too. [1]Note that I am only giving a receiver credit for his receiving yards with each team in each season, so for say, Wes Chandler, his 1981 season is undervalued.
[continue reading…]

References

References
1 Note that I am only giving a receiver credit for his receiving yards with each team in each season, so for say, Wes Chandler, his 1981 season is undervalued.
{ 18 comments }

After hearing that the other Steve Smith was retiring, Kyle on twitter asked me where Smith’s 2009 season ranked in the pantheon of anomalous wide receiver seasons. In case you forgot, take a look at Smith’s yearly production:

Year Age Tm G GS Rec Yds Y/R TD
2007 22 NYG 5 0 8 63 7.9 0
2008 23 NYG 16 4 57 574 10.1 1
2009* 24 NYG 16 15 107 1220 11.4 7
2010 25 NYG 9 7 48 529 11.0 3
2011* 26 PHI 9 1 11 124 11.3 1
2012 27 STL 9 0 14 131 9.4 0
Career 64 27 245 2641 10.8 12
4 yrs NYG 46 26 220 2386 10.8 11
1 yr PHI 9 1 11 124 11.3 1
1 yr STL 9 0 14 131 9.4 0

Smith had what looked like a breakout season in 2009, catching 107 passes for 1,220 yards and seven touchdowns. As it turned out, those numbers represent 44% of his career receptions, 46% of his career receiving yards, and 58% of his career touchdowns.

So how do we measure the biggest outlier seasons of all time? One way would be to compare each receiver’s best season to his second best season and see the difference. I used Adjusted Catch Yards — calculated as Receiving Yards plus five yards for every Reception and twenty yards for every Receiving Touchdown — to do that for every retired receiver and tight end in NFL history. The table below shows all receivers who gained at least 800 more Adjusted Catch Yards in their best season than in their second best season. For example, here’s how to read the Germane Crowell line. Crowell’s best season came with Detroit in 1999, when he caught 81 passes for 1,338 yards and 7 touchdowns. That’s equal to 1,883 Adjusted Catch Yards. In his second best year, he caught only 34 passes for 430 yards and three touchdowns, giving him only 660 ACY. That’s 1,223 Adjusted Catch Yards fewer than in his best season. Using this method, Steve Smith comes in with the sixth most anomalous season in NFL history.
[continue reading…]

{ 3 comments }