by Chase Stuart
on November 2, 2015

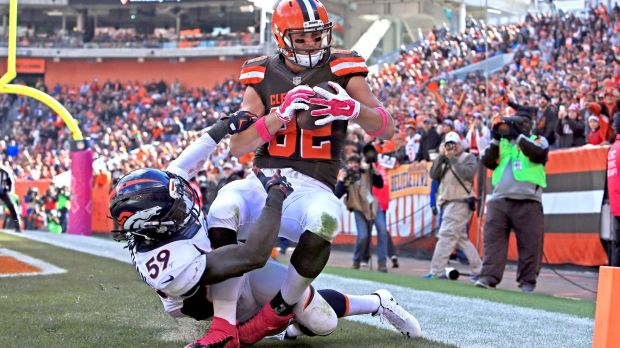
Barnidge even scored against the Broncos… twice
For seven years, Gary Barnidge was one of the hundreds of nondescript players in the NFL. He played in 92 games for two teams, but logged just 25 starts. He caught 44 passes for 603 yards, an average of less than 100 yards a season, with just three touchdowns. He averaged 6.6 yards per game during this seven-season stretch in his 20s.
But Barnidge turned 30 on September 22nd, and then transformed into one of the most dominant tight ends in the NFL. Barnidge has played in six games since his 30th birthday, and has caught 36 passes for 512 yards and 6 touchdowns.
Let’s say Barnidge finishes the season with 1,000 yards in 16 games. That would mean his career average in receiving yards per game will have jumped from 6.6 to 14.8, a pretty remarkable increase for a player in his eighth season. In fact, Barnidge would become just the third player to have his career receiving yards per game double at any point after their fifth season in a year where they gained at least 500 receiving yards.
The last player to do so is Jim Jensen, a utility football player for the Dolphins who saw time at quarterback, running back, wide receiver, and tight end in his career. In his 20s, he totaled just 414 receiving yards in seven seasons, but he broke out in 1988 with 58 catches for 652 yards and five touchdowns. [continue reading…]
Tagged as:
Browns,
Flukes,
Gary Barnidge,
Jo-Jo Townsell,
Pat Curran
{ }
by Chase Stuart
on June 5, 2013
After hearing that the other Steve Smith was retiring, Kyle on twitter asked me where Smith’s 2009 season ranked in the pantheon of anomalous wide receiver seasons. In case you forgot, take a look at Smith’s yearly production:
| Year |
Age |
Tm |
G |
GS |
Rec |
Yds |
Y/R |
TD |
| 2007 |
22 |
NYG |
5 |
0 |
8 |
63 |
7.9 |
0 |
| 2008 |
23 |
NYG |
16 |
4 |
57 |
574 |
10.1 |
1 |
| 2009* |
24 |
NYG |
16 |
15 |
107 |
1220 |
11.4 |
7 |
| 2010 |
25 |
NYG |
9 |
7 |
48 |
529 |
11.0 |
3 |
| 2011* |
26 |
PHI |
9 |
1 |
11 |
124 |
11.3 |
1 |
| 2012 |
27 |
STL |
9 |
0 |
14 |
131 |
9.4 |
0 |
| Career |
|
|
64 |
27 |
245 |
2641 |
10.8 |
12 |
| 4 yrs |
|
NYG |
46 |
26 |
220 |
2386 |
10.8 |
11 |
| 1 yr |
|
PHI |
9 |
1 |
11 |
124 |
11.3 |
1 |
| 1 yr |
|
STL |
9 |
0 |
14 |
131 |
9.4 |
0 |
Smith had what looked like a breakout season in 2009, catching 107 passes for 1,220 yards and seven touchdowns. As it turned out, those numbers represent 44% of his career receptions, 46% of his career receiving yards, and 58% of his career touchdowns.
So how do we measure the biggest outlier seasons of all time? One way would be to compare each receiver’s best season to his second best season and see the difference. I used Adjusted Catch Yards — calculated as Receiving Yards plus five yards for every Reception and twenty yards for every Receiving Touchdown — to do that for every retired receiver and tight end in NFL history. The table below shows all receivers who gained at least 800 more Adjusted Catch Yards in their best season than in their second best season. For example, here’s how to read the Germane Crowell line. Crowell’s best season came with Detroit in 1999, when he caught 81 passes for 1,338 yards and 7 touchdowns. That’s equal to 1,883 Adjusted Catch Yards. In his second best year, he caught only 34 passes for 430 yards and three touchdowns, giving him only 660 ACY. That’s 1,223 Adjusted Catch Yards fewer than in his best season. Using this method, Steve Smith comes in with the sixth most anomalous season in NFL history.
[continue reading…]
Tagged as:
Flukes,
Steve Smith
{ }