by Bryan Frye
on September 29, 2021
Adam Steele is back with his quarterback recap for week 3, 2021. Thank you, Adam, you beautiful man.
The theme of week three is the same as week two: terrible rookies. Remarkably, the eleven worst QB games this season have all been more extreme than the single best game. Anyone reading this is well aware of Justin Fields‘ spectacularly awful sack-fest performance against Cleveland. But according to DYAR, that wasn’t even the worst game this week!
Here are the week three numbers: [continue reading…]
Tagged as:
Adam Steele,
Guest Posts,
stat recap
{ }
by Chase Stuart
on September 26, 2021

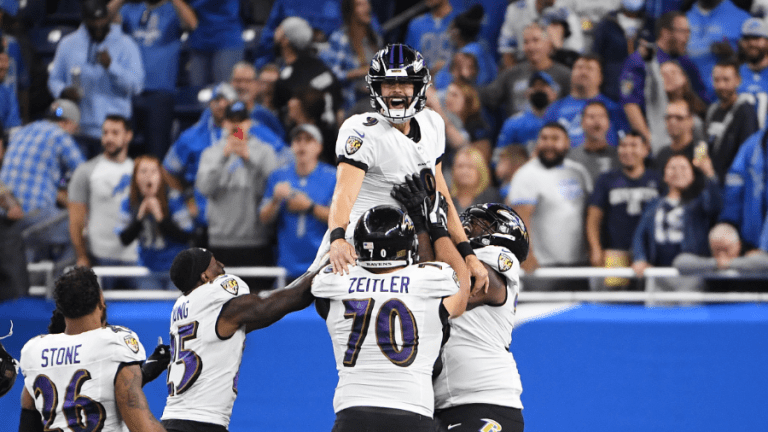
The greatest kicker ever made the greatest kick ever. His team celebrated.
In the first fifty years of pro football, long kicks were more prayers than plans. The NFL in 1934 was very different than the one we watch today; back then, you could have a player like
Glenn Presnell play quarterback, tailback, defense, and kicker… and also choose his team’s colors, as
he and his wife did with the Detroit Lions and their
Honolulu blue and silver. A few months later, Presnell made a big in-game contribution for Detroit: with the wind at his back and in front of 8,000 fans, he connected
from 54 yards away to provide the sole points in a
3-0 win over rival Green Bay. It was the longest kick in the young history of the NFL.
Kicks over 50 yards were very rare over the ensuing two decades. A few of the top kickers like Lou Groza and Ben Agajanian would connect from long range time to time, but both players maxed out at 53 yards. In 1952, the Chicago Cardinals made just two field goals all season. That year, the Cleveland Browns used a first round pick on Tennessee defensive back and running back Bert Rechichar. As a rookie, Rechichar started every game and turned six interceptions; playing in Cleveland with Groza, the idea of Rechichar ever attempting a field goal would have been silly. But in 1953, the NFL expanded and brought football back to Baltimore. As a result, Rechichar found his way on the expansion Colts. In the second quarter of the opening game, he returned an interception for a touchdown to provide the first ever points for the new team. Teammate Buck McPhail, who was the Colts regular kicker in the preseason, hit the extra point to tie the game at seven apiece. [continue reading…]
{ }
by Bryan Frye
on September 21, 2021
The following post attributes authorship to Bryan Frye, but everything under the line comes from the mind of Adam Steele. We thank him for his contributions to the site and to football discussion.
For the second week in a row, the worst quarterbacks had more extreme performances than did the best. By absolute value, the eight worst games this season have been more extreme than the single best game. I don’t have a good explanation for this other than sheer randomness. [continue reading…]
Tagged as:
Adam Steele,
Guest Posts
{ }
by Bryan Frye
on September 18, 2021
Today’s article comes from friend of the site Pierce Conboy, whom you can find in the comments as pgc or on Twitter as @pgconb. Below the line are his words. Enjoy.
Pro Football Reference is undoubtedly one of my favorite websites, so initial apologies for what amounts to taking pot shots at Approximate Value (AV) in a way that they did not intend, though consistent with how it’s widely misused by football fans at large.
This project is fairly nebulous and has no actual rules aside from a general attempt to create an extremely high AV team that would get crushed by a low AV team. I held my offense and defense below 100 AV apiece which was my arbitrary self-imposed ceiling along with keeping the average era from each of the two teams relatively close.
Here are the squads I came up with, having also consulted with Bryan, Bipedal-Moose from Reddit and cribbing from Turney and Troup articles at Pro Football Journal. [continue reading…]
Tagged as:
approximate value,
Guest Posts,
Pierce Conboy
{ }
by Bryan Frye
on September 15, 2021
The following post attributes authorship to Bryan Frye, but everything under the line comes from the mind of Adam Steele. We thank him for his contributions to the site and to football discussion.
With Chase being such a busy man, I have taken over posting weekly passing reviews during the 2021 season. While the classic ANY/A formula has served its purpose over the years, I’m going to tap into a couple of more advanced metrics to rank quarterbacks on a weekly basis.
Each week, qualifying QB’s will be scored using Football Outsiders’ DYAR and ESPN’s QBR metrics. I think this will give us a nice balance between play-by-play and charting stats, as well as a balance between counting stats and pure efficiency. The qualifying players will have their z-score calculated for DYAR and QBR then averaged to create their overall score.
Here are the week 1 results: [continue reading…]
Tagged as:
Adam Steele,
Guest Posts
{ }
by Bryan Frye
on September 4, 2021
 We’ve come to the end of the line. After several posts ranking and reranking, thinking and rethinking, quarterbacks with Total Adjusted Yards per Play and its descendants, this is the one I imagine most readers really want to see. Today, we are looking at measured performance in the regular season and playoffs combined. This is where guys like Y.A. Tittle, who feasted in the regular season but nearly always faltered in the postseason, see their positions fall down the list. Where passers like Jim Plunkett, whose regular season performances left much to be desired but went full tilt bozo in the playoffs, rise up the ranks. As far as the NFL record book is concerned, the playoffs don’t count toward career stats or win-loss totals. While I understand not rewarding players for getting to participate in more games, I can see the argument that it is equally unfair not to reward them for playing well enough to continue the march toward a championship. In order to balance those ideas, I have only counted playoff performances that measured above average by TAY/P.
A quick word on the numbers I’m using. You can find more detail in previous articles in the series, but this should be sufficient to introduce the rookies and refresh the veterans. [continue reading…]
Tagged as:
Bryan Frye,
Guest Posts,
total adjusted yards
{ }
by Bryan Frye
on September 3, 2021

We’re back at it with quarterback rankings based on Total Adjusted Yards per Play and its abundant offspring. This time, we’re getting into combined regular and postseason stats for single seasons. For the purposes of this article, I will refer to this as a full season. None of the stats are new and have been explained in what I hope is sufficient detail in previous posts. As fun as it would be to call this “the greatest quarterback seasons in history!” or something like that, I seem to have a deeply held grudge against page views and web traffic, because I can’t get behind calling it anything of the sort. This is one measure of how much quarterbacks produced in a given full season. I believe it is the best measure when trying to compare across eras in which superior metrics don’t exist, but that’s about as far as I can go on the hubris tip. Anyway, these are my numbers. I hope you like them. [continue reading…]
Tagged as:
Bryan Frye,
Guest Posts,
total adjusted yards
{ }
by Bryan Frye
on September 2, 2021
 We have already looked at postseason performance in single games and single seasons. Today, we’re finally having a go at full playoff careers. All of the metrics I am using today have been explained, in great detail, in the previous four posts, so I am not going to belabor the point here. I will, however, remind the reader that Total Adjusted Yards per Play, and its many variants, is just one approach to measuring quarterback performance. It doesn’t account for weather, and it is not adjusted for the strength of opposing defenses (not yet, at least). Moreover, these numbers are based on box score stats and do not include more granular information, like time on the clock, field position, and yards to go on a set of downs. A four yard pass on 1st and 10 is much less valuable than a four yard pass on 3rd and 3, but TAY/P treats them equally. This is by design, because the goal of this metric is to do the best possible job of comparing quarterbacks across eras. I can’t do that with DVOA or EPA/P, because the play by play data just don’t go back far enough. However, when I looked into the correlations of TAY/P with more granular metrics, the r value tended to land between .93 and .94 (even for ESPN’s QBR, with its often wacky use of win probability). This suggests, to me, that most of these issues smooth themselves over in the long run. [continue reading…]
Tagged as:
Bryan Frye,
Guest Posts,
total adjusted yards
{ }
by Bryan Frye
on September 1, 2021
Yesterday, we looked at playoff performance in individual playoff games, as measured by Total Adjusted Yards per Play (and its copious derivatives). Today, I’m taking the next logical step and looking at performance over a full postseason in any given year. In other words, instead of examining who produced the most in the Super Bowl last year, I am determining who produced the most over the entire 2020 playoffs. By that, I mean who produced the most as measured by this particular set of numbers. They happen to be my preferred numbers for comparing across eras, but your mileage may vary.
For the uninitiated, here is a brief rundown of the metrics used:
Total Adjusted Yards per Play is like ANY/A with rushing included. It is (pass yards -sack yards + rush yards + 20*pass TDs + 20*rush TDs – 45*interceptions – 25*fumbles) / (passes + sacks + rushes). This version of TAY/P doesn’t include first downs, since I only have reliable first down data back to 1991 and want to make the playing field as level as possible when comparing back to 1936. [continue reading…]
Tagged as:
Bryan Frye,
Guest Posts,
total adjusted yards
{ }