≡ Menu

Where do teams find new head coaches?

Where did you say I could get some bond paper?

Where did you say I could get some bond paper?

Within twenty-four hours of the end of the regular season, Rob Chudzinski, Leslie FrazierGreg Schiano, Jim Schwartz, and Mike Shanahan were all fired. A couple of more head coaches may join them this week, but all these new openings lead to one question: who will replace them?

From 1990 to 2013, 159 new head coaches were hired. Twelve of them were given full-time coaching duties after a successful stint as interim head coach. [1]The list: Romeo Crennel (hired as head coach of the 2012 Chiefs), Jason Garrett (2011 Cowboys), Leslie Frazier (2011 Vikings), Tom Cable (2009 Raiders), Mike Singletary (2009 49ers), Mike Tice (2002 … Continue reading

For the other 147 coaches, I grouped them into seven buckets based on the title they held in the season immediately preceding the year they were named head coach: [2]With three exceptions. Steve Mariucci made his name as Brett Favre’s quarterbacks coach from 1992 to 1995, and then became the head coach at Cal in 1996. He was hired by San Francisco in 1997, … Continue reading: Retread (indicating that this was not the first NFL head coaching job for the newly hired head coach), Offensive Coordinator, Defensive Coordinator, College Head Coach, Quarterbacks coach, Offensive Line coach, and Other.

As you can see, the retread approach was the most popular, offensive and defensive coordinators were the next targets, while college coaches filled only 10% of the vacancies: [continue reading…]

References

References
1 The list: Romeo Crennel (hired as head coach of the 2012 Chiefs), Jason Garrett (2011 Cowboys), Leslie Frazier (2011 Vikings), Tom Cable (2009 Raiders), Mike Singletary (2009 49ers), Mike Tice (2002 Vikings), Dick LeBeau (2001 Bengals), Dave McGinnis (2001 Cardinals), Bruce Coslet (1997 Bengals), Jeff Fisher (1995 Oilers), Richard Williamson (1991 Buccaneers), Art Shell (1990 Raiders).
2 With three exceptions. Steve Mariucci made his name as Brett Favre’s quarterbacks coach from 1992 to 1995, and then became the head coach at Cal in 1996. He was hired by San Francisco in 1997, but I’m labeling him as QB Coach hire and not a college coach hire. Similarly, John Harbaugh made his name as a special teams coach, but his final season with the Eagles was as a defensive backs coach. But I think it’s more accurate to label him special teams coaching hire. And Barry Switzer was actually retired when the Cowboys hired him, but it felt appropriate to label him a college coach.
{ 7 comments }

2013 Team NY/A and ANY/A Differential Data

Just a quick data dump here for those inquiring minds. Here are the leaders in NY/A differential, which is simply Net Yards per Attempt (which incorporates sack data) for each team minus the Net Yards per Attempt allowed by that team. Seattle ranks #1 in NY/A differential, as Russell Wilson‘s offense has averaged 6.97 NY/A (which ranks 6th) and the defense has allowed just 4.85 NY/A (which ranks first), giving them a +2.13 NY/A differential.

RkTmNY/ANY/A RkNY/A ANY/A A RkNY/A Diff
1Seattle Seahawks6.9764.8512.13
2Cincinnati Bengals6.7295.0921.63
3Denver Broncos7.8316.22171.61
4New Orleans Saints7.1545.5871.56
5Arizona Cardinals6.51115.5560.96
6Philadelphia Eagles7.4236.56220.86
7San Francisco 49ers6.53105.6890.86
8Pittsburgh Steelers6.39125.88100.51
9San Diego Chargers7.5427.1310.44
10Carolina Panthers5.9205.550.39
11Detroit Lions6.8286.53200.29
12New York Giants5.91195.6380.28
13Green Bay Packers6.9476.79250.15
14Buffalo Bills5.44295.2930.15
15New England Patriots6.12156110.12
16Chicago Bears7.0356.93270.1
17Cleveland Browns5.53275.4940.05
18Tennessee Titans6.13146.2215-0.08
19Indianapolis Colts6.07166.4219-0.35
20Houston Texans5.65256.0513-0.4
21Kansas City Chiefs5.69246.214-0.51
22Miami Dolphins5.47286.0312-0.56
23Dallas Cowboys6.37136.9829-0.62
24New York Jets5.56266.318-0.73
25Baltimore Ravens5.38306.2216-0.84
26Minnesota Vikings5.81216.6723-0.86
27St. Louis Rams5.77226.7524-0.98
28Oakland Raiders5.93186.9728-1.04
29Atlanta Falcons6.04177.1132-1.08
30Washington Redskins5.74237.0830-1.35
31Jacksonville Jaguars5.36316.8126-1.45
32Tampa Bay Buccaneers5.03326.5421-1.51

[continue reading…]

{ 8 comments }

Woody Johnson, John Idzik, and Rex Ryan. Source: NY Daily News.

Moments after the Jets defeated the Miami Dolphins on Sunday, it was announced that Rex Ryan would return as New York’s head coach in 2014. That was a surprising development: just one week ago, it was reported that Ryan told the team he believed he would be fired at the end of the season. Most observers assumed that John Idzik, hired as the team’s general manager in January, would choose to bring in his own head coach in 2014. (You may recall that Woody Johnson mandated that Ryan be retained for the 2013 season, which already made it a slightly unusual situation.)

Which gets us to a the question I want to examine today: how often do new general managers stick with the coaches they inherit? A simple idea, but a difficult one to research. For some teams, identifying the man is charge is easy; for others, it’s about as easy as identifying the starting running back. I’ve done my best, but I expect some errors or disagreements with the labels I’ve used. [1]Here’s an examples of the difficulty of classification: In March 2008, the Broncos fired general manager Ted Sundquist. He was quasi-replaced by Jim Goodman, although in reality Mike Shanahan … Continue reading Marching onward…..

Since 1995, excluding expansion teams, there have been 95 new general managers hired in the NFL. Slightly more than half of those GMs (50) hired new head coaches, served as joint general manager/head coach, or were brought in with a new coach together as part of a regime change. The table below shows the 50 new general managers, along with the coach prior to and immediately after the hiring of the executive.

TeamYearGMGM TitleOld CoachNew Coach
BUF2013Doug WhaleyGeneral ManagerChan GaileyDoug Marrone
CLE2013Michael LombardiGeneral ManagerPat ShurmurRob Chudzinski
ARI2013Steve KeimGeneral ManagerKen WhisenhuntBruce Arians
JAX2013David CaldwellGeneral ManagerMike MularkeyGus Bradley
KAN2013John DorseyGeneral ManagerRomeo CrennelAndy Reid
SDG2013Tom TelescoGeneral ManagerNorv TurnerMike McCoy
IND2012Ryan GrigsonGeneral ManagerJim CaldwellChuck Pagano
OAK2012Reggie McKenzieGeneral ManagerHue JacksonDennis Allen
STL2012Les SneadGeneral ManagerSteve SpagnuoloJeff Fisher
OAK2011Hue JacksonHead Coach/de facto General ManagerTom CableHue Jackson
SEA2010John SchneiderGeneral ManagerJim MoraPete Carroll
BUF2010Buddy NixExecutive VP/General ManagerDick JauronChan Gailey
WAS2010Bruce AllenExecutive VP/General ManagerJim ZornMike Shanahan
CLE2009George KokinisGeneral ManagerRomeo CrennelEric Mangini
DEN2009Brian XandersGeneral ManagerMike ShanahanJosh McDaniels
KAN2009Scott PioliGeneral ManagerHerman EdwardsTodd Haley
STL2009Billy DevaneyGeneral ManagerScott LinehanSteve Spagnuolo
TAM2009Mark DominikGeneral ManagerJon GrudenRaheem Morris
ATL2008Thomas DimitroffGeneral ManagerBobby PetrinoMike Smith
MIA2008Jeff IrelandGeneral ManagerCam CameronTony Sparano
BUF2006Marv LevyGeneral Manager/VP of Football OperationsMike MularkeyDick Jauron
HOU2006Rick SmithExecutive VP/General ManagerDom CapersGary Kubiak
MIN2006Rick SpielmanVP of Player Personnel/de facto General ManagerMike TiceBrad Childress
NYJ2006Mike TannenbaumGeneral ManagerHerman EdwardsEric Mangini
STL2006Jay ZygmuntPresident of Football Operations/General ManagerMike MartzScott Linehan
CLE2005Phil SavageGeneral ManagerButch DavisRomeo Crennel
MIA2005Randy MuellerGeneral ManagerDave WannstedtNick Saban
SFO2005Scot McCloughanVP of Player PersonnelDennis EricksonMike Nolan
ATL2004Rich McKayGeneral ManagerDan ReevesJim Mora
JAX2003James HarrisVP of Player PersonnelTom CoughlinJack Del Rio
CAR2002Marty HurneyGeneral ManagerGeorge SeifertJohn Fox
MIN2002Rob BrzezinskiVP of Football OperationsDennis GreenMike Tice
WAS2002Vinny CerratoDirector of Player PersonnelMarty SchottenheimerSteve Spurrier
BUF2001Tom DonahoePresident/General ManagerWade PhillipsGregg Williams
DET2001Matt MillenPresidentBobby RossMarty Mornhinweg
NYJ2001Terry BradwayGeneral ManagerAl GrohHerman Edwards
WAS2001Marty SchottenheimerHead Coach/de facto General ManagerNorv TurnerMarty Schottenheimer
NOR2000Randy MuellerGeneral ManagerMike DitkaJim Haslett
NWE2000Bill BelichickHead Coach/de facto General ManagerPete CarrollBill Belichick
STL2000Charley ArmeyGeneral ManagerDick VermeilMike Martz
CAR1999George SeifertHead Coach/de facto General ManagerDom CapersGeorge Seifert
SEA1999Mike HolmgrenHead Coach/Executive VP/General ManagerDennis EricksonMike Holmgren
ATL1997Dan ReevesHead Coach/de facto General ManagerJune JonesDan Reeves
NWE1997Bobby GrierDirector of Player PersonnelBill ParcellsPete Carroll
NYJ1997Bill ParcellsHead Coach/General ManagerRich KotiteBill Parcells
STL1997Dick VermeilHead Coach/General ManagerRich BrooksDick Vermeil
ARI1996Bob FergusonVP of Player PersonnelBuddy RyanVince Tobin
NYJ1995Rich KotiteHead Coach/de facto General ManagerPete CarrollRich Kotite
STL1995Steve OrtmayerGeneral ManagerChuck KnoxRich Brooks
SEA1995Randy MuellerVP of Football Operations/de facto General ManagerTom FloresDennis Erickson

[continue reading…]

References

References
1 Here’s an examples of the difficulty of classification: In March 2008, the Broncos fired general manager Ted Sundquist. He was quasi-replaced by Jim Goodman, although in reality Mike Shanahan had most of the power before and after Goodman’s promotion. It was owner Pat Bowlen who made the call to fire Shanahan after 2008, and Goodman a couple of months after that. In between the Shanahan and Goodman firings, Josh McDaniels was hired as head coach. After the Goodman firing, Brian Xanders was promoted to GM. There’s no clean way to do it, but I labeled Goodman as “retaining” Shanahan but Xanders as hiring a hew head coach, since he worked with Goodman on the McDaniels hire.
{ 6 comments }

Your Ultimate Week 17 Preview Guide

Thanks to the NFL’s decision to pit division rivals against each other in week 17, we have a full slate of entertaining games today.

Week Day Date VisTm HomeTm Time
17 Sun December 29 Carolina Panthers @ Atlanta Falcons 1:00 PM
17 Sun December 29 Baltimore Ravens @ Cincinnati Bengals 1:00 PM
17 Sun December 29 New York Jets @ Miami Dolphins 1:00 PM
17 Sun December 29 Cleveland Browns @ Pittsburgh Steelers 1:00 PM
17 Sun December 29 Jacksonville Jaguars @ Indianapolis Colts 1:00 PM
17 Sun December 29 Detroit Lions @ Minnesota Vikings 1:00 PM
17 Sun December 29 Washington Redskins @ New York Giants 1:00 PM
17 Sun December 29 Houston Texans @ Tennessee Titans 1:00 PM
17 Sun December 29 Buffalo Bills @ New England Patriots 4:25 PM
17 Sun December 29 Tampa Bay Buccaneers @ New Orleans Saints 4:25 PM
17 Sun December 29 Green Bay Packers @ Chicago Bears 4:25 PM
17 Sun December 29 San Francisco 49ers @ Arizona Cardinals 4:25 PM
17 Sun December 29 Denver Broncos @ Oakland Raiders 4:25 PM
17 Sun December 29 Kansas City Chiefs @ San Diego Chargers 4:25 PM
17 Sun December 29 St. Louis Rams @ Seattle Seahawks 4:25 PM
17 Sun December 29 Philadelphia Eagles @ Dallas Cowboys 8:30 PM

Just three games — Detroit at Minnesota, Washington at New York, and Houston at Tennessee — don’t carry playoff implications. And even those three games have something to watch — a Texans loss gives Houston the number one pick, London Fletcher in his final NFL game, and a chance to see if either Jim Schwartz or Leslie Frazier is fired in the parking lot after the game. But now, some random thoughts on the other 13 games.

Carolina (-5.5) at Atlanta: The Panthers secure a bye with a win, and could even get the 1 seed if it comes with a Seahawks loss and a 49ers win. Falcons fans may want Jadeveon Clowney, but Atlanta will need help moving into the top five even with a loss. The Falcons are 3-4 at home, the Panthers 4-3 on the road, so this game should be closer than you think. It’s also the last chance we’ll get to watch Tony Gonzalez. A Carolina loss and a Saints win puts the Panthers on the road next week.

Baltimore at Cincinnati (-6.5)

New York Jets at Miami (-5.5)

Cleveland at Pittsburgh (-7.0)

The 6 seed in the AFC will be affected by these three games.  A win by either Baltimore, Miami, or San Diego knocks out the Steelers, so putting Pittsburgh on at 1:00 makes sense. But unless both the Ravens and Dolphins lose, the Chargers game in the afternoon will be meaningless. Baltimore is a heavy underdog in Cincinnati, as the Bengals are still playing for a bye and/or the right to avoid Kansas City in the first round of the playoffs.

We would get a Baltimore/Cincinnati rematch in Cincinnati next week if (a) Baltimore wins, Miami OR San Diego loses, and the Colts lose, or (b) Cincinnati, New England, the Jets, the Steelers, and the Chiefs all win. So a rematch isn’t too likely, but is possible. Unless the Patriots lose, this game isn’t too important for Cincinnati, but the team would enjoy knocking the Ravens out of the postseason.
[continue reading…]

{ 2 comments }

A special bonus article this week at the New York Times, as I took a look at the incredible career of London Fletcher.

On Sunday, Fletcher, a Washington captain, will play in his 256th straight game, the third-longest streak in N.F.L. history for a player who was not a kicker, behind only Brett Favre’s 299 games and Jim Marshall’s 282.

Having somehow survived for 16 seasons without sustaining any kind of disabling injury, all while playing amid the chaos and attrition rates that are parts of an inside linebacker’s life, Fletcher has said he plans to call it quits after Sunday’s game while he is still ahead.

By the end of this week, though, he was hedging a bit, not quite sure he was truly ready to walk away.

Five weeks ago, Fletcher moved ahead of Eugene Robinson, a safety for 16 seasons, and became the career leader in games played by an undrafted defensive player. Earlier this season, he broke Derrick Brooks’s record of 208 consecutive starts at linebacker. On Sunday, Fletcher will start his 216th consecutive game. He has, in effect, dodged a million bullets in a game that is tough for any player to endure physically.

You can read the full article here. In addition, related readings on Fletcher can be found here and here.

{ 2 comments }

Advanced NFL Podcast – Appearance #2

In early October, I went on the Advanced NFL Podcast with host Dave Collins.  This time of year is fruitful for good discussion, so Dave invited me back on the show. In Dave’s words, we began

by breaking down the historical context of Peyton Manning’s single season passing touchdown record. They then cover the Carolina Panthers and break down the changes they’ve made over the past year, the storylines surrounding Cam Newton, and how overall team performance can sometimes obfuscate an individual player’s development

Next, Chase takes to his soapbox to make the case that the Jets should fire Rex Ryan and explains how retaining him would set a unique historical precedent. Next, they turn their sights to the Giants and discuss what to make of Eli Manning’s interception spike.
The episode concludes with a look ahead to the week 17 Bears/Packers and Cowboys/Eagles matchups. Chase weighs in on what he’s most excited for in this year’s playoffs, and why playing a Superbowl outdoors might actually be more fair than playing in a dome.

You can listen to it here, and can subscribe to the podcast on iTunes here.

{ 2 comments }

Buffalo just sacked Tannehill again

Buffalo just sacked Tannehill again.

Did you happen to notice the stat line produced by Ryan Tannehill last week? He completed just 10 of 27 passes for only 82 yards in a 19-0 loss to the Bills. A 37% completion rate and a 3.0 yards per attempt average are ugly numbers in their own right, but Tannehill was also sacked seven times for 46 yards. That means on 34 dropbacks, he produced…. 36 yards.

Tannehill did not throw an interception in the 19-0 shutout, so perhaps that’s why this game has gone under the radar. But a quarterback does not get to fare so poorly and avoid coverage of it at Football Perspective. Can you imagine if Tony Romo or Jay Cutler had a game like this? Why aren’t people talking about this? Tannehill averaged One Net Yard per Attempt over THIRTY FOUR DROPBACKS!?! Tannehill’s NY/A average dropped from 5.72 to 5.46, an unheard of drop this late in the season.

To be fair, Tannehill’s lack of interceptions does make the performance less horrible. But today, I want to just focus on yards produced on pass attempts (including sacks). Lots of good quarterbacks have had bad days when it comes to interceptions, but how often does a quarterback struggle so much on nearly every play for 34 plays?

Let’s provide some context. This season, the average pass play (including sacks) has produced 6.217 net yards, which means you would expect 34 dropbacks to produce 211.4 yards. That means Tannehill’s performance produced 175.4 net yards under average. Among quarterbacks with at least 15 pass attempts in a game, that’s the 25th worst performance since 1960, and the 7th worst performance since 2000.

The table below shows the worst 250 performances since 1960, although the only game I calculated for 2013 was Tannehill’s. The worst performance using this formula goes to Green Bay’s Lynn Dickey in 1981 against the Jets in week 16. He completed just 12 of 33 passes for 96 yards (I’ve included the TD and INT numbers even though they are not part of the calculation), and was sacked an incredible 9 times for 57 yards (Mark Gastineau, Joe Klecko, and Marty Lyons each had multiple sacks). So on 42 dropbacks, Dickey gained 39 yards, for an average of 0.9 NY/A. The NFL average that season was 6.02 NY/A, which means Dickey produced 214 Net Yards below average.
[continue reading…]

{ 9 comments }

2013 Pro Bowlers announced

This year, the NFL has eliminated the AFC/NFC distinction, and just selected Pro Bowlers at each position. The results:

Quarterback: Tom Brady, Patriots; Drew Brees, Saints; Peyton Manning, Broncos; Cam Newton, Panthers; Philip Rivers, Chargers; Russell Wilson, Seahawks.

No surprises here. With a full season, Nick Foles and Aaron Rodgers would have made this a more competitive race.

Running back: Jamaal Charles, Chiefs; Matt Forte, Bears; Frank Gore, 49ers; Marshawn Lynch, Seahawks; LeSean McCoy, Eagles; Adrian Peterson, Vikings.

Six of the seven rushing leaders, with Gore jumping ahead of Alfred Morris (fifth in rushing yards).

Fullback: Marcel Reece, Raiders; Mike Tolbert, Panthers.

Clear-cut picks if you read my Fullback Report.

Wide receiver: Antonio Brown, Steelers; Dez Bryant, Cowboys; Josh Gordon, Browns; A.J. Green, Bengals; Andre Johnson, Texans; Calvin Johnson, Lions; Brandon Marshall, Bears; Demaryius Thomas, Broncos.

Six of the top 7 leaders in receiving yards made it, with Alshon Jeffery missing out. Marshall is 11th in receiving yards but in the top seven in both receptions and receiving touchdowns, while Bryant ranks 15th in receiving yards but is tied for the lead among wide receivers in touchdowns.

Tight End: Jordan Cameron, Browns; Vernon Davis, 49ers; Jimmy Graham, Saints; Julius Thomas, Broncos.

If Cameron had 16 more receiving yards, these would be the top four tight ends in fantasy points. Instead it’s four of the top five, overlooking Tony Gonzalez. There’s a good chance Gonzalez makes his 14th Pro Bowl by the time the game comes around.

Tackle: Branden Albert, Chiefs; Jason Peters, Eagles; Tyron Smith, Cowboys; Joe Staley, 49ers; Joe Thomas, Browns; Trent Williams, Redskins.
[continue reading…]

{ 2 comments }

Week 16 Game Scripts

Week 16 saw some very large Game Scripts in some very important games. The Eagles-Bears showdown turned into a laugher, as Philadelphia posted the 3rd best Game Script of the season. The New England/Baltimore rivalry is famous for producing close games, but the Patriots embarrassed the Ravens on their home field. New England scored a couple of late defensive touchdowns to boost the final margin of victory, but the team still held an average lead of 15.2 points. Against Minnesota, Andy Dalton channeled his inner Ken Anderson — which seems to happy every few weeks — and helped the Bengals annihilate the Vikings.

The table below shows the week 16 Game Scripts data. As always, you can view the results from every game this year at this page.

WinnerH/RLoserBoxscorePFPAMarginGame ScriptPassRunP/R RatioOp_POp_ROpp_P/R Ratio
PHICHIBoxscore54114322.6273642.9%441871%
CINMINBoxscore42142817.4403751.9%311764.6%
NWE@BALBoxscore4173415.2283445.2%462763%
BUFMIABoxscore190198.8265034.2%401276.9%
DEN@HOUBoxscore3713246.8521874.3%402660.6%
IND@KANBoxscore237166383452.8%331963.5%
SDGOAKBoxscore2613133.7303645.5%371768.5%
STLTAMBoxscore2313103.1213935%332358.9%
NYG@DETBoxscore232031.2432068.3%443655%
DAL@WASBoxscore242311292355.8%362856.3%
PIT@GNBBoxscore383170.7292950%403057.1%
ARI@SEABoxscore171070.2274338.6%312060.8%
CARNORBoxscore171340.2261859.1%513063%
NYJCLEBoxscore241311-0.2363948%422166.7%
SFOATLBoxscore342410-1.1243044.4%492071%
TEN@JAXBoxscore20164-1.9294439.7%362163.2%

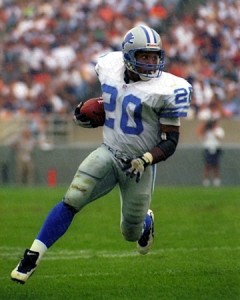
Five teams posted a negative Game Script and called a more run-heavy game plan than their opponent. One of the most surprising instances came in Detroit, where the Lions held an average lead of 1.2 points. Detroit is famous for their pass-happy ways, but while Matthew Stafford threw 42 passes, the Lions passed on only 55% of their plays. The Giants are wont to keep Eli Manning under wraps (for good reason), but actually passed on 68.3% of their plays. There was a reason for New York’s pass-happy approach: with David Wilson and Brandon Jacobs out for the year, once Andre Brown suffered a concussion, even Tom Coughlin was forced to put the game in Manning’s hands. After all, the alternative was handing off to Bear Pascoe.

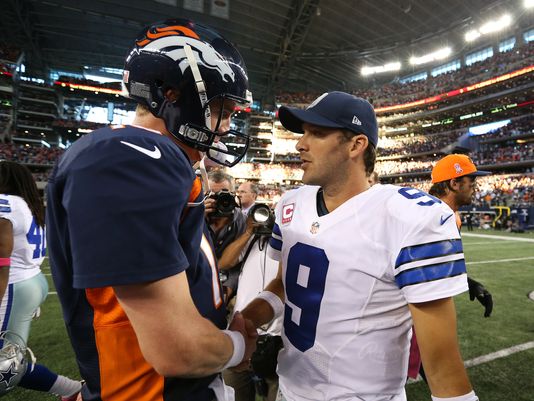
Less surprising was seeing Peyton Manning and the Broncos pass on three out of every four plays despite holding an average lead of 6.8 points. The Texans won the all unimportant time of possession battle, but Manning threw for 400 yards and 4 touchdowns.

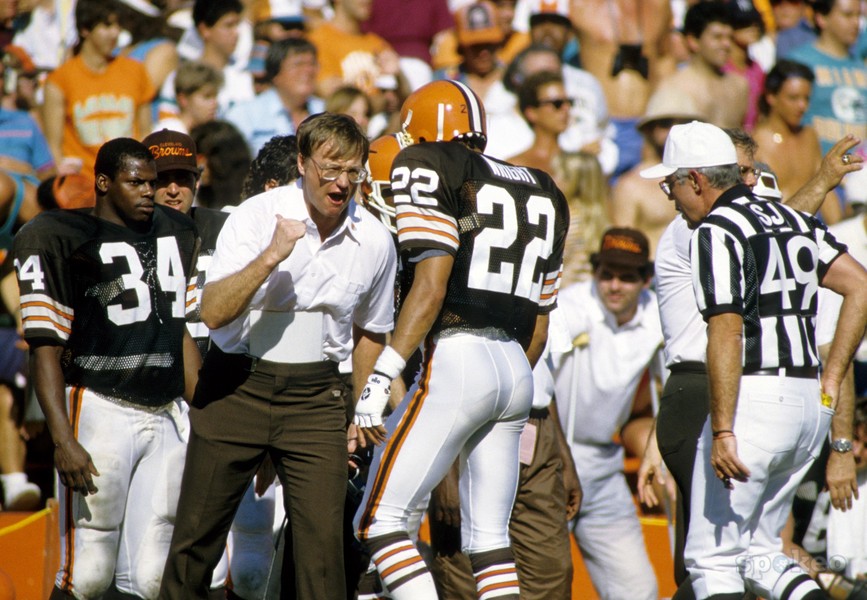
Also not surprising: the run-heavy Jets running on 48% of their plays against the pass-happy Browns. New York just barely lost the Game Script battle, and Cleveland predictably passed on two out of every three plays. The same can be said for run-heavy San Francisco (44.4%) against pass-happy Atlanta (71%), in a game that the Falcons actually led by, on average, 1.1 points.

In Jacksonville, the game was pretty even — Tennessee won the game but posted a Game Script of -1.2. But the Titans running game was rolling — both Chris Johnson and Shonn Greene rushed for 90 yards, leaving Ryan Fitzpatrick to play the role of caretaker. For the Jaguars, the pass-heavy game plan consisted of a lot of short, safe throws. That’s been the norm for Chad Henne, who ranks last on the season in both air yards per pass attempt (6.55) and average air yards on completions (4.76) according to NFLGSIS.

One team not on the list is Dallas, who held an average lead of 1.0 points against Washington…. and actually ran more frequently than one of the most run-heavy teams in the NFL! This was a severe case of overreaction to the pass-happy ways of last week. Dallas has played six games this year where the Game Script was between -1.5 and 1.5 points. In four of those games, Dallas passed on 70% of their plays, including an 86% rate against Minnesota. Having a close to 50/50 split is way out of the norm for Dallas in close games: in addition to the game last week, the only other time where the Cowboys were below 70% came in another run-heavy game plan against Detroit in week 8.

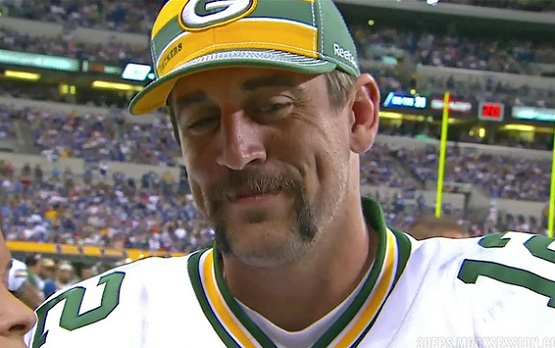
One thing that will be fascinating to watch is how pass-heavy the game plan is with Kyle Orton instead of Tony Romo this week. The Cowboys very pass-heavy on the season, of course, but Dallas also has a tendency for run-heavy games every once in a while (the Lions games, and the Raiders/Bears games right before the Packers meltdown). Without Romo, which way will they go?

Game Scripts Standings

We can also calculate Game Scripts standings for the season. As it turns out, the 49ers have held an average lead of 5.6 points, placing them number one in the Game Script standings. I was pretty shocked to discover that, but San Francisco has outscored opponents by 91 points in the first half of games this year, second to only Kansas City (93). The 49ers also lead the league in scoring margin through three quarters. One reason for that is San Francisco has allowed a league-low 36 points in the third quarter this year, and also leads the NFL in points allowed through three quarters.

The Broncos, on the other hand, have been a bit of a second half team in 2013. It’s not like Denver is bad in the first half, but the Broncos have already set the record (previously held by last year’s team) for points scored in the second halves of games with 315!

After calculating the Game Script scores for each team, I then adjusted the numbers for strength of schedule. The 49ers still come out as number one; here’s how to read the table below. San Francisco has held an average lead of 5.6 points, has faced a schedule that is 0.5 points tougher than average, giving the 49ers a schedule-neutral Game Script of 6.1.

RkTeamGSSOSAdj. GSRecord
1SFO5.60.56.111-4
2SEA5.10.65.712-3
3CAR4.10.9511-4
4DEN5.4-0.64.812-3
5KAN4.4-0.93.511-4
6NOR1.31.42.710-5
7ARI0.91.32.210-5
8PHI2.8-0.829-6
9CIN2.9-1.41.510-5
10TAM-0.31.71.44-11
11STL0.11.21.37-8
12NWE1.5-0.31.311-4
13DAL1.9-0.71.28-7
14SDG1.7-0.51.28-7
15ATL-1.41.2-0.24-11
16DET0.8-1.1-0.37-8
17BUF-0.3-0.3-0.66-9
18GNB0.3-0.9-0.67-7-1
19MIA-0.80.2-0.78-7
20TEN-10-16-9
21IND-1.70.6-1.210-5
22BAL-0.5-1.1-1.68-7
23PIT-0.8-1.1-1.97-8
24CLE-1.2-1-2.24-11
25OAK-1.7-0.5-2.24-11
26NYG-3.60.8-2.86-9
27CHI-2-0.9-2.98-7
28MIN-3-0.4-3.44-10-1
29NYJ-3.90.1-3.87-8
30HOU-4.50.6-3.92-13
31JAX-5.80.6-5.24-11
32WAS-6.10.6-5.53-12

One name that’s surprising at the bottom of that list is Chicago. After all, the Bears have a winning record and can win the NFC North with a win this weekend. But Jay Cutler has led 3 fourth quarter comebacks, and Josh McCown led one more, and those games account for half of the team’s wins. The Eagles game was obviously a disaster, bringing down the team’s rating, but Chicago also posted a -11.2 against St. Louis, a -10 against the Lions, and a -9.2 in a home loss to the Saints. And the Bears have posted a Game Script of +3.0 or better just three times all season.

{ 0 comments }

How quaint: a quarterback taking snaps form under center

How quaint: a quarterback taking snaps form under center.

With one game remaining, Peyton Manning has already set the new single-season record with 51 passing touchdowns (two months ago, I projected Manning to finish the season with 52 touchdowns). But all records must be viewed in their environment, and NFL teams are averaging 1.58 touchdown passes per team game this year, the highest average since 1948. In 1984, the year Dan Marino threw 48 touchdowns, teams averaged 1.37 touchdown passes per game.

So which season is more impressive? That’s a complicated question, and one that could be answered in many ways. In my view, the question boils down to which performance was more outstanding; in mathematical terms, we could define that as which season was farthest from the mean.

To make life a little simpler, I’m going to analyze this question on the team level, meaning we will compare “Denver 2013” to “Miami 1984.” Of course, this approach is preferable in many ways, since when we praise Manning we really mean “Manning with his offensive line and his coaching staff throwing to Demaryius Thomas, Wes Welker, Eric Decker, and Julius Thomas.” And “Marino in 1984” means “Marino and Mark Clayton and Mark Duper and Dwight Stephenson and Ed Newman.”

This season, the Broncos have 51 touchdown passes. The other 31 teams (through 15 games) are averaging 22.8 passing touchdowns, which means Denver is 28.2 touchdowns above average. The standard deviation of the 32 teams in passing touchdowns is 7.4; as a result, we can say that the Broncos are 3.84 standard deviations above average, also known as their Z-score.

In 1984, the other 27 teams (through 16 games) averaged 21.0 touchdowns, while the Dolphins threw 49 scores (Jim Jenson, a college quarterback who played receiver for Miami, threw a 35-yard touchdown to Duper against the Patriots off a Marino lateral). The standard deviation that season in touchdown passes at the team level was 7.5, which gives Miami a Z-score of 3.72 in 1984.

So the Broncos this season have been more extraordinary, at least by this measure. One nice thing about using the Z-score is we don’t need to adjust for games played. I went ahead and calculated the Z-scores for every team since 1932. The current Broncos are #1, with the ’84 Dolphins in second place. The third place team isn’t the Tom Brady 2007 Patriots; that team is down at #7, because the standard deviation in passing touchdowns among the league’s 32 teams was 8.8 that season. Instead, the third slot goes to the 1986 Dolphins. Few remember that Marino threw 44 touchdowns that season; add in Don Strock’s two touchdowns, a lower league average and a smaller standard deviation, and those Dolphins get a Z-score of 3.70.

Let’s look at the top 100 teams using this metric. The 2004 Colts ranked fifth (if you click on the cell in the team column, the link takes you to that team’s PFR page) in Z-score. That year, Indianapolis threw 51 touchdowns, while the other 31 teams averaged 21.97 touchdown passes. That means Indianapolis was 29.03 touchdowns above average, the highest production above average to date. But that year, the standard deviation among the 32 teams in passing touchdowns was 8.53, giving the Colts a Z-score of “only” 3.41; that’s why they’re 5th, not first.
[continue reading…]

{ 38 comments }

New York Times: Post-Week 16, 2013

Black Monday is just four days away. This week at the New York Times, I look at which coaches are likely to be coaching their last games with their current franchises on Sunday.

Last season, seven N.F.L. coaches were fired on the day after the regular season, also known as Black Monday, with Jacksonville dismissing Mike Mularkey a couple of weeks later. This season, Houston has already fired Gary Kubiak, and as many as 10 more coaches could be fired Monday.

Likely to be Fired

After an 0-8 start, it seemed inevitable that Greg Schiano would not coach the Buccaneers in 2014. Then Tampa Bay won four of its next five games, becoming just the third team since 1978 to start both 0-8 and 4-9. But with two straight losses, Tampa Bay has lost any late-season momentum, and with it, any seeming justification for retaining Schiano.

After trading for Darrelle Revis and signing Dashon Goldson, the Bucs were a popular pick to win 10 games and contend for the Super Bowl. But with the Panthers and the Saints on the rise, and the Falcons just a year removed from an N.F.C. championship game appearance, Tampa Bay has quickly become an afterthought in the division. Even though he has been there for just two years, expect Schiano to be one of the first victims on Black Monday. The Buccaneers have won just 5 of their last 21 games.

When the Lions hired Jim Schwartz, the team had just finished an 0-16 season. Expectations were low and patience was high. Schwartz won 2, then 6, then 10 games in his first three years in Detroit, but the team has fallen apart since a playoff appearance in 2011. Last season, the Lions finished 4-12, and Schwartz drew criticism for fielding one of the least-disciplined teams in the N.F.L.

Detroit has become known for late-game implosions. Over the last two seasons, it is a league-worst seven games below .500 (6-13) in games decided by 7 or fewer points. This year, after a 6-3 start and injuries to the N.F.C. North quarterbacks Jay Cutler and Aaron Rodgers, the division seemed to be there for the taking for the Lions. Instead, a 1-5 stretch has eliminated them before the final week of the season.

Minnesota Coach Leslie Frazier is low on job security, too. Adrian Peterson’s 2,000-yard campaign helped lead the Vikings to 10 wins in 2012, but the rest of Frazier’s tenure has been underwhelming. In fact, those 10 wins represent half of Frazier’s win total in three and a half seasons in Minnesota. With double-digit losing seasons in two of the last three years, bringing back Frazier would be tough to take for increasingly frustrated Vikings fans.

Perhaps the most puzzling part of the Minnesota decline has been in the secondary. Frazier was a defensive backs coach in Philadelphia and Indianapolis and a defense coordinator in Cincinnati before coming to the Vikings as the defensive backs coach in 2007. But Minnesota ranks last in points allowed, passing yards allowed and passing touchdowns allowed. If Minnesota allows two passing touchdowns to the Lions on Sunday, that will bring the season total to 38 and set a post-merger N.F.L. record.

You can read the full article here.

{ 2 comments }

The Simple Rating System is a many-splendored thing, but a known bug of the process is that huge outlier scoring margins can have undue influence on the rankings. Take the 2009 NFL season, for instance, during which the Patriots led the NFL in SRS in no small part because they annihilated the Titans 59-0 in a snowy October game that tied for the second-most lopsided margin of victory in NFL history. Outside of that single game, the Patriots’ PPG margin was +5.2, which wouldn’t have even ranked among the league’s top ten teams, but the SRS (particularly because it minimizes squared prediction errors between actual outcomes and those expected from team ratings) gave the 59-0 win a lot of weight, enough to propel New England to the #1 ranking. (A placement that looked downright laughable, I might add, when the Pats were crushed at home by Baltimore on Wild Card Weekend.)

One solution that is commonly proposed for this problem is to cap the margin of victory in a given game at a certain fixed number. This is especially popular in college football (in fact, Chase sort of uses a cap in his college SRS variant) because nonconference schedules will often see matchups between teams of incredibly disparate talent levels, games in which the powerhouse team can essentially choose the margin by which they want to steamroll their opponent. Within that context, it doesn’t really matter whether Florida State beats Idaho by 46 or by 66, because there’s a 0% chance Idaho is a better team than FSU — no new information is conveyed when they pile more and more points onto the game’s margin.

But what’s the right number to cap margin of victory at in the NFL? These are all professional teams, after all, so there’s plenty of evidence that in the NFL, blowing opponents out — even when they’re bad teams — says a lot about how good you are. Where do we draw the line, then, to find the point at which a team has clearly proven they’re better than the opponent, beyond which any extra MOV stops giving us information?

[continue reading…]

{ 11 comments }

Neil Paine Joining FiveThirtyEight

As you may have heard, Neil Paine is joining Nate Silver at FiveThirtyEight.com. Neil, in addition to being a good friend and one of the men responsible for making this site a reality, has also written some great articles at Football Perspective. And, he’s even got another article or two on tap before he heads off to FiveThirtyEight.

So in addition to thanking Neil for all his great work, and to congratulate him on getting the platform he justly deserves, I wanted to make sure my readers all knew where to find Neil in 2014. I’m sure he’ll be checking this post from time to time, so feel free to leave Neil a note in the comments.


{ 4 comments }

Will the Jets Fire Rex Ryan?

On Sunday morning, Jay Glazer reported that the Jets head coach told the team that he believes he will be fired after the season. And a few hours ago, I noted that while the Jets have a 7-8 record, that’s not an accurate reflection of the team’s production this year. So one week from today, will new general manager John Idzik decide to go in a different direction on Black Monday?

After making the AFC Championship Game in both 2009 and 2010, Rex Ryan’s Jets have now failed to make the playoffs in each of the last three years. From 1988 to 2012, 62 head coaches went three straight years without making the playoffs while coaching the same team. As it turns out, the head coach returned in 33 of those cases for the following season, but in each of the last five instances, ownership has chose to fire the head coach. That’s the situation Ryan and Mike Munchak are in, and Jason Garrett would join them in that boat with a loss to Philadelphia next Sunday, too.

On average, the teams that fired the head coach won 4.8 games in Year N, and then won 7.4 games in Year N+1. That includes the three new head coaches in 2013 in Buffalo, Arizona, and San Diego.

TeamYearCoachRecordCoachRecord
SDG2012Norv Turner7-9Mike McCoy7-7
BUF2012Chan Gailey6-10Doug Marrone6-9
ARI2012Ken Whisenhunt5-11Bruce Arians9-5
STL2011Steve Spagnuolo2-14Jeff Fisher7-8-1
TAM2011Raheem Morris4-12Greg Schiano7-9
DEN2008Mike Shanahan8-8Josh McDaniels8-8
DET2008Rod Marinelli0-16Jim Schwartz2-14
CLE2008Romeo Crennel4-12Eric Mangini5-11
ARI2006Dennis Green5-11Ken Whisenhunt8-8
NOR2005Jim Haslett3-13Sean Payton10-6
HOU2005Dom Capers2-14Gary Kubiak6-10
BUF2003Gregg Williams6-10Mike Mularkey9-7
ARI2003Dave McGinnis4-12Dennis Green6-10
JAX2002Tom Coughlin6-10Jack Del Rio5-11
DAL2002Dave Campo5-11Bill Parcells10-6
SDG2001Mike Riley5-11Marty Schottenheimer8-8
CAR2001George Seifert1-15John Fox7-9
NOR1999Mike Ditka3-13Jim Haslett10-6
SEA1998Dennis Erickson8-8Mike Holmgren9-7
CHI1998Dave Wannstedt4-12Dick Jauron6-10
BAL1998Ted Marchibroda6-10Brian Billick8-8
NYG1996Dan Reeves6-10Jim Fassel10-5-1
TAM1995Sam Wyche7-9Tony Dungy6-10
RAM1994Chuck Knox4-12Rich Brooks7-9
SEA1994Tom Flores6-10Dennis Erickson8-8
PHO1993Joe Bugel7-9Buddy Ryan8-8
SEA1991Chuck Knox7-9Tom Flores2-14
GNB1991Lindy Infante4-12Mike Holmgren9-7
SDG1991Dan Henning4-12Bobby Ross11-5

Of the 32 teams to retain the head coach, the average team won 6.9 games in Year N and then 7.3 in Year N+1. Those are full season results — the table below shows the number of wins by that specific coach in Year N+1.

TeamYearCoachRecordYear N+1
JAX2010Jack Del Rio8-83-8-0 (0-0)
HOU2010Gary Kubiak6-1010-6-0 (1-1)
HOU2009Gary Kubiak9-76-10-0 (0-0)
CHI2009Lovie Smith7-911-5-0 (1-1)
HOU2008Gary Kubiak8-89-7-0 (0-0)
BUF2008Dick Jauron7-93-6-0 (0-0)
CIN2008Marvin Lewis4-11-110-6-0 (0-1)
CLE2007Romeo Crennel10-64-12-0 (0-0)
SFO2007Mike Nolan5-112-5-0 (0-0)
TEN2006Jeff Fisher8-810-6-0 (0-1)
NOR2004Jim Haslett8-83-13-0 (0-0)
HOU2004Dom Capers7-92-14-0 (0-0)
NOR2003Jim Haslett8-88-8-0 (0-0)
SEA2002Mike Holmgren7-910-6-0 (0-1)
ATL2001Dan Reeves7-99-6-1 (1-1)
PIT2000Bill Cowher9-713-3-0 (1-1)
CIN1999Bruce Coslet4-120-3-0 (0-0)
TEN1998Jeff Fisher8-813-3-0 (3-1)
WAS1998Norv Turner6-1010-6-0 (1-1)
TEN1997Jeff Fisher8-88-8-0 (0-0)
SEA1997Dennis Erickson8-88-8-0 (0-0)
WAS1997Norv Turner8-7-16-10-0 (0-0)
CHI1997Dave Wannstedt4-124-12-0 (0-0)
WAS1996Norv Turner9-78-7-1 (0-0)
NOR1995Jim Mora7-92-6-0 (0-0)
CIN1995David Shula7-91-6-0 (0-0)
IND1994Ted Marchibroda8-89-7-0 (2-1)
CIN1994David Shula3-137-9-0 (0-0)
TAM1994Sam Wyche6-107-9-0 (0-0)
CLE1993Bill Belichick7-911-5-0 (1-1)
PHO1992Joe Bugel4-127-9-0 (0-0)
GNB1990Lindy Infante6-104-12-0 (0-0)
IND1990Ron Meyer7-90-5-0 (0-0)

I’m a bit surprised that so many head coaches were retained after failing to make the playoffs for three straight years, but I think the recent trend shows that the NFL is more of  a “win now” league than ever before.

More to the point for Ryan, 2013 marks the third straight season the Jets have failed to post a winning record. From 2000 to 2012, only 18 head coaches posted three straight years with a non-winning record for the same team. Eleven of them were fired after year three, and two more (Dick Jauron and Mike Nolan) were fired in midseason in year four. Four other coaches were in the AFC South during the Peyton Manning era, and as I’ve noted before, owners appeared to give those coaches long leashes for failing to push ahead of those Colts teams.

The other coach in this group was Marvin Lewis: keeping him may have been the wise decision, but was probably more a reflection of the Bengals ownership than anything else.

Woody Johnson, of course, is not content with mediocrity… or being out of the spotlight. After the Jets failed to make the playoffs in 2007, the team released Chad Pennington and acquired Brett Favre. After the Jets failed to make the playoffs in 2008, head coach Eric Mangini got the axe. After the Jets failed to make the playoffs in 2011, Brian Schottenheimer was the scape goat. After the Jets failed to make the playoffs in 2012, Woody went up the corporate ladder and canned Mike Tannenbaum. With a first-year quarterback, a first-year offensive coordinator and a first-year general manager, there’s only one move left for Johnson to make.

{ 11 comments }

The Jets beat the Browns 24-13 today, bringing New York’s record up to 7-8. With Rex Ryan on the hot seat — more on this in a few hours — some have defended the controversial head coach by lauding his work this season. After all, if the Jets are one of the least talented teams in the NFL, isn’t it the product of great coaching that the Jets got to 7-8?

That would be true if the Jets were playing like a 7-8 team. But that’s not the case. The Jets have been outscored by 110 points this year, which makes them a bottom five team, a level of production more in line with the team’s talent. If Ryan is getting bottom five production out of a team that’s bottom five in talent, well, that’s not nearly as impressive.

But perhaps you want to argue that the Jets have overachieved in record (but not anywhere else) because of Ryan? Let’s investigate that claim. New York has just 4.45 Pythagorean wins, which means that they’ve won 2.55 more games than expected. The table below shows the 24 teams to exceed their Pythagorean record [1]Among teams in 16-game seasons by at least two wins while posting a negative points differential. [continue reading…]

References

References
1 Among teams in 16-game seasons
{ 17 comments }

How good are the Panthers?

2013 has been a much more pleasant season for these two

2013 has been a much more pleasant season for these two.

Through 15 weeks, Brian Burke ranks the Broncos, 49ers, Panthers, and Seahawks as the top four teams in the NFL. According to his numbers, Carolina has the #7 offense and the #7 defense.

Football Outsiders is a little less bullish on Carolina, ranking them 13th. On the other hand, the Panthers have won three of their last four games, and Carolina ranks 11th in weighted DVOA, 10th in offense, and 11th in defense (a 31st-place ranking in special teams is not helping matters).

Still, some question whether the Panthers are really a top team, or even an average team. After all, it was only two weeks ago that I wrote that the “2013 Panthers were largest sleeping giant (whatever that means) of the last 20 years.”

Date of the first three paragraphs of this post: December 22, 2012.

Now let’s talk about the 2013 Carolina Panthers. Advanced NFL Stats has them as the 8th best team in the NFL, courtesy of the 13th best offense and 10th best defense. Football Outsiders has Carolina as the 3rd best team in the league, thanks to the #8 offense, the #3 defense, and the 14th best special teams.

But in 2012, Carolina started 2-8, and was just 5-9 after 15 games. This year, the Panthers are 10-4. So why the heck do these teams look so similar? Let’s investigate. [continue reading…]

{ 5 comments }

First round talent

First round talent.

In 1990, there were 22 running backs who rushed for at least 700 yards. Of those players, Barry Sanders, Ottis Anderson, Sammie Smith, John L. Williams, Emmitt Smith, John Stephens, Lorenzo White, James Brooks, Cleveland Gary, and Neal Anderson were former first round picks. In addition, Bobby Humphrey, Mike Rozier, and Kevin Mack were selected with first round picks in supplemental drafts, bringing the number to thirteen.

Christian Okoye and Thurman Thomas were second round picks, Barry Word was a third round pick, and the rest of the 700+ yard group (Herschel Walker [1]Who, of course, was morally a first round pick, but fell in the draft because he was in the USFL at the time., Johnny Johnson, Marion Butts, Merril Hoge, Derrick Fenner, and Earnest Byner) was drafted after the fourth round.  But the majority of the top running backs were former first round picks.

1990 was a bit of an outlier year.  That season, 48.9% of all rushing yards by NFL running backs came from backs selected among the first 30 picks.  If you also include the rushing yards produced by Anthony Thompson, Dalton Hilliard, and Ickey Woods — each of whom was drafted 31st overall — the total jumps to 51.1% of all rushing yards by running backs that season. That means the 31st pick in the draft was the tipping point, or median draft slot, for rushing yards by running backs that season.

[continue reading…]

References

References
1 Who, of course, was morally a first round pick, but fell in the draft because he was in the USFL at the time.
{ 10 comments }

Eli Manning in elite INT territory

After a five-interception performance against a dominant Seattle pass defense, Eli Manning now has 25 interceptions this season. The odds are extremely low, but it’s not impossible that he throws ten more interceptions and ties the modern record set by Vinny Testaverde in 1988. That year, a 25-year-old Testaverde threw 35 interceptions when the league average interception rate was 3.91%. Since Testaverde threw 466 passes that season, we could say that a league-average quarterback would have thrown 18.2 interceptions; therefore, Testaverde threw 16.8 interceptions over average that year.

So far in 2013, the average interception rate is just 2.70%. Since Manning has thrown 485 passes, we would expect a league-average passer to record 13.1 interceptions. With 25 interceptions, that puts Manning at 11.9 interceptions above average. The table below shows the top 100 leaders in interceptions over average since 1950. [continue reading…]

{ 10 comments }

Something just didn’t feel right. Here is what I wrote in last week’s column:

Through 12 weeks, the Cowboys had the strongest pass identity in the NFL. Then, against the Raiders in week 13, the Cowboys were pretty run-heavy. And against the Bears in week 14, Dallas produced its best game of the season on the ground. But Tony Romo attempted just 20 passes, and the Cowboys had their second lowest pass ratio of the season (behind a blowout win over the Rams). The weather played a factor against the Bears, and the running game was working, but in general, Dallas is at its best when Tony Romo, Dez Bryant, and Jason Witten are getting lots of touches. Against the Bears, a run-heavy game plan makes some sense; my guess is we’ll see a more pass-happy performance out of the Cowboys against Green Bay this weekend.

Well, at least I nailed one prediction this year. The Cowboys implosion against the Packers provided Nitroglycerin to the fire burning with second-guessers and Romo critics. First, some context: the Packers won with a Game Script of -9.7, the second lowest average by any winning team in 2013. And the Cowboys ran just 18 times, despite DeMarco Murray rushing for 134 yards on those 18 carries.

By my count, the most pass-happy games of the season have been:

  • Atlanta calling 45 pass plays and just 16 runs in a win over the Rams where the Falcons held an average lead of 13.4 points.
  • The Packers, when Aaron Rodgers was healthy but Eddie Lacy was not, calling 46 passes and 24 runs (including three kneel downs!) despite posting a Game Script of 17.9 against Washington.
  • Dallas passing on 85.7% of all plays (54-9 ratio) despite holding an average lead of 1.4 points against the Vikings in week 9.
  • Dallas, by recording a Game Script of 9.7 against Green Bay while passing 51 times and rushing just eighteen.

So when Tony Romo threw two late interceptions, the narrative had already been written: in addition to Romo being a choker, the burning question was why didn’t Dallas call more running plays? The Cowboys led 26-3 at halftime, yet called just seven runs in the second half? How is this even possible?

But as Bill Barnwell points out, this isn’t as much of a black and white issue as you might think. Dallas had five second half drives:

  • Drive #1: Leading 26-10 (the Packers scored on the opening drive of the half), the Cowboys call five runs and five pass plays on a 10-play, 48-yard drive for a field goal. Dallas faced 1st-and-10 five times on this drive, and ran on four of those plays. A holding penalty on a negated running play ruined the drive, forcing Dallas to settle for a field goal.
  • Drive #2: Leading 29-17, the Cowboys go three-and-out. Leading by 12 in the third quarter is hardly clock-killin’ time. A first down incompletion to Murray led to two more pass plays, but only with the benefit of hindsight can you really rip into Garrett for not calling yet another run here on 1st-and-10 (or for not running on 2nd-and-10, or 3rd-and-10). Had Dallas won the game, nobody would remember this series.
  • Drive #3: Leading 29-24 with 12 minutes left in the first quarter, the Cowboys ran Murray on 1st-and-10, the 5th out of 7 opportunities to do so in the second half. After that, the Cowboys did in fact become very pass-happy, as Romo threw on eight of the next nine plays. The only problem with criticizing that approach is that it led to an 80-yard touchdown drive.
  • Drive #4: Leading 36-31, the Cowboys took possession at their own 20-yard line with 4:17 remaining. The Packers had all their timeouts. At this point, a three-and-out gives Green Bay the ball back with 3:53 remaining. Even if the Cowboys get one first down, and get that on third down on the initial set of downs, the Packers will get the ball back with 1:54 remaining.That’s too much time for an offense that had scored four touchdowns on each of its four second half possessions. So on 1st down, the Cowboys called a pass play which was incomplete. On 2nd down, Romo was sacked. But on 3rd down, Romo hit Dez Bryant for the first down.

    You probably didn’t hear too much about that series, since it ended well. On the next 1st down, Dallas ran Murray for four yards. Two more runs wouldn’t have done much unless they gained six yards — the Packers could get the ball back with 1:54 and one timeout. Getting a first down is the priority in this situation, not running the clock.

    Of course, as we all know, Romo threw a pass on a run/pass option, and Sam Shields recorded the interception.

  • Drive #5: Trailing 37-36, the Cowboys called two pass plays, and Romo’s pass for Cole Beasley was picked off when the receiver ran the wrong route.

It’s easy, and maybe a little bit fun, to rip Garrett and Romo and Jerry Jones. But I don’t think the pass-happy play-calling was the problem. Allowing 34 second-half points was the problem, and more runs up the middle wouldn’t have solved that problem, either. Unfortunately for the Cowboys, the problems on defense don’t seem to be getting any better.

Below are the Game Scripts data from each game in week 15; you can view the Game Scripts data from each game this season at the always up-to-date Game Scripts page here.
[continue reading…]

{ 3 comments }

New York Times: Post-Week 15, 2013

This week at the New York Times, I look at the dominant Seattle pass defense.

As the passing revolution overtakes the N.F.L., football fans have become immune to the avalanche of falling records. Teams are averaging 239 passing yards per game and completing 61.3 percent of passes, metrics that would be single-season records. Peyton Manning is on a pace to break the single-season record for passing yards and passing touchdowns, and there was discussion last week that he was not even the most valuable player in the league. Josh Gordon set records for receiving yards in a two-, three- and four-game stretch this season, and the Cleveland Browns lost each of those games. You can forgive fans for not being impressed by gaudy passing numbers when Philadelphia Eagles quarterback Nick Foles starts the season with 19 touchdowns and no interceptions.

The league average Adjusted Net Yards per Attempt this season is 5.97, which would also be an N.F.L. record. (The previous high was 5.93, set last season.) The Seahawks have allowed just 3.40 ANY/A, easily the best in the league (San Francisco and Carolina are second and third at 4.62 and 4.73). But since the ANY/A league average has been rising for years, we cannot just compare Seattle to teams of yesteryear. We also need to measure how far from the league average each pass defense has performed.

The simplest way to measure deviation from the average is to measure the standard deviation among all pass defenses in the N.F.L. In 2013, the standard deviation of the ANY/A ratings of the 32 teams is 0.93. As a result, Seattle’s pass defense is 2.76 standard deviations above the 2013 mean of 5.97. If the Seahawks can maintain that level of dominance, it will rank as the fourth best season since 1970.

By this method, the top pass defense was fielded by Tampa Bay in 2002, the year the Buccaneers won the Super Bowl. In 2002, Tampa Bay allowed 2.34 Adjusted Net Yards per Attempt; that season, the league average was 5.35 and the standard deviation was again 0.93. As a result, the Tampa Bay pass defense was 3.22 standard deviations better than average. In the postseason, the Buccaneers allowed just three touchdowns while scoring four touchdowns on interception returns.

You can read the full article here. Below are the top 75 pass defenses from 1950 to 2012 using this formula:

YearTeamANY/ALGAVGSTDEVvalue
2002Tampa Bay Buccaneers2.345.350.933.22
1988Minnesota Vikings2.155.020.893.21
1970Minnesota Vikings0.724.161.182.91
1982Miami Dolphins1.224.761.332.66
1985Chicago Bears2.744.860.92.37
1974Pittsburgh Steelers1.593.910.982.36
2008Pittsburgh Steelers3.175.71.092.33
1977Atlanta Falcons1.093.551.062.32
1980Washington Redskins2.364.871.082.32
2005Chicago Bears3.375.340.862.28
1998Miami Dolphins3.575.310.762.28
1965San Diego Chargers2.443.920.662.26
1969Minnesota Vikings0.964.671.652.24
1973Pittsburgh Steelers0.583.891.482.23
1987San Francisco 49ers3.215.040.832.19
1965Green Bay Packers2.315.011.242.19
2003New England Patriots3.265.20.892.18
1963Chicago Bears0.814.871.872.18
1986Chicago Bears2.634.961.072.17
1952Los Angeles Rams1.313.120.862.1
2006Baltimore Ravens3.645.380.832.1
1997San Francisco 49ers3.525.160.782.1
1962Green Bay Packers1.395.011.742.08
2010Green Bay Packers4.095.730.792.08
2001Cleveland Browns3.35.190.912.08
1961San Diego Chargers0.913.851.432.06
1994Dallas Cowboys3.765.380.782.06
1956Chicago Cardinals0.653.881.572.05
1991Philadelphia Eagles2.995.181.072.05
2004Buffalo Bills3.665.630.962.04
2009New York Jets3.485.651.062.04
2007Indianapolis Colts3.985.520.762.03
1969Kansas City Chiefs1.764.231.232.02
1990Pittsburgh Steelers3.245.291.022.01
1950Cleveland Browns0.493.151.331.99
1991New Orleans Saints3.065.181.071.99
1971Baltimore Colts1.673.931.151.96
1996Green Bay Packers3.125.141.031.96
2009Buffalo Bills3.575.651.061.95
1995San Francisco 49ers3.915.410.771.95
1964Washington Redskins2.314.61.181.95
2012Chicago Bears4.35.930.841.94
1997Green Bay Packers3.655.160.781.93
1967Green Bay Packers1.284.321.61.9
2008Baltimore Ravens3.645.71.091.9
2000Miami Dolphins3.295.211.021.88
1999Tampa Bay Buccaneers3.495.180.91.88
1986San Francisco 49ers2.954.961.071.87
1960Buffalo Bills2.24.0611.86
1975Oakland Raiders1.214.041.521.86
{ 8 comments }

Chip Kelly, Bill Belichick and Riverboat Ron (née Rivera) are the three coaches most associated with aggressive fourth down decisions. In week 15, all three faced a key fourth down decision, and each situation provided a good teaching moment.

Philadelphia goes for it on 4th and 1 on their own 24, down by 15, 3rd quarter, 6:26 remaining

This was an unconventional decision, but pretty clearly the right one. Here’s what Kelly said after the game:

“I thought we could’ve made it, and I also thought if we don’t make it we’re in trouble,” Kelly said. “If we can’t get half-a-yard, maybe it tells you what the day’s all about. But you’ve gotta think at 4th-and-half-a-yard we can get half-a-yard. They didn’t blitz. It wasn’t like there was an all-out coming at us. We need to come off the ball and get some movement at the point of attack and dig ourselves out of that hole right there. We hadn’t gotten anything going at that point in time so hoping we could jump-start something there.”

The bold decision did not pay off when LeSean McCoy was stopped on 4th-and-inches, and that failure enabled the leaders of the conservative moment to begin crowing. Going for it on 4th down is no guarantee, but from 2010 to 2013, runs on 4th-and-1 have converted 68.6% of the time (excluding runs in the red zone). And one would think a dominant rushing team like Philadelphia would be in much better shape. Philadelphia leads the league in both rushing yards and yards per carry, while the Vikings have a below-average run defense. According to Advanced NFL Stats, Philadelphia should have gone for it if the team had a 50% chance of conversion, and the Eagles probably had a 75% chance of converting here.

But the frustrating part of the analysis is that the anti-stats movement claimed that it was “too early” for Philadelphia to go for it. As a general rule, it is never too early to go for it on 4th-and-inches, and that applies even more strongly when talking about the Eagles offense.
[continue reading…]

{ 3 comments }

Marty Schottenheimer and his Quarterback Struggles

Marty checking to make sure the pilot light is on.

Marty checking to make sure the pilot light is on..

Tomorrow night on NFL Network, the fantastic series A Football Life will look at the career of Marty Schottenheimer.

Despite his many accolades, like Dan Marino, Schottenheimer is as often defined by his major shortcoming: never winning a Super Bowl. Did you know that Schottenheimer ranks 6th with 200 career wins? That places him behind only Don Shula, George Halas, Tom Landry, Curly Lambeau, and Paul Brown. Schottenheimer finished his career 74 games above .500, ranking seventh behind those five coaches and Bill Belichick. But the 5-13 record in the playoffs has become party of his core, and has unfortunately swallowed the rest of his career.

Schottenheimer won fewer games than Shula, but he didn’t have Johnny Unitas, Bob Griese, or Marino.  He wasn’t as successful as Landry or Brown or Belichick, but he didn’t have Roger Staubach or Otto Graham or Tom Brady, either.

Schottenheimer and Shula are the only coaches to win 14 games with six different quarterbacks.  Marty is the only one to win 13 games with seven different quarterbacks, the only to win 11 games with eight different ones, and the only to win 10 with nine different quarterbacks. He won eight games with ten different quarterbacks and five games with eleven different quarterbacks. In fact, Schottenheimer won games with 18 different starter quarterbacks, easily a record. [continue reading…]

{ 24 comments }
The Cowboys have allowed a lot of yards this year

The Cowboys have allowed a lot of yards this year.

Dallas has been out-gained by 1,280 yards this season, the worst margin in the NFL. But with a 7-6 record, the Cowboys are hardly considered a bad team. So how can we reconcile these two facts?

In general, gaining yards and preventing opponents from gaining yards are correlated with success. The other teams in the bottom five in yards margin (the Jaguars, Vikings, Bucs, and Rams) are a combined 16-35-1, while the top three teams in yards margin are 32-8 (the Broncos, Saints, and Seahawks). On the other hand, as a statistic, “yards” is a flawed measure of team success. So let’s begin our investigation with a threshold question:

1) Are the Cowboys a bad team with a good record, or a good team with a bad yardage differential?
[continue reading…]

{ 6 comments }
The Packers had a rough Movember without this guy

The Packers had a rough Movember without this guy..

Green Bay started the season 5-2 and seemed on its way to another playoff berth. But in the first quarter of the team’s eighth game, Aaron Rodgers broke his collarbone. The Packers lost that game (technically on Rodgers’ ledger as the starter), and have struggled ever since. In his stead, Seneca Wallace went 0-1, Scott Tolzien went 0-1-1, and then Matt Flynn got a chance to lose on Thanksgiving against the Lions before salvaging a win against the Falcons last Sunday.

Unsurprisingly, Green Bay is much worse without Rodgers. Using his .625 winning percentage as a starter this year, we might presume that the Packers would have won 3.125 out of the team’s five games that he’s missed. Instead, Green Bay has won 1.5 out of five games; that means Rodgers would have provided 1.625 Wins Above the Other QBs on the roster. (If we did not count the Bears game as a Rodgers game, then Rodgers would have provided 2.79 Wins Above the Other QBs.) Rodgers has been ruled out for the Packers’ pivotal week 15 showdown with the Cowboys; a loss there would bring Rodgers’ value up to 2.25 Wins Above the Other Green Bay QBs.

Where does that rank all time? The biggest discrepancy belongs to the 2002 Rams. The Rams started 0-4 under reigning NFL AP MVP Kurt Warner, and then lost the team’s next game when Jamie Martin started in relief of an injured Warner. For the sixth game, the team turned to Marc Bulger, who led the 0-5 team on a five game winning streak before suffering a finger injury just as the starting quarterback was ready to return. Warner started games 11 and 12, but another injury forced Martin started game 13; St. Louis lost all three games. Bulger then returned and won his 14th start. At that point in the year, St. Louis was 6-0 under Bulger and 0-8 under everyone else. In game 15 against Seattle, Bulger was hurt on the St. Louis’ fourth play from scrimmage; Martin came in and the team lost 30-10. The final game of the year was a meaningless one and started by Scott Covington, although Martin took most of the snaps in a victory over the 49ers.

All told, St. Louis went 6-1 in Bulger starts (including the Seahawks game), while the other Rams quarterbacks posted a 1-8 record. Since we would project a 1-8 team to win just 0.78 out of 7 games, Bulger is given credit for being 5.22 Wins Above the Other QBs for the team.

The table below shows all quarterbacks from 1950 to 2013 to produce at least 2 Wins Above the Other QBs for their team. The formula to calculate WAOQBs is simply the difference between the winning percentages with and without the starting quarterback multiplied by the number of starts by the quarterback or by the other quarterbacks on the team, whichever number is smaller. [continue reading…]

{ 6 comments }

If you look at the Patriots’ PFR page, you’ll see that the Patriots are a 10-3team that’s played like an 8-5 team that has a 6-7 record against the spread. I wondered how often a team with such a good record was below average against the spread. The answer: pretty frequently. Which I suppose isn’t too surprising, since Vegas doesn’t like to make it so easy to win money that all you need to do is pick winners.

New England has mirrored its ancestors from 35 years ago, who also started 10-3 but posted a 7-6 record against the spread. The table below shows all teams from 1978 to 2012, excluding the strike years, to win at least 3 more games outright through 13 weeks than against the spread. In an expected turn of events, the top 4 teams on the list all made the Super Bowl in the prior year. That leads to being favored frequently, and if you win enough close games, you’ll make this list.
[continue reading…]

{ 3 comments }

Dear Pete Carroll

At the end of Sunday’s game against the 49ers, the Seahawks had an opportunity to (attempt to) allow the 49ers to score. Following a  Colin Kaepernick gainof 8 yards on 3rd-and-7, the 49ers had the ball, down by 1, at the Seahawks 7-yard line with 2:39 remaining.  The Seahawks were out of timeouts, which meant if San Francisco wanted to, it could drain the clock to under 30 seconds. Keith Goldner at Advanced NFL Stats already covered this issue well: “Once the 49ers had the 1st-and-Goal, with the impending snap coming under the 2:40 mark, the Seahawks should have immediately attempted to allow the 49ers to score.”

I agree with Keith’s analysis: the Seahawks would have been in a better situation having the ball following a kickoff with 2:30 left in the game, trailing by 5-7 points, than to have been in the desperate situation they were in. But what does coach Pete Carroll have to say about whether it would have been wise to allow the 49ers to score a touchdown?

“There’s a lot of gut in that decision…We had the talk, and it’s just not in our mentality to let anybody have anything….I’m going to do a little research this week and see if anyone has ever done that and won,” Carroll said.

I don’t think we need to go beyond Keith’s analysis, which correctly frames the issue. We don’t need to look at historical numbers to know that trailing by 5-7 with the ball on your own 22 with 2:30 left is better than trailing by 2 with the ball on your own 22 with 26 seconds remaining. But since coach Carroll used to coach the Jets, I figured I would do him a solid and provide him with a history lesson. [continue reading…]

{ 2 comments }

Week 14 Game Scripts

At the last second, Washington realizes it forgot to do something

Washington realizes it forgot to do something.

Last week, six teams won with a negative Game Script. During an unforgettable slate of 1PM games in week 14, four teams during that time slot won with a negative Game Script — and that doesn’t include the insane Ravens/Vikings game.  One of the teams to win with a negative Game Script was Miami, so had the Ben Roethlisberger/Antonio Brown miracle lateral play worked, it would have increased the craziness quotient but left us with just three negative Game Script victors.

The big comeback, of course, was in New England. The Patriots were shut out for the first 43 minutes, scored 14 points in the next 15 minutes, and then 13 points in the final two minutes. New England now has two of the biggest comebacks of the year, and joins Seattle as the only teams to win two games with Game Scripts of -6.0 points.

Big news out of Washington yesterday: Robert Griffin III has been benched for Kirk Cousins, in what is being described as collateral damage in the Dan Snyder/Mike Shanahan power struggle. The most interesting part of that sentence is Snyder’s hyperlinked name means yes, in fact, PFR now does have pages for executives. The quarterback change obscures the fact that the team has the worst special teams through thirteen weeks since at least 1989, and a pretty bad defense, too. More relevant for today’s post is that the beat down provided by Kansas City produced a Game Script of 23.8 points, the largest average lead in any game this year.

Below are the Game Scripts data from each game in week 14; you can view the Game Scripts from each game this season at the always up-to-date Game Scripts page here. [continue reading…]

{ 3 comments }

New York Times: Post-Week 14, 2013

This week at the New York Times, I look at the questionable decisions of the man responsible for the struggles of the 2013 Colts.

After a 2-14 season in 2011, the Indianapolis Colts hired Ryan Grigson as their general manager, and his success was immediate. In 2012, the Colts made the playoffs and he was named executive of the year by two groups: Pro Football Weekly in conjunction with football writers, and The Sporting News.

But in the N.F.L., what worked one year often fails the next, and Grigson is receiving on-the-job training on that very fact.

Although the Colts won 11 games last season, they lacked the talent to compete with the top teams. The 2012 Colts were outscored by 30 points. According to Pro-Football-Reference.com’s Simple Rating System, Indianapolis had the easiest schedule in the N.F.L. in 2012, and with that taken into account, the Colts rated as the 24th-best team in the league.

It’s the job of the general manager not to get caught up in come-from-behind victories and shiny won-lost records when assessing the roster. To Grigson’s credit, Indianapolis aggressively tried to patch the team’s many holes; unfortunately for the Colts, that effort was mostly unsuccessful.

Indianapolis (8-5) has clinched the A.F.C. South with three weeks left. The two biggest reasons for that are Andrew Luck and the rest of the division. The A.F.C. South has an 11-25 record in interdivision games, a 30.6 winning percentage that is easily the worst in the league.

Indianapolis is not a great team. It may not even be a good one: the Colts have been outscored, 316-313. It is probably silly to dismiss the Colts — or any playoff team — as Super Bowl contenders after the Giants and the Ravens got hot at the right time over the last two years. But next off-season, Grigson will be challenged to cover up the weak spots on his roster. And despite the executive of the year awards on his shelf, some of the damage was self-made.

You can read the full article here.

{ 1 comment }

Buying a Laptop: Taking Suggestions

Other than yours truly, the acquisition of a new laptop would benefit you, the Football Perspective reader, more than well, anyone else. So I figured I’ll throw this out there to the crowd.

Do you have any recommendations when it comes to buying a new computer? I’ve bought Lenovo laptops the last two times, and while they work well, after a couple of years, they begin to get very slow. I think that’s because I have a lot of Microsoft Excel files on my computer, which tend to take up a lot of memory. Despite running an super impressive website, I’m not very computer savvy, so I figure I’ll open this up to the crowd. And I’ll preemptively just say I don’t want to buy a Mac, mostly because I’ve never had one and don’t have the time or desire to get used to one.

To the extent I get a computer that will allow me to run my programs quicker, that will mean more posts for you. So let ‘er rip in the comments. If you know of any deals or happen to sell computers for a living, well, you can drop that note in the comments, too.

{ 24 comments }

Which Four Teams Would Make a College Playoff in 2013?

We can officially declare the BCS dead (1998-2013). As it turns out, the final edition of the BCS rankings was not controversial. It took awhile, but with the losses by Ohio State and Northern Illinois, Florida State was the only team in the Football Bowl Subdivision to finish the year without a blemish. The champion of the Pac-12 had two losses, while the one loss champions of the Big 12 (blowout loss) and Big 10 (one win against a team in the SRS top 25) had unimpressive resumes compared to the one-loss SEC Champion (4-1 record against teams in the SRS top 25). No team distinguished itself from the AAC or any other the other conferences, nor did any of the independent teams. That left the voters with two easy choices to fill two slots.

But starting next season, there will be a four-team playoff in college football. In general and on average, a four-team playoff is preferable to a two-team playoff: leaving out the fifth best team is easier to stomach than leaving out the third place team. A four-team playoff may not be ideal, but it’s the system we will have. So which teams would be deserving of the third and fourth golden tickets if the playoffs began in 2013?

There are only four legitimate candidates: Alabama, Stanford (Pac-12 champion), Baylor (Big 12 champion), and Michigan State (Big 10 champion). Any other team could be dismissed quickly: Fresno State, Northern Illinois, Central Florida, and Louisville each lost just one game, but easy schedules make that accomplishment less impressive. Among two-loss teams, Stanford had the most difficult schedule and was the only to win its conference: South Carolina, Missouri, Oklahoma, Oklahoma State, and Clemson were good teams, but don’t have elite resumes. The two teams that could make the best case would be Oregon and Ohio State, but both teams can’t make credible arguments after losing their conference to another team in consideration. [1]I will leave the argument as to whether head-to-head is the best tiebreaker, particularly between Ohio State and Michigan State, for another day. Which team you would pick out of those four would say more about the voter than the team in question. But before we go through the criteria, first, the final college football SRS ratings. [continue reading…]

References

References
1 I will leave the argument as to whether head-to-head is the best tiebreaker, particularly between Ohio State and Michigan State, for another day.
{ 2 comments }
Previous Posts