≡ Menu

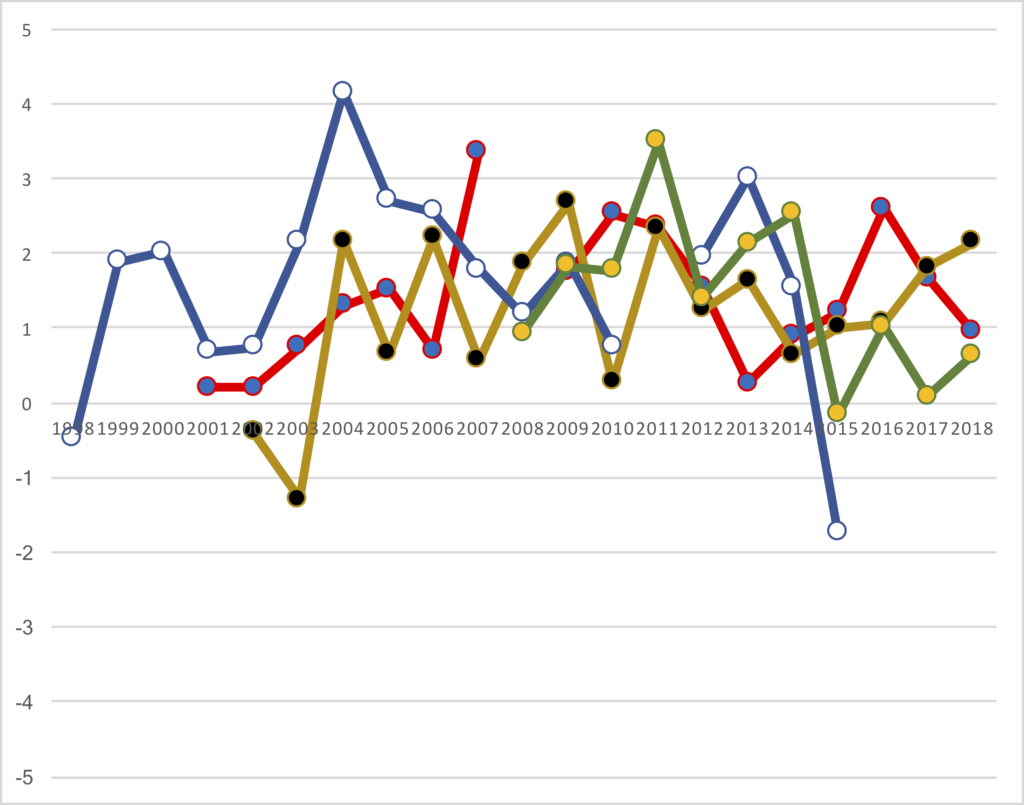
I calculated the Adjusted Net Yards per Attempt averages for every quarterback for every season in NFL history. I then calculated each quarterback’s Relative ANY/A, which is their ANY/A relative to league average. I wanted to then plot the big four quarterbacks of this era — Peyton Manning, Tom Brady, Drew Brees, and Aaron Rodgers — to see how they fared (after excluding seasons where the quarterback didn’t have enough pass attempts to qualify for the passing crown). I’ll leave the commentary to you guys, and I’ll just present the data in three different graphs.

First, let’s do it by chronological year. This means Manning’s graph starts early but ends, while Rodgers doesn’t get started until 2008. I have used blue/white for Manning, red/blue for Brady, gold/black for Brees, and green/gold for Rodgers.

[continue reading…]

{ 1 comment }

Brady vs. Manning, Yearly ANY/A

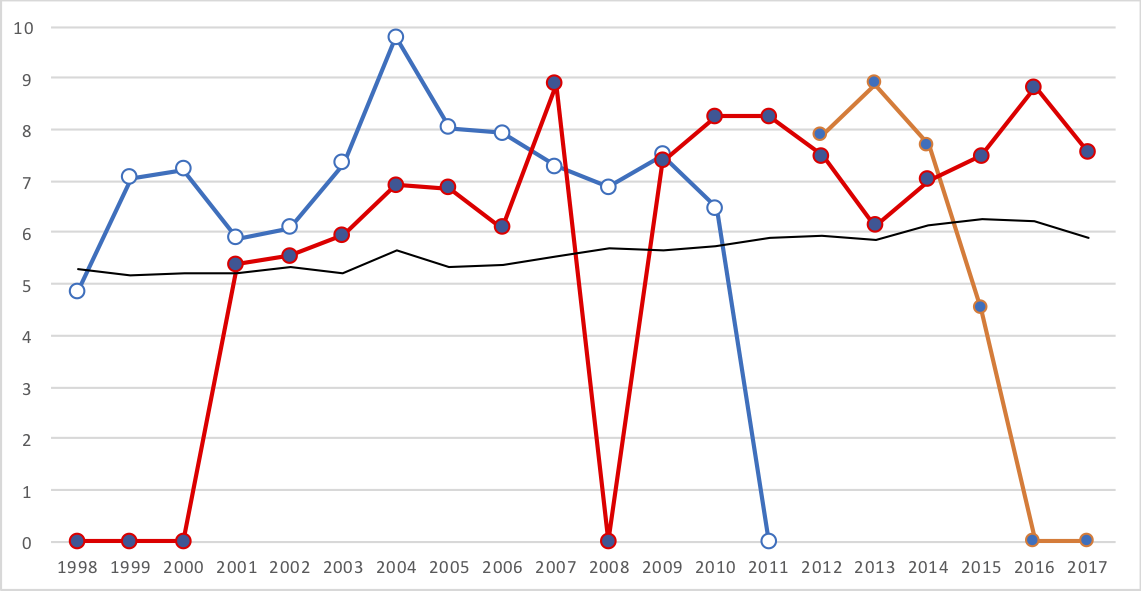
Yesterday, Brad Oremland’s great series on his top-ranked QBs in Total Statistical Production concluded. You should give that a read today, especially if you missed it because of the holiday.One thing that Brad wrote about in the Manning section was how Manning was nearly always better than Brady during the ’00s. It’s easy to forget about that now — Brady has been the much better QB for each of the last three years, and for most years in the ’10s. But during the ’00s, the only year that Brady was clearly better was ’07.I decided to make a graph of the Adjusted Net Yards per Attempt for Tom Brady (in red with blue dots) and Peyton Manning (in blue with white dots for his Colts years, and orange with blue dots for his Broncos years) for each of the last 20 seasons. Brady missed all or nearly all of the ’98 (college), ’99 (college), ’00 (backup), and ’07 (injury) seasons, while Manning missed all of the ’11 (injury), ’16 (retired), and ’17 (retired) seasons. They each get a zero for those seasons, even tho Brady threw 14 passes combined in those years. The thin black line represents league average ANY/A each season.You can break this down into a few categories. [continue reading…]

{ 0 comments }

In 5 years, one of Tom Brady, Peyton Manning, and Drew Brees will be the all-time leader in passing touchdowns. Currently, Manning is the passing touchdown king with 539 touchdowns, but will Brees or Brady catch him?

A year ago, I wrote about the fascinating touchdown race between Brady and Brees: at the end of the 2015 season, both had thrown 428 career touchdown passes. Last year, Brees threw 37 while Brady threw 28 in 12 games, so Brees is currently up 9 on Brady, 465-456.

But when I measured Brees and Brady last year, I measured them by calendar year. Both threw their first touchdown pass in 2001, so I thought a calendar year-by-year chart would be cool. But it probably makes more sense to compare the passers year-by-year by age, as I did yesterday with Brees and Manning for passing yards. That’s because Brees is about a year and a half younger than Brady (in turn, Brady is about a year and a third younger than Manning, but we haven’t compared them by calendar year).

So if we plot their passing touchdowns by age, Brees appears to have a huge leg up on Brady. That is, unless Brady plays until he’s 45: [continue reading…]

{ 107 comments }

Today’s guest post comes from James “Four Touchdowns” Hanson, a relative new reader to the site. As always, we thank our guest posters for contributing.

[Editor’s note: There were a couple of minor bugs in the original data. This post has now been updated.]


There may be no two quarterbacks more often measured against each other than Tom Brady and Peyton Manning. One simply has to do a Google search of the topic to see that fans and sports writers have compared the two numerous times, using a vast array of criteria from the simple counting of championships to using advanced analytics to make their case.

So it’s surprising to me that I still haven’t come across a comparison of Manning and Brady against the same defenses. It’s an idea that occurred to me when Manning critics pointed out that much of his record-breaking 2013 season came against the mediocre teams of the 2013 NFC East and AFC South, while Tom Brady’s record-breaking 2007 was against a tougher strength-of-schedule. [1]While I am a Peyton Manning fan, I feel the point is valid and logical. We compare stats so often but don’t always take into account that most of those numbers were earned against different teams … Continue reading If we’re genuinely after the fairest assessment possible – which is why I assume fans of advanced analytics prefer to measure individual players by their own production rather than team results like wins and championships – what better way to measure each player than by how they performed against the same competition?

So I decided to take a look at the seasons in which Manning and Brady were both active and played against the same teams in the same season. Of course, like any statistical analysis, this one comes with its own set of flaws. When the two quarterbacks play each other’s divisions or one plays the same team in the regular season and the playoffs, one of them may have played the same team twice or even three times in a single season while the other has played them only once.

This can be good or bad for the player’s results – sometimes it allows the opposing defense to learn from the first encounter and make life difficult for the passer the second time around. One example is Peyton Manning’s encounters with the Steelers in 2005; he defeated Pittsburgh with a 102.9 rating and 8.67 ANY/A during the regular season, only to see his performance suffer the second time around during the post-season with a 90.9 rating and 6.21 ANY/A in a loss. Meanwhile, Tom Brady’s single game against the Steelers, where he won with a 92.7 rating and 6.84 ANY/A, stands alone – could he have done better or worse in a second encounter? We’ll never know.

Other times, it can allow the quarterback another opportunity to do well against that defense. When Brady played the Jets for the first time in 2010, he earned a mediocre 72.9 rating and 5.11 ANY/A in a loss. He bounced back to win with an extraordinary 148.9 rating and 12.00 ANY/A in their second meeting and then fell somewhere in between when they met in the playoffs, losing with an 89 passer rating and 5.08 ANY/A. Meanwhile, Manning met the Jets just once in the post-season, where he suffered a loss despite earning a 108.7 rating and 8.85 ANY/A in his last game wearing a Colts uniform. How would he have done if he played the Jets three times? Again, we’ll never know.

In fact, the sometimes vast difference in which each QB has performed against the same defense in the same season should encourage us to take these results with a grain of salt – in-game conditions, game plans from coaches, the play from supporting casts, how one team’s strengths and weaknesses match differently with an opponent, playing at home or away, key injuries on either side, etc. can all effect a player’s performance in any given game.

And there’s always the possibility that Brady or Manning just had a bad day and their performance isn’t indicative of their true abilities: the small sample size of a football season made even smaller by singling out common opponents isn’t ideal in determining a fair and scientific measurement for how good each player actually is. On the other hand, it’s the only evidence we have available, so we’ll have to roll with it.

I bring this up because I don’t intend this to be a definitive attempt at determining which player is better – most people already have made up their minds (and I personally tend to rate quarterback on tiers anyway). Some say Manning would have more championships if he had Belichick and the Patriots organization at his side, while others say Brady would have bigger numbers if he had the receiving talent Manning had during his career. I think both can be true.

I’d also like to mention that I pulled this list manually and despite several reviews, there still may be errors in the data – this is unintentional and I welcome any corrections.

So without further ado, here’s a list of the common opponents they faced in each season, with both 2008 (Brady played one game) and 2011 (Manning was inactive) removed as both players weren’t active during those seasons:

• 2001: Jets, Bills, Dolphins, Raiders, Saints, Falcons, Broncos, Rams
• 2002: Dolphins, Jets, Steelers, Titans, Broncos
• 2003: Dolphins, Jets, Bills, Browns, Broncos, Jags, Texans, Titans, Panthers
• 2004: Ravens, Chiefs
• 2005: Steelers, Jaguars, Chargers
• 2006: Bills, Jets, Dolphins, Titans, Jags, Texans, Broncos, Bengals, Bears
• 2007: Chargers, Ravens, Jaguars
• 2009: Bills, Jets, Dolphins, Titans, Jags, Texans, Ravens, Broncos, Saints
• 2010: Chargers, Jets, Bengals
• 2012: Texans, Ravens
• 2013: Colts, Ravens
• 2014: Bills, Jets, Dolphins, Raiders, Chiefs, Chargers, Colts, Bengals, Seahawks
• 2015: Colts, Steelers, Chiefs

And here are their career averages against common opponents from 189 total regular season and playoff games played (93 Manning, 96 Brady):

Except for interception percentage, Manning seems to have a slight advantage across the board. Most differences are so small that I personally consider them basically even in most categories. The biggest differences seem to be that Manning’s interception rate is substantially higher, while Brady’s sack numbers are substantially higher – and in Brad Oremland’s TSP and Career Value metrics, where Manning holds a commanding lead.

To delve a little further into the numbers, let’s look at the advanced stats of each player by season. The highlights indicate which player did better that year in each metric, while the bolded numbers indicate that season’s number marks a career best (against common opponents) –

The leader in both ANY/A and Passer Rating match in every season, with Manning’s rates beating Brady’s in 8 of the 13 seasons compared. QBR results are also is very similar, with the only difference being Brady having the edge in 2014, putting them even at 4-4.

Interestingly, it seems that for most seasons, one player clearly played better against common opponents by a substantial amount – in Passer Rating, the two only play at a similar level in 2001 and 2007, while the rest of the time the winner often beats the other by ten points or more! What’s really surprising to me is that Manning surpasses Brady in every metric for 2007, which was when Brady led perhaps the greatest offense of all time to a record-breaking season and an AFC Championship.

I also wanted to compare their performances against common opponents in each season by TSP but since it’s a raw sum instead of an average like the other advanced stats, I needed to take each season’s statistical averages and multiply them to get 16 games worth of production. The results were –

The first thing that jumps out at you is Manning’s preposterous 2013 prorated across 16 games – over 6,500 yards and 75 TDs with only 5 INTs. That alone tells us to take these results with a grain of salt.

But accepting the numbers for what they are, we see that the leader in TSP for each season matches the leader in Passer Rating and ANY/A. We also see that Manning’s highs and lows are quite extreme in comparison to Brady’s – Brady doesn’t have a season that matches Manning’s 2004 and 2013, but Brady’s TSP never dips into negative numbers as Manning’s does in 2002 and 2015.

And again, Manning’s 2007 results manage to top Brady’s numbers for his most legendary statistical season (though that probably means nothing since the sample size we’re working with is so small).

So what does this all prove? Well, nothing really. As said, I think the majority of people already have their opinions set for these players – this is just for fun. Hope you enjoyed!

References

References
1 While I am a Peyton Manning fan, I feel the point is valid and logical. We compare stats so often but don’t always take into account that most of those numbers were earned against different teams of varying quality – after all, it’s not fair to compare passing numbers if one guy is going up against the 2002 Bucs while the other is playing the 2015 Saints, right?
{ 207 comments }

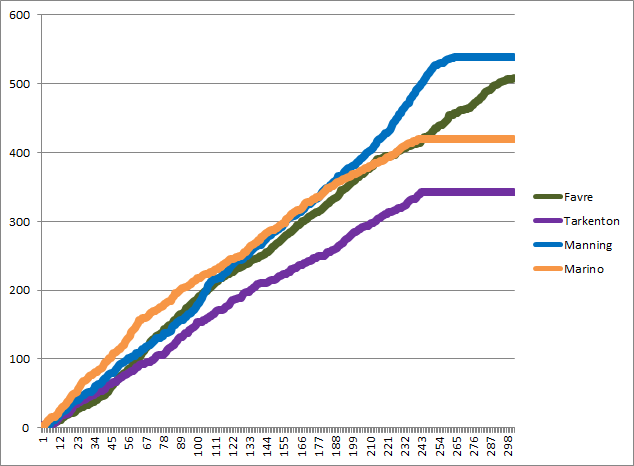
There have been four passing touchdown kings in the last 40 years: Fran Tarkenton, Dan Marino, Brett Favre, and Peyton Manning.  I thought it would be fun to plot the number of career touchdown passes each player had on the Y-Axis after each game of their career (shown on the X-Axis):

td pass leaders
[continue reading…]

{ 7 comments }

The 2012-2015 Broncos: What Can We Learn?

Here was something I tweeted a few days before Super Bowl 50:

The 2012 Broncos were awesome. Peyton Manning, while not having the scorched-earth campaign he would enjoy a year later, still led the NFL in ANY/A and Total QBR, and received 19.5 of 50 votes for Most Valuable Player (Adrian Peterson picked up the other 30.5). The Broncos finished 2nd in points and 4th in yards, while on defense, the team ranked 4th in points and 2nd in yards. Perhaps more impressively, the Broncos defense ranked 1st in Net Yards per Attempt, and in the top three in rushing yards, rushing touchdowns, and yards per carry.

The Broncos did have an easy schedule, but they were one of four teams that stood head and shoulders above the rest of the NFL, along with the Patriots, Seahawks, and 49ers. Of course, a Joe Flacco pass to Jacoby Jones, combined with a Rahim Moore blunder, wound up ruining the dream season. [continue reading…]

{ 53 comments }

Guest Post: Brady vs. Manning and Playoff Support

Adam Steele is back, this time throwing his hat into the never-ending Brady/Manning debate. Fortunately, this isn’t your typical Brady/Manning post, as Adam brings some new stats to the table. You can view all of Adam’s posts here.


By any statistical measure, Tom Brady and Peyton Manning have performed at a nearly identical level in the postseason. Of course, many observers don’t care about passing statistics, and prefer to judge quarterback based on playoff W/L record alone. And as we all know, Brady has a significant edge over Manning in this regard. But if we’re going to judge quarterbacks by the performance of their entire team, it’s only fair to also evaluate the parts of the team the QB has no control over – defense and special teams.

Using PFR’s expected points estimations, I recorded the defensive and special teams EPA for Brady’s and Manning’s teams in each of their playoff games. The “Support” column is the total EPA contributed by defense and special teams. Brady first: [continue reading…]

{ 91 comments }

Friend of the program Bryan Frye is back for another guest post. As regular readers know, Bryan operates his own fantastic site, http://www.thegridfe.com. You can view all of Bryan’s guest posts here, and follow him on twitter @LaverneusDingle.


Despite a fourth trip to the Super Bowl, 2015 has been the worst year of Peyton Manning’s storied career. Statistically speaking, he has never been worse, even as a 22 year old rookie starting all sixteen games for a 3-13 team. [1]A team that also went 3-13 the prior year and earned the right to draft him first overall. Relative to league average, Manning produced the worst completion rate, yards per attempt, touchdown rate, interception rate, passer rating, and adjusted net yards per attempt of his career. [2]Using Pro Football Reference’s Advanced Passing Index Scores as my measurement of choice. Manning ranked last among the 36 qualifying passers in Adjusted Net Yards per Attempt. And his normally stellar sack rate also took a hit, with the second worst output of his career (behind only 2001). [3]Of course, being Peyton Manning, he was still better than average; his Sack%+ score was 110 in the regular season.

If we look to advanced metrics to try to uncover some hidden gem about his performance that may be overlooked by standard box score stats, we don’t have much luck. ESPN’s QBR (which only goes back to 2006, mind you) takes into account far more than any other popular metric, and it normally adores Manning. From 2006-2014 (excluding 2011, obviously), Manning ranked 1st, 3rd, 1st, 1st, 1st, 1st, 2nd, and 3rd in Total QBR. [4]Among all quarterbacks with at least 224 action plays. His second place rank in 2013 becomes a first place rank if you finagle the threshold to exclude Josh McCown’s 269 play, 85.2 QBR bout. This year, he ranked 30th with a subpar 45.0 rating.

Football Outsiders’ DVOA and DYAR don’t do Manning any favors either. Not only was 2015 by far the worst season of his career by both metrics, it was also the only below average season of his career. From 1998-2014, his average season was 32.47% better than average by passing DVOA. His worst season by the metric was a 7.70% effort as a doe-eyed rookie. Over that same period, he averaged 1,664 passing DYAR per season, and his average season was worth 2.89 DYAR per pass. [5]Using the average of his averages rather than a weighted average of all DYAR on all pass plays. The point here is to show his average season, not his average performance over the course of his career. This year, Manning was 26.00% below average, as measured by DVOA, and he lost 328 DYAR from his career total. His -0.95 DYAR per play was easily worse than his previous low of 1.18 in his inaugural season.

If the stats aren’t enough, the infamous “eye test” also backs up the belief that this was Manning’s worst-ever season. He struggled to jive with Gary Kubiak’s offense, especially when asked to run bootlegs and throw on the run. His limited power to make pre-snap adjustments, in concert with his decreased mobility, resulted in him taking more abuse in the pocket than he ever had before. [6]I covered this in more detail after his poor week 2 performance. You don’t have to call me a prophet, but I won’t stop you. He threw errant passes and made uncharacteristically poor decisions, causing him to lead the league in interceptions until week 17, despite missing six games. He struggled with nagging injuries, had the worst game of his entire career, and was benched for an inexperienced and marginally talented fourth-year backup. [continue reading…]

References

References
1 A team that also went 3-13 the prior year and earned the right to draft him first overall.
2 Using Pro Football Reference’s Advanced Passing Index Scores as my measurement of choice.
3 Of course, being Peyton Manning, he was still better than average; his Sack%+ score was 110 in the regular season.
4 Among all quarterbacks with at least 224 action plays. His second place rank in 2013 becomes a first place rank if you finagle the threshold to exclude Josh McCown’s 269 play, 85.2 QBR bout.
5 Using the average of his averages rather than a weighted average of all DYAR on all pass plays. The point here is to show his average season, not his average performance over the course of his career.
6 I covered this in more detail after his poor week 2 performance. You don’t have to call me a prophet, but I won’t stop you.
{ 35 comments }

Manning/Brady 18 will use Manning's uniform number instead of Roman Numerals

Manning/Brady 18 will use Manning’s uniform number instead of Roman Numerals

Tom Brady and Peyton Manning have now played seventeen games against each other. Brady has posted an 11-6 record against Manning, which tends to fuel some of the Brady/Manning narrative. The beginning of their “rivalry” was dominated by Brady and the Patriots: from 2001 to 2004, New England went 6-0 against Indianapolis, including two playoff wins in the snow in Foxboro.

Those four seasons anchored the narrative for the 15-year rivalry of the two players. Since then, Manning has a 6-5 record against Brady, including a 3-0 mark in the playoffs. Each player has also won “only” one Super Bowl despite the two quarterbacks dominating the AFC for most of the last decade (Manning, of course, could win another next week).

The table below shows the statistics from both players for each of the 17 head-to-head games: [continue reading…]

{ 22 comments }

This week at The Washington Post, I look at how Peyton Manning is currently in the worst four-game slump of his career:

Peyton Manning just finished the worst four game stretch of his career. For a player who has started 281 career games, that’s a pretty bold statement. Then again, few quarterbacks have reached the incredible peaks that for years Manning turned into his permanent residence.

…..

If we take a simple rolling, four-game average of Manning’s ANY/A in each game relative to the average ANY/A allowed by the opposing defense in that game, Manning’s last four games would rate as the worst of his career

You can read the full article here.

{ 8 comments }

Guest Post: Marginal YAC, 2014 in Review

Adam Steele is back to discuss Marginal YAC, this time in the context of the 2014 season. You can view all of Adam’s posts here.


Manning is more of a downfield thrower than you think

Manning is more of a downfield thrower than you think

Back in September, I posted a three part series introducing Marginal Air Yards and Marginal YAC. Today, I’m going to update the numbers for 2014 and analyze some interesting tidbits from the just completed season. [1]A big thanks to Chad Langager at sportingcharts.com for helping me compile this data.

League-wide passing efficiency reached an all-time high in 2014 with a collective 6.13 Adjusted Net Yards per Attempt average. However, this past season was also the most conservative passing season in NFL history; 2014 saw the highest completion rate ever (62.6%), the lowest interception rate ever (2.5%), and also the lowest air yards per completion rate ever (5.91 Air/C). Passing yards were comprised of 51.4% yards through the air and 48.6% yards after the catch, the most YAC-oriented season in history. [2]Even though YAC data only goes back to 1992, I feel safe in using the phrase “all-time” with regard to YAC dependency. The offensive schemes of yesteryear emphasized downfield passing, which … Continue reading This trend shows no sign of reversing itself, so expect more of the same in 2015.

Here are the 2014 Marginal Air Yards (mAir) and Marginal YAC (mYAC) for quarterbacks with at least 100 pass attempts. The 2014 leader in Marginal Air Yards is…Peyton Manning? Yes, the noodle-armed, duck-throwing, over-the-hill Peyton Manning averaged 4.54 Air Yards per pass Attempt; given that the average passer on this list averaged 3.70 Air Yards per pass Attempt, this means Manning averaged 0.84 Air Yards per Attempt over average. Over the course of his 597 attempts, this means Manning gets credited with 500 marginal Air Yards, the most of any quarterback in the NFL. [continue reading…]

References

References
1 A big thanks to Chad Langager at sportingcharts.com for helping me compile this data.
2 Even though YAC data only goes back to 1992, I feel safe in using the phrase “all-time” with regard to YAC dependency. The offensive schemes of yesteryear emphasized downfield passing, which generated far less YAC than the short passing games of today.
{ 12 comments }

Manning returns to face his former team

Manning returns to face his former team

Today, Peyton Manning will face off against his former team, the Indianapolis Colts, in a playoff game. This is actually the 3rd time Manning has played in a Colts/Broncos playoff game — Manning is 2-0 — but the first time he is facing his former team in the playoffs. This will be just the 4th time that has happened in NFL history.

In 1960 and 1961, Jack Kemp quarterbacked the Chargers to the AFL Championship Game, ultimately losing both times to the Houston Oilers. Then, in 1964 and 1965, Kemp reached the AFL Championship Game again, only this time, the San Diego Chargers were his opponent! Both times! That’s right, in four of the first six seasons, Kemp started in the AFL title game either for or against the Chargers. And in all four games, San Diego went 0-4, as Kemp’s Bills defeated the Chargers, in both games, on the strength of some dominant Buffalo defenses. San Diego did win the AFL title in 1963, otherwise that would go down as one of the saddest stretches in championship game history. [continue reading…]

{ 1 comment }
Tom Brady has been known to wear Suggs

Tom Brady has been known to wear Suggs

Disclaimer: Quarterbacks don’t have records, teams do. A quarterback’s “record” is simply shorthand for saying “the record of a quarterback’s teams in all playoff games started by that quarterback.” Please forgive me for using that shorthand for the remainder of this post.

Eight years ago, Doug Drinen wrote a fun post in advance of the 2006 AFC Championship Game. At the time, Peyton Manning had gone 0-2 in playoff games against Tom Brady, so Doug looked at quarterbacks who had gone winless against another particular quarterback in the postseason.

Manning wound up beating Brady in that game, and evened his record against Brady in the 2013 playoffs. No pair of quarterbacks have ever met as starters five times in the playoffs, so Brady/Manning are tied for the most playoff meetings. Joining them on Saturday will be Brady and Joe Flacco. This weekend’s game will be the fourth time since 2009 that the Ravens have traveled to Foxboro in the postseason, and Brady and Flacco have been under center for each game. [continue reading…]

{ 7 comments }
Luck's rushing ability makes him a QBR star

Luck's rushing ability makes him a QBR star.

A few weeks ago, I put ESPN’s Total QBR under the microscope. Today, I want to look at the quarterbacks whose passing statistics most differ from their QBR grades.

Total QBR grades go back to 2006, so to start, I ran a regression using Adjusted Net Yards per Attempt to predict Total QBR. The best-fit formula was:

Total QBR = -13.5 + 11.23 * ANY/A

For those curious, the R^2 was 0.80, indicating a very strong relationship between ANY/A and Total QBR. What this formula tells us is that a passer needs to average 5.65 ANY/A to be “projected” to have a QBR of 50; from there, every additional adjusted net yard per attempt is worth 11.2 points of QBR. Last year, Peyton Manning averaged 8.87 ANY/A, which projects to a QBR of 86.2. In reality, Manning had a QBR of “only” 82.9; this means Manning’s QBR says he wasn’t quite as amazing as his excellent efficiency numbers would indicate (to say nothing of his otherworldly gross numbers). One likely reason for this result is that Manning ranked 29th in average pass length in the air (according to NFLGSIS) and 6th in yards after the catch per completion; this matters because ESPN gives more credit to quarterbacks on the yards they accumulate through the air. (Throughout this post, we will be forced to deal with educated guesses, because Total QBR is a proprietary formula.)

As it turns out, Manning rating higher in actual QBR than projected QBR is a stark departure from prior years. In 2012, he finished 7.2 points higher in actual QBR than projected QBR, but that’s nothing compared to his time with the Colts. In five years in Indianapolis during the Total QBR era, Manning finished at least 10 points higher in actual QBR each season.

Along with Manning, Matt Ryan and Andrew Luck are the two quarterbacks who are most likely to over-perform relative to their “projected” ratings. Let’s be careful about exactly what this means: whatever the ingredients that go into the QBR formula that don’t go into the ANY/A formula, Manning, Ryan, and Luck seem to have a lot of them.

Luck is a fascinating case. In 2012, he ranked just 20th in ANY/A, but 11th in QBR. I wrote several articles during Luck’s rookie season about how his QBR ratings surpassed his standard stats. [1]Although now I can’t recall if his 2012 ratings were inflated because of his 4th quarter comebacks.  And I can’t check, because once ESPN decided to cap the clutch weight associated with … Continue reading Last year, he ranked 16th in ANY/A and 9th in QBR. Does this make Luck the quarterback most underrated (if you buy into QBR) by his traditional passing numbers (if you buy into ANY/A)? [continue reading…]

References

References
1 Although now I can’t recall if his 2012 ratings were inflated because of his 4th quarter comebacks.  And I can’t check, because once ESPN decided to cap the clutch weight associated with each play, they retroactively applied the current formula across past years.
{ 11 comments }

Wazzup????

Wazzup????

Some quarterbacks and wide receivers just go together. Peyton Manning and Marvin Harrison. Dan Marino and Mark Clayton and Mark Duper. Joe Namath and Don Maynard. John Hadl and Lance Alworth. But quarterbacks play with lots of receivers, and receivers generally play with several quarterbacks. We don’t remember most combinations, but that doesn’t mean they were all unproductive. So I thought it might be interesting to look at every wide receiver since 1950, find his best single season in receiving yards, and record who was his team’s primary quarterback that season.

Jerry Rice’s best year came with Steve Young, not Joe Montana. Randy Moss set the touchdown record with Tom Brady, but his best year in receiving yards was with Daunte Culpepper. Lynn Swann’s best year was with Terry Bradshaw, but John Stallworth’s top season in receiving yards came with Mark Malone. James Lofton’s best season was with Lynn Dickey, Isaac Bruce’s best year was with Chris Miller, Torry Holt’s top season came with Marc Bulger, and Tim Brown’s top year was with Jeff George.

This is little more than random trivia, but this site does not have aspirations for March content higher than random trivia. In unsurprising news, 25 different players had their best season in receiving yards (minimum 300 receiving yards) while playing with Brett Favre. That includes a host of Packers, but also a couple of Jets and Vikings, too (including one future Hall of Famer).

After Favre, Marino is next with 22 players, and he’s followed by Manning and Fran Tarkenton (20). From that group, I suspect that Tarkenton might surprise some folks. That is, unless they realized that he was the career leader in passing yards when he retired and played for five years with the Giants and thirteen with Minnesota.

The table below shows every quarterback who was responsible for the peak receiving yards season of at least five different receivers (subject to the 300 yard minimum threshold). For each quarterback, I’ve also listed all of his receivers. [continue reading…]

{ 10 comments }

Peyton Manning’s Legacy

Can you spot the GOAT?

Can you spot the GOAT?

Super Bowl XLVIII was the nightmarish end to the dream season had by Peyton Manning and the Broncos. After the greatest scoring season in NFL history, Denver’s high-powered offense was held to just 8 meaningless points against one of the greatest defenses in NFL history. Great players have been having bad games on the biggest stages since the beginning of sports. But the NFL world has a unique reaction when that player is Manning; for him, every loss is yet another building block on his Narrative(TM).

When Tom Brady leads the greatest scoring offense in NFL history to 14 points against a defense that allowed 22 points per game during the regular season, it does not become part of his narrative. When Joe Montana leads the 49ers to just three points in back-to-back playoff losses to the Giants, those games are pushed to the footnotes section of his biography. When the favored Colts were shut out by the Browns in the 1964 NFL title game, that goose egg did not become indelibly intertwined with the legacy of Johnny Unitas. Our memory of Otto Graham‘s 1953 season is that it was one of the greatest quarterback seasons in football history, even if he went 2/15 for 20 yards with no touchdowns and two interceptions in a losing effort in the NFL title game. We remember Sammy Baugh as one of the greatest players ever, forgetting that he was the face of an embarrassing 73-0 loss to the Bears in the 1940 championship game. For most quarterbacks, ugly playoff performances are quirks of history; for Manning, they become bullet points in a character assassination.

Mike Tanier already discussed the silliness that surrounds Manning’s career. Detractors have played “move the goal posts” for nearly two decades with Manning, beginning with his high-profile losses in college. Even after Manning seemingly silenced the last anti-Manning argument, his detractors just invented a new game.

He led his team to a Super Bowl victory. He began to reliably beat Brady’s Patriots. Instead of installing Manning’s legacy behind shatterproof glass, we just juggled harder. One Super Bowl victory, plus another loss, simply isn’t enough for this particular player! The bar for true greatness is multiple Super Bowl victories, an easy standard to set if you are a Patriots fan or a television analyst who shared a locker room with Troy Aikman! It’s a wonder we did not go back and retroactively demand an Orange Bowl or two.

Today’s post is not written to make you feel bad for Peyton Manning. You should not. But the question that has been repeatedly asked over the last three weeks – What is Peyton Manning’s legacy? – is one that is easy to answer. His legacy is that he’s the greatest quarterback ever. That’s not a very exciting answer in the world of #HOTTAKES, but it’s the truth.

We’re past the point of debating how valuable Manning has been in the regular season. Two years ago, I concluded that Manning was the greatest statistical quarterback in NFL history, and that’s before he even donned a Broncos uniform. That analysis didn’t consider how the Colts fell from Super Bowl contender to worst team in the league in the span of one Manning injury. That analysis didn’t consider that in his first year with the Broncos, Denver set the record for the largest year-to-year increase in completions, because that result was preordained. That analysis isn’t based on the MVPs, the All-Pros, the Pro Bowls, or anything but the numbers. I’ll re-run the study this summer, but the only question is how much farther ahead of the competition Manning’s increased his lead.

Attacking Manning’s numbers is a fool’s errand. As a result, as Manning’s regular season production has taken on mythic proportions, the anti-Manning crowd has begun to use that success as a sword. He’s the best regular season quarterback of all time, they will say, emphasizing those two words as if they were agents of disease.

Manning’s teams have struggled in the playoffs. Manning has struggled some, too, although not nearly as much as some believe. Is it surprising that Manning has an 11-12 career playoff record? I suppose so, because we’re at the point that literally every single time Manning loses a game we are surprised. Over the last nine seasons, there have been just seven games where Manning’s team lost as an underdog. [1]This excludes three meaningless end-of-year games where Manning was the nominal starter before sitting on the bench for the rest of the game, and the Colts were underdogs for precisely that reason. … Continue reading A Manning loss is an event, a mystery to be solved, a bat signal for the Manning truthers to emerge.

Some — perhaps many — will argue that Manning is not the greatest quarterback ever. Instead of Manning, that title should be reserved for Montana, or Brady, or Unitas. With Montana, the argument always goes back to the #4RINGZ (although you rarely hear about Bart Starr and his #5RINGZ). As a football historian, I find it disheartening that Montana is mostly remembered as a four-time champion, because he was one of the greatest regular season quarterbacks ever. You never hear Montana referred to as one of the greatest statistical quarterbacks or one of the greatest regular season passers, because those are Naughty Words. But Montana was. And he should be lauded for that.

One of the greatest regular season quarterbacks ever

One of the greatest regular season quarterbacks ever.

The Montana over Manning argument is simple: Montana is better because he went 4-0 in Super Bowls, while Manning is 1-2. Such hard-hitting analysis ignores the fact that in each of the four seasons Montana won the Super Bowl, the 49ers defense ranked in the top three in either yards allowed, points allowed, or both. For Manning, “only one Super Bowl” is a scarlet letter. The common argument goes, “How could the greatest quarterback ever only win one Super Bowl?” That’s a fair question to ask, but we know the answer: the playoffs are a single elimination tournament where random events happen. Montana threw three interceptions and lost a fumble in the 1981 NFC Championship Game, but the 49ers still won. In Super Bowl XXII, Montana nearly lost the game with a pass that hit Lewis Billups in the hands, but the defensive back couldn’t catch the ball. Montana was a better quarterback in the playoffs than Manning, but he also lost twice as 8+ point favorites. In one of those games, he was benched. Montana may be the second greatest quarterback of all time, but his resume is not beyond reproach.

“How could the greatest quarterback of all time win just one championship?” is Manning’s burden to bear, but it’s not hard to frame anti-Montana questions, either. After all, why did he only win two MVP trophies? That question is no more — and no less — fair than the Manning one. How great could Montana have really been if he did not win a single MVP trophy in his first ten seasons? After finally winning the award in back-to-back seasons, his replacement won the same award twice in the next five years? Shouldn’t we expect the greatest quarterback ever to be the best player in his league more than twice? Let Montana win three more MVP awards, and then we can talk about him being better than Manning.

The MVP question isn’t the only one out there. If Montana was so great, how come the Associated Press only named him a first-team All-Pro three times in his career? Shouldn’t the greatest player at his position in NFL history be recognized as the best player at his position more than three times in his career? Manning’s done it seven times! Be named the best player at your position four more times, then talk.

Those who believe Montana or Brady are better than Manning will not be convinced otherwise. I have no interest in yet another Brady/Manning debate. I would not deem it a coincidence that Montana and Brady were coached by Bill Walsh and Bill Belichick, the two best coaches of the last 30 years. I would not be so quick to blame Manning for losing in the Super Bowl, instead of praising him for taking teams coached by Jim Caldwell and John Fox to the big game. Brady, like Montana, has won just two MVPs. He was only a first-team All-Pro selection twice in his career, although he has a good excuse: he was competing with Manning nearly every year.

The best quarterback of his era not to win a title in the '60s

The best quarterback of his era not to win a title in the '60s.

Unitas, as great as he was, doesn’t compare favorably to Manning, because nobody compares favorably to Manning. Technically, Unitas won three titles, but he left Super Bowl V with an injury while the Colts were trailing, and Earl Morrall was the quarterback who led Baltimore’s come-from-behind victory. If that ever happened to Manning, there would be riots in the streets before Manning was credited with that win.

As good as Unitas was, nearly every factor points in Manning’s favor. We already know that Manning’s numbers — after adjusting for era — dwarf those of every other quarterback. But other factors tell a similar story. Unitas was a 10-time Pro Bowler and 5-time Associated Press 1st-team All-Pro; those are great accomplishments, but most of those accolades came when the NFL had between ten and sixteen teams, and several franchises employed a quarterback-by-committee approach during that era. Standing out as an elite quarterback was easier back then, but no matter: Manning still has Unitas beat, with 13 Pro Bowls and seven AP first-team All-Pros.

Unitas did not have the sustained success of Manning (he had a pair of down seasons in the middle of his career) nor did his career reach the highest peaks that Manning did in ’04 or ’13. Unitas did not win a single championship in the sixties, and in that era, he was the Manning to Starr’s Brady. Unitas won two titles early and then suffered a long postseason drought. Unitas was a three-time MVP, but that still puts him behind Manning.

Quarterback debates can be silly. We don’t wonder why Barry Sanders never won a Super Bowl. The  legacy of Jim Brown wasn’t tarnished even though he didn’t win a playoff game until his second-to-last season. Manning is the greatest quarterback in NFL history. That’s his legacy. He’s earned that label after reaching unparalleled levels of success, by producing at a level well above average, game after game, month after month, season after season. It’s a bit odd that Manning’s teams haven’t had more success in the playoffs, but that’s all it is. Ted Williams never won a World Series, but it doesn’t make him any less of a ballplayer. Even Boston fans can agree with that.

We are told that quarterbacks are different, and that a quarterback is responsible for his team’s success. But constant repetition does not make it so. We’re smart enough to know this; I know we are. We don’t think Russell Wilson is a better quarterback than Manning just because the Seahawks beat the Broncos. But Super Bowl XLVIII just showed that a great team can beat a great quarterback. A great effort by an in all three phases of the game is usually what it takes to beat Manning. Perhaps that is his true legacy, as no quarterback has ever been tougher to beat.

References

References
1 This excludes three meaningless end-of-year games where Manning was the nominal starter before sitting on the bench for the rest of the game, and the Colts were underdogs for precisely that reason. That never happened in 2005 or 2006, but in 2007, against the undefeated Patriots, the Colts were 5-point underdogs and lost 24-20. In 2008, the Colts were 4-point road dogs to the undefeated Titans, and lost 31-21. We skip 2009, and then in 2010, the Colts lost as road dogs to the Eagles and Patriots. In 2012, as post-surgery Manning was working back into GOAT Manning, Denver lose to Atlanta, Houston, and New England in the first five weeks as underdogs. And since someone will ask, Brady has lost as an underdog ten times over that span, excluding the week 17 game against Houston in 2009.
{ 98 comments }

No, Peyton, you're the man

No, Peyton, you're the man.

In 1984, Dan Marino set an NFL record with 48 touchdown passes, but his Dolphins lost in the Super Bowl. Twenty years later, Peyton Manning broke Marino’s record, but he lost to the eventual Super Bowl champion Patriots in the playoffs. In 2007, Tom Brady broke Manning’s touchdowns record, but he lost in the Super Bowl, too.

When the greatest quarterback seasons of all time are discussed, these three years dominate the discussion. And with good reason. But if you include the playoffs — and frankly, there’s no reason not to include the playoffs — which quarterback produced the greatest season of all time? I’m going to stipulate that the greatest quarterback season ever has to end in a Lombardi Trophy, because otherwise, I think we’ll end up back in the world of Marino ’84/Brady ’07/Manning ’04. Of course, now another Manning season has entered the mix: and with a Super Bowl win, Manning’s 2013 should and would be remembered as the greatest quarterback season of all time.

So, the question becomes, which season would he knock off the top rung? I think there are six seasons that stand out from the rest, based on regular and postseason performance.

Honorable Mention [continue reading…]

{ 14 comments }

Championship Game Preview: New England at Denver

These two men look important

These two men look important.

Someone needs to say it. I know, I know, it’s Manning/Brady XV. But someone needs to remind people that Peyton Manning threw 30 more touchdown passes than Tom Brady in 2013. He threw for over 1,000 more yards. He threw one less interception. He was sacked 22 fewer times. And did I mention that he threw 30 more touchdowns? If you’re not into stats, Brian Burke has Manning providing 5.83 extra wins this year, compared to 3.82 for Brady. At some point, the analysis should move beyond “a game between two of the greatest quarterbacks ever” and recognize these things, right?

Let’s cut off the Patriots fans before they can begin typing in Boston accents: the fact that Manning’s 2013 numbers dwarf Brady’s 2013 numbers does not mean Manning’s career >>> Brady’s career. And it doesn’t even mean (although it strongly implies) that Manning was a better quarterback in 2013 than Brady was. There’s no doubt that Denver’s supporting cast, at least on offense, is much better than New England’s. Manning has Brady’s favorite target from last year, Wes Welker, along with Demaryius Thomas, Eric Decker, and Julius Thomas. Brady has dealt with a very inexperienced set of receivers following massive turnover. The Patriots have had to replace Welker, Rob Gronkowski, Aaron Hernandez, and Danny Woodhead with Julian Edelman, 12 games worth of Danny Amendola, 8 games of Shane Vereen (although he’ll be around on Sunday), 7 games of Gronkowski (he won’t be around on Sunday), and Aaron Dobson and Kenbrell Thompkins. Each quarterback is down a star tackle (Ryan Clady, Sebastian Vollmer) but has an All-Pro caliber guard (Louis Vasquez, Logan Mankins).

But whatever the reason for the discrepancy, one conclusion is inescapable: this is not a meeting of equal passing attacks. On one hand, you have one of the greatest passing offenses ever. On the other, you have an above-average passing offense. And that’s the real story. The Broncos averaged 10 more points per game than New England, while Manning (as representative of the Denver passing attack) averaged 2.75 more adjusted net yards per attempt than Brady (as representative of the Patriots passing attack). [continue reading…]

{ 3 comments }

How quaint: a quarterback taking snaps form under center

How quaint: a quarterback taking snaps form under center.

With one game remaining, Peyton Manning has already set the new single-season record with 51 passing touchdowns (two months ago, I projected Manning to finish the season with 52 touchdowns). But all records must be viewed in their environment, and NFL teams are averaging 1.58 touchdown passes per team game this year, the highest average since 1948. In 1984, the year Dan Marino threw 48 touchdowns, teams averaged 1.37 touchdown passes per game.

So which season is more impressive? That’s a complicated question, and one that could be answered in many ways. In my view, the question boils down to which performance was more outstanding; in mathematical terms, we could define that as which season was farthest from the mean.

To make life a little simpler, I’m going to analyze this question on the team level, meaning we will compare “Denver 2013” to “Miami 1984.” Of course, this approach is preferable in many ways, since when we praise Manning we really mean “Manning with his offensive line and his coaching staff throwing to Demaryius Thomas, Wes Welker, Eric Decker, and Julius Thomas.” And “Marino in 1984” means “Marino and Mark Clayton and Mark Duper and Dwight Stephenson and Ed Newman.”

This season, the Broncos have 51 touchdown passes. The other 31 teams (through 15 games) are averaging 22.8 passing touchdowns, which means Denver is 28.2 touchdowns above average. The standard deviation of the 32 teams in passing touchdowns is 7.4; as a result, we can say that the Broncos are 3.84 standard deviations above average, also known as their Z-score.

In 1984, the other 27 teams (through 16 games) averaged 21.0 touchdowns, while the Dolphins threw 49 scores (Jim Jenson, a college quarterback who played receiver for Miami, threw a 35-yard touchdown to Duper against the Patriots off a Marino lateral). The standard deviation that season in touchdown passes at the team level was 7.5, which gives Miami a Z-score of 3.72 in 1984.

So the Broncos this season have been more extraordinary, at least by this measure. One nice thing about using the Z-score is we don’t need to adjust for games played. I went ahead and calculated the Z-scores for every team since 1932. The current Broncos are #1, with the ’84 Dolphins in second place. The third place team isn’t the Tom Brady 2007 Patriots; that team is down at #7, because the standard deviation in passing touchdowns among the league’s 32 teams was 8.8 that season. Instead, the third slot goes to the 1986 Dolphins. Few remember that Marino threw 44 touchdowns that season; add in Don Strock’s two touchdowns, a lower league average and a smaller standard deviation, and those Dolphins get a Z-score of 3.70.

Let’s look at the top 100 teams using this metric. The 2004 Colts ranked fifth (if you click on the cell in the team column, the link takes you to that team’s PFR page) in Z-score. That year, Indianapolis threw 51 touchdowns, while the other 31 teams averaged 21.97 touchdown passes. That means Indianapolis was 29.03 touchdowns above average, the highest production above average to date. But that year, the standard deviation among the 32 teams in passing touchdowns was 8.53, giving the Colts a Z-score of “only” 3.41; that’s why they’re 5th, not first.
[continue reading…]

{ 38 comments }

Denver has scored at a historic rate

Denver has scored at a historic rate.

Today’s insane statistic comes courtesy of RJ Bell: the difference between Denver and the #2 team in points per game is larger than the difference between the #2 and #31 teams. The Broncos are averaging 39.8 points per game this season, 11.6 points more than the (surprisingly second-ranked) Bears. And Chicago is averaging just 9.9 more points per game than the Jets, the #31 ranked scoring team.

That is, well, crazy. The record for points per game in a season is 38.8, set by the 1950 Rams. The 2007 Patriots are second at 36.8, and both of those teams scored slightly more points through ten games than the 2013 Broncos. So while Denver is on pace to break the scoring record, some regression to the mean over the final six games should be expected.

If the Broncos want to set the record for most points scored relative to the second highest scoring team in the league, Peyton Manning and company have some work to do. That mark is held by the ’41 Bears, who averaged 36.0 points per game, 12.5 more than the Packers that year. Second and third on that list are the ’07 Patriots (8.4) and ’50 Rams (8.3), so Denver has a realistic shot of setting the modern record.

I’ll be honest: as dominant as the Broncos offense has been, I’m a little surprised to see them so far ahead of the competition in points scored. After all, consider:

  • The Eagles have just 19 fewer yards than the Broncos, and Nick Foles actually leads Manning in both passer rating and Adjusted Net Yards per Attempt;
  • In PFR’s Expected Points Added, the Broncos offense is at 14.7 EPA-added per game, while the Saints offense is at 11.3. That’s a relatively small difference considering the fact that Denver has scored 12.1 more points per game than New Orleans.
  • The Chargers have a higher completion percentage than the Broncos and six fewer turnovers, but have averaged 17 fewer points per game.
  • The Packers are actually a hair ahead of Denver in yards per play (6.3531 to 6.3529), but have scored two fewer touchdowns per game.

So what’s going on? I’m perfectly fine with Denver being general run-of-the-mill dominant, but the team’s points scored numbers makes it seem like the Broncos might be the greatest offensive machine ever. I think I’ve identified the two reasons to explain the gap:

Red Zone success

Philadelphia has scored a touchdown just 46% of the time the Eagles made it into the red zone, which ranks 28th in the league. San Diego isn’t much better at 50% (22nd). The Saints are at 52.5% (20th), and the Packers are down at 30th at 43%. So some excellent offenses are really struggling in the red zone, which gives them disproportionately low points per game averages. Oh, and Denver? They’re at 79.1%, by far the highest rate in the league. It’s not unusual for a great offense to dominate in the red zone — the ’07 Pats were at 70% — but what is unusual is seeing the other top offenses struggle there.

I have red zone data going back to 1997, and the highest ever performance was set by Kansas City in 2003. The Trent GreenPriest HolmesTony Gonzalez Chiefs scored a touchdown on 77.8% of all red zone opportunities (42 out of 54), so the Broncos (34 out of 43) could break that record this year. More likely, though, is that the Broncos go from otherworldly in the red zone to just great, which would drop the team’s points per game average.

Number of Drives

The Broncos are averaging 2.85 points per drive, while the Saints are #2 at 2.46. That’s not a huge difference — the gap between #2 and #7 is slightly bigger. The difference, as you can deduce, is that the Broncos are averaging 13 drives per game while the Saints are at just 11.3 drives per game. Why is that? New Orleans’ average drive takes 2:56 minutes, the third-longest in the league (and San Diego is #1 at 3:13), while the Broncos are in the bottom five at 2:17 (the Eagles are last at 2:02). That Chip Kelly edge is erased, though, because Philadelphia’s opponents average 2:48 per drive, the third highest rate in the league. Denver’s opponents take just 2:18 per drive, the third lowest (just a second ahead of Detroit and eight seconds longer than Kansas City).

The Broncos defense is not great, but it does rank 6th in completion percentage allowed. Combine that with the fact that Denver ranks 4th in percentage of opponent plays that are passes, and incomplete passes occur on 25% of all plays run by Broncos opponents, the second-highest rate in the league behind Kansas City. That’s not surprising for a team with such a high Game Script, but it does stop the clock from running for long stretches, which gives Denver’s offense more possessions The Chargers are 28th in this statistic (18%), which is one reason why San Diego is dead last in offensive drives (10.2 per game).

But there’s another reason why Broncos’ opponents tend to have short drives: Denver leads the league in 20+ yard plays allowed at 54. As a result, teams don’t end up with many clock-chewing drives against Denver: opponents tend to gain big yards quickly or throw incomplete passes. That increases the number of drives for the Broncos, which (one could argue) inflates the success of the team’s offense. It’s all relative, of course — Denver is still #1 in points per drive by a wide margin — but it’s worth recognizing that Denver has scored 75% more points per game than an average of the other 31 teams, but “just” 62% more on a per-drive basis. That accounts for about 3 points per game. Add in the insane success in the red zone, and the lack of success there by the other top teams, and you have the reasons for the crazy stat at the top of today’s post.

Manning Record Watch Update

After six games, I analyzed how likely Manning was to break the single-season touchdown record. At the time, he had 22 touchdowns, and the formula projected him to throw 2.99 TDs/G the rest of the way to finish with 52 touchdowns, narrowly breaking Tom Brady’s record.

Now? Manning has 34 touchdowns, as his pace has only slightly declined. What does that mean? To calculate Manning’s odds using Bayes Theorem we need to know four things:

1) His Bayesian prior mean (i.e., his historical average): 2.38, as this number wouldn’t change from the original post.

2) His Bayesian prior variance (the variance surrounding his historical average): Again, no change here, so we use 0.0986.

3) His observed mean: Instead of 3.667, we will use 3.4.

4) His observed variance: This one involves just a little bit of work. What I suggested we do last time is calculate the number of passing touchdowns per game Manning averaged in the first six (now ten) games of each season since 2000, along with his average over the rest of the season (then, 8-10 games, now, 4-6 games). Then we take the difference of the variances of each column, as we did in step two.

YearTD/G Thru 10ROY GTD/G ROYDiff
20002.1620.1
20011.861.330.47
20021.961.330.57
20031.961.670.23
20043.552.80.7
20052420
2006261.830.17
20071.653-1.4
20081.751.8-0.1
20092.143-0.9
2010262.17-0.17
20122.462.170.23
Variance0.220.31

Manning’s variance over the rest of the season is 0.3052 TDs/G, while his variance through ten games is 0.2214; the differential there is 0.0838, which is the variance of our current mean.

Once you have your number for these four variables, then you substitute those numbers into this equation:

Result_mean = [(prior_mean/prior_variance)+(observed_mean/observed_variance)]/[(1/prior_variance)+(1/observed_variance)]

Or, using our numbers:

[(2.38 /0.0986) + (3.4 / 0.0838)] / [(1/0.0986) + (1/0.0838)]

which becomes

[24.14 + 40.57] / (22.08) = 2.93

This picture will never get old

This picture will never get old.

After averaging 3.667 TDs/G over 6 games, we projected Manning to average 2.99 TDs/G the rest of the year. Since he averaged “only” 3 touchdowns per game over his next four games, we downgrade him from 2.99 to 2.93. Of course, we already had a significant regression factored into his future projection — we dropped him by 0.67 TDs/game from his average, which is the point of using Bayes Theorem. So while he’s at “only” 3.4 TDs/G on the season after 10 games, since he’s played at that level for longer, he only loses about half a touchdown per game over his projection the rest of the way.

That gives Manning 17-18 touchdowns, which puts him at a season-ending projection of 51-52 touchdowns. He’s still more likely than not to break the record, although obviously this analysis ignores lots of elements like strength of schedule. And with a visit to Kansas City and a game against the Titans (who have allowed a league-low 7 touchdowns through the air), perhaps he’s actually an underdog to even tie Brady at 50.

{ 3 comments }

Is that Bayes?

Is that Bayes?

Peyton Manning is not a 51 touchdown per-season quarterback, but that doesn’t mean he won’t average the necessary 2.9 touchdowns per game over his final ten games this season to break Tom Brady’s touchdown record. Before the season, Footballguys.com projected Manning as a 2.38 passing touchdown per game player.  And while he has looked unstoppable thus far, with 22 touchdown throws in six games, Manning has been known to have great spurts before, too.  All quarterbacks have hot and cold streaks, Manning included.  From 2003 to 2012, after removing games where he sat late in the season, Manning averaged 2.17 passing touchdowns per game with a standard deviation of 1.31 touchdowns. [1]That was after removing week 17 of the ’04, ’05, ’07, ’08, and ’09 seasons, and week 16 of the ’05 and ’09 seasons, when Manning left early. Why did I pick the last ten years? I don’t … Continue reading  In the ’04 season, Manning threw at least 20 touchdowns in each of his trailing six game stretches from week 7 all the way through week 15, with a peak of 27 touchdowns in his prior six games in weeks 11 and 12.  Manning also threw 19 touchdowns in his last two full regular season games of 2010 and his first four games of 2011.  White-hot streaks happen, even to the best players, so we shouldn’t just assume that he’s now a 3.67 touchdown per game player.

On the other hand, it would be naive to assume that we should ignore the first six weeks of the season and continue to project Manning as a 2.38 touchdown per game player for the rest of the year.  The question becomes, how much do we base projection over the final 10 games on his preseason projection and how much do we base it on his 2013 results? In Part I, after four games, a regression model produced a projection of 2.56 touchdowns per game the rest of the year. But the problem with a regression analysis is that Manning is an extreme outlier among NFL quarterbacks; to project Manning, it would be best if we could limit ourselves to just quarterbacks named Manning Peyton Manning.

Before continuing, I want to give a special thanks to Danny Tuccitto, without whom this article wouldn’t be possible. Danny provided this great link and also spent a lot of time walking me through the process. To the extent I’ve mucked it up here, you should blame the student, not the teacher. But after walking through some models online, I realized that the best explanation about how to use Bayes Theorem for these purposes was on a sweet site called FootballPerspective.com. And the smartest person on that website had already laid out the blueprint.

In the comments to one of his great posts, Neil explained that we can calculate Manning’s odds using Bayes Theorem if we know four things:

His Bayesian prior mean (i.e., his historical average):

His Bayesian prior variance (the variance surrounding his historical average):

His observed mean:

His observed variance:

Let’s go through each of these:

1) Manning’s Bayesian prior mean: this is simply what we expected out of Manning before the season. I will use 2.38, since Footballguys is the gold standard of football projections in my admittedly biased opinion. But you can use any number you like, as I’ll provide the full formula at the end.
[continue reading…]

References

References
1 That was after removing week 17 of the ’04, ’05, ’07, ’08, and ’09 seasons, and week 16 of the ’05 and ’09 seasons, when Manning left early. Why did I pick the last ten years? I don’t know, but he won his first MVP in ’03, so that seemed like a useful starting point.
{ 9 comments }

It's been a magical month for the Broncos passing game

It's been a magical month for the Broncos passing game.

Sometimes, the simplest questions have the most complicated answers. Peyton Manning has thrown 16 touchdowns so far this season, putting him on pace for 64 touchdowns this year. Now, we can be reasonably sure that Manning’s true ability level — even with Wes Welker, Demaryius Thomas, Eric Decker, and Julius Thomas — isn’t four touchdowns per game. But he doesn’t need to keep up that pace to break Tom Brady’s single-season record of 50 touchdown passes: Manning “only” needs to averaged 2.92 touchdowns per game over the final 12 games. But to figure out his odds of averaging nearly three touchdowns per game, we need to figure out his true ability level. So how do we determine that number?

Even for a man who averages four touchdown throws per game over four games, averaging nearly three touchdowns per game going forward is still a tall order. Footballguys.com projected Manning to averaged 2.38 touchdowns per game this year. In 2012, he threw 37 touchdowns, an average of 2.31 touchdowns per game. From 2003 to 2012, excluding games [1]That was after removing week 17 of the ’04, ’05, ’07, ’08, and ’09 seasons, and week 16 of the ’05 and ’09 seasons, when Manning left early. Why did I pick the last ten years? I don’t … Continue reading he exited early, Manning averaged 2.17 touchdown passes per game. As a Colt, Manning averaged 1.92 touchdowns per game.

It doesn’t take any advanced math skills to figure out that Manning is likely to average somewhere between 2 and 4 touchdowns per game over the rest of the season. But that doesn’t help us very much: we need to be precise, since the threshold he needs to hit is 2.92 touchdowns per game. I’ll get to the more complicated math in Part II. For now, let’s look at some history.
[continue reading…]

References

References
1 That was after removing week 17 of the ’04, ’05, ’07, ’08, and ’09 seasons, and week 16 of the ’05 and ’09 seasons, when Manning left early. Why did I pick the last ten years? I don’t know, but he won his first MVP in ’03, so that seemed like a useful starting point.
{ 4 comments }

New York Times: Post-Week 4, 2013

This week at the New York Times, I examine the brothers Manning:

Twenty months ago, Eli Manning and the Giants won the Super Bowl at Lucas Oil Field in Indianapolis, the home stadium of his All-Pro brother, Peyton. This year, Peyton seems poised to return the favor. No team is hotter through four weeks than the Denver Broncos. Although five teams are undefeated, the Broncos’ scorched-earth pace makes them the front-runners for the Super Bowl at MetLife Stadium.

At least, that is how it appears. The Broncos have outscored opponents by an average of 22 points. The Patriots are 4-0, too, but New England has won by 8 points a game. As it turns out, that differential means the Broncos are much more likely to be the better team over the rest of the season.

Consider that from 1990 to 2012, 66 teams began the season 4-0; on average, those teams won a more modest 61 percent of their games over the final three-quarters of the season. In other words, a perfect start to the season does not guarantee much, to which the 2012 Arizona Cardinals can attest.

By looking at points allowed and points scored, we can get more precise estimates of how many wins we can expect from a team over the rest of the season. Using the 66 undefeated teams to start the season since 1990, a linear regression model — using points scored and points allowed as the two input variables — has the Broncos winning 13.5 games this season, well ahead of the Patriots. (Of course, the regression model does not know that the Patriots will be getting Rob Gronkowski and Danny Amendola back from injury.)

You can read the full article here.

{ 0 comments }

Those are some clutch shirts

Those are some clutch shirts.

Eight years ago — almost to the day — our old PFR colleague Doug Drinen wrote a Sabernomics post about “The Manning Index”, a metric designed to roughly gauge the clutchness (or chokeitude) of a given quarterback by looking at how he did relative to expectations (he revived this concept in version two, six years ago). In a nutshell, Doug used the location of the game and the win differential of the two teams involved to establish an expected winning percentage for each quarterback in a given matchup. He then added those up across all of a quarterback’s playoff starts, and compared to the number of wins he actually had. Therefore, quarterbacks who frequently exceeded expectations in playoff games could be considered “clutch” while those who often fell short (like the Index’s namesake, Peyton Manning) might just be inveterate chokers.

Doug ran that study in the midst of the 2004-05 playoffs, so it shouldn’t be surprising that Tom Brady (who was at the time 8-0 as a playoff starter and would run it to 10-0 before ever suffering a loss) came out on top, winning 3.5 more games than you’d expect from the particulars of the games he started. Fast-forward eight years, though, and you get this list of quarterbacks who debuted after 1977:
[continue reading…]

{ 31 comments }

Reviewing the Divisional Round of the Playoffs

The Best Weekend of the Year lived up to its reputation this weekend, as the divisional round of the playoffs gave us three outstanding games. Here is my reaction, with a disproportionate amount of time spent on the Denver-Baltimore game, because, well, if you saw it, you’d understand.

Baltimore 38, Denver 35

One of the best playoff games in NFL history, and an instant classic. This game could be analyzed for hours and there are countless talking points (Fox playing not to lose, Manning’s playoff failures, Ray Lewis’ retirement tour making at least one last stop, Tim Tebow anyone?) that will fill up the schedules of ESPN and talk radio for weeks. But let’s start with a big picture review of the game from the perspective of the team I expected to win the Super Bowl.

If you want to assign credit and blame to Denver, this is how I would rank the five Broncos units on Saturday, from best to worst.

1) Special teams. Sure, Matt Prater missed a long field goal, but Trindon Holliday’s two return touchdowns were a thing of beauty — especially for fans of excellent blocking. Holliday’s runs were more about textbook blocking by the return unit and poor coverage by the Ravens than Holliday himself, but in any event, the Broncos special teams had a great day. In fact, here is how Pro-Football-Reference broke down the game by unit in terms of Expected Points Added:
[continue reading…]

{ 29 comments }

I was on vacation last week, so I provided just a bare bones set of NFL playoff predictions. Technically, my picks went 4-0 on Wildcard Weekend, but that doesn’t count for much when you pick the favorite in every game. With a little more time on my hands, here’s an in-depth preview of Saturday’s games. Tomorrow I’ll be previewing Sunday’s action.

Baltimore Ravens (10-6) (+9.5) at Denver Broncos (13-3), Saturday 4:30PM ET

Manning looks for to win another Super Bowl

Manning points to his glove dealer.

Most of the signs in this game point squarely in the favor of Peyton Manning and the Broncos. Baltimore has wildly underachieved on the road the last few seasons, and in Denver does not seem like the optimal place for that trend to reverse itself. From 2002 to 2010, Manning went 8-0 against the Ravens, including a 2-0 mark in playoff games. If you double his numbers in those games (to approximate a 16-game season), Manning would have thrown for 4,044 yards and 28 touchdowns against just 12 interceptions, while averaging 7.8 Y/A and 7.9 AY/A to go with a 65.6% completion rate and a 97.7 passer rating. Manning was similarly lethal in Denver’s win over the Ravens in Baltimore earlier this year.
[continue reading…]

{ 1 comment }

Is this a thinly-veiled Brady/Manning post?

Is this a thinly-veiled Brady/Manning post?

Last weekend, I looked at career rushing stats in wins and losses; today I will do the same but for quarterbacks.

I looked at all games, including playoffs, from 1960 to 2011, for all quarterbacks with at least 5,000 career passing yards over that time period. The table below lists the following information for each passer:

– His first year (or 1960, if he played before 1960) and his last year (or 2011, if still active)
– All the franchises he played for (which you can search for in the search box)
– His number of career wins, and his touchdown rate, interception rate, yards per attempt and Adjusted Yards per Attempt (which includes a 20-yard bonus for touchdown passes and a 45-yard penalty for interceptions) in wins [1]Unfortunately, I excluded sack data from this study due to its general unavailability for most of the covered time period.
– His number of career losses, and his touchdown rate, interception rate, yards per attempt and Adjusted Yards per Attempt in losses

The table is sorted by AY/A in wins; unsurprisingly, Aaron Rodgers — who is the career leader in that metric — tops this table, too. In fact, Rodgers is also the leader in AY/A in losses. Note that this table includes all games played by the quarterback, not just his starts.

RkPlayerYearsTeamsPYDWinTD%_WINT%_WY/A_WAY/A_WLossTD%_LINT%_LY/A_LAY/A_L
1Aaron Rodgers2005--2011gnb19147497.6%1.3%8.78.3274.3%2.5%7.46.4
2Matt Schaub2004--2011atl-htx17936485.3%1.7%8.78.1533.5%3.3%7.25.8
3Tony Romo2005--2011dal21666606.6%2.1%8.77.9434.3%3.4%75.5
4Kurt Warner1998--2009ram-nyg-crd36296816.8%2.2%8.77.8573.3%4.4%7.25.3
5Daunte Culpepper1999--2009min-mia-rai-det25133457.1%2.2%8.77.8643.3%4%6.95.1
6Bob Berry1965--1975min-atl9197327.4%2.3%8.67.7364.2%7.4%7.13.8
7Steve Young1985--1999tam-sfo364501256.8%1.7%8.37.6602.9%4.2%7.25.3
8Philip Rivers2004--2011sdg26105696.2%2.3%8.57.6394%3.1%7.36
9Ben Roethlisberger2004--2011pit29729905.7%2.2%8.47.6383.7%4.9%7.25
10John Friesz1990--2000sdg-was-sea-nwe8699195%1%7.87.5382.6%4%5.84
11Bart Starr1960--1971gnb22810996.6%2.9%8.67.5412.4%5.9%6.74.1
12Don Meredith1960--1968dal17750518.5%3.3%8.87.5503.5%6%6.23.6
13Drew Brees2001--2011sdg-nor43722976.5%1.7%87.4663.4%3.7%6.75.1
14Ken O'Brien1984--1993nyj-phi25598565.8%1.7%87.4722.1%3.6%6.34.7
15J.P. Losman2004--2011buf-rai-mia6271175.8%1.5%7.97.4282.5%4.4%6.14.1
16Trent Green1997--2008was-ram-kan-mia28794595.3%2.1%8.27.3633.6%3.8%7.15.5
17Rob Johnson1995--2003jax-buf-tam-was-rai5947204.8%1.5%7.97.3252.8%3.6%6.75.1
18Chad Pennington2000--2010nyj-mia19241465.1%1.2%7.77.3493.2%4.1%6.64.9
19Boomer Esiason1984--1997cin-nyj-crd38520896.6%2.4%8.27.31033.3%4.4%6.54.6
20Neil Lomax1981--1988crd23156486.4%2.1%8.17.3593%3.3%6.65.2
21David Garrard2002--2010jax16489455.3%1.4%7.87.3442.7%3.4%6.44.9
22Matthew Stafford2009--2011det8220138.1%1.8%7.97.2173.4%4.4%6.34.4
23Joe Montana1979--1994sfo-kan463231406.4%2.2%8.17.2602.7%3.4%6.34.9
24Eddie LeBaron1960--1963dal53311112.5%5.5%9.47.2314.7%8.7%7.13.3
25Peyton Manning1998--2010clt602171506.3%1.9%87.2773.9%4.1%6.95.2
26Ed Brown1960--1965chi-pit-clt7723357.7%5.8%9.77.2332.9%8.8%6.52.6
27Wade Wilson1981--1998min-atl-nor-dal-rai18605666.1%2.6%8.37.2632.4%5.3%6.23.9
28Jay Cutler2006--2011den-chi18637426.6%2.2%8.17.2382.7%4.6%6.54.5
29Josh Freeman2009--2011tam8898175.6%1.8%7.97.2242.8%4.6%6.14.1
30Tom Brady2000--2011nwe452641406.1%1.6%7.87.2433.6%4.2%6.34.5
31Matt Moore2007--2011car-mia5137176.2%1.8%7.87.1192.8%5%6.24
32Chris Chandler1988--2004clt-tam-crd-ram-oti-atl-chi29212725.9%2.6%8.27.11053.1%4.4%6.44.4
33Len Dawson1960--1975cle-kan301121058.7%3.6%8.67.1643.2%6.3%6.63.8
34Joe Flacco2008--2011rav15348494.6%1.2%7.67.1243%4.4%5.94
35Trent Edwards2007--2010buf-jax6019144%1.6%7.77.1222%4.3%5.73.8
36Jeff Garcia1999--2009sfo-cle-det-phi-tam26894635.4%1.3%7.57.1683.4%3.1%6.45.1
37Ken Anderson1971--1986cin341591006.2%2.4%87.1922.7%4.7%6.74.7
38Rudy Bukich1960--1968pit-chi7865307.5%3.5%8.57353.5%8.6%62.3
39Troy Aikman1989--2000dal367911054.8%2.1%7.97762.1%4.1%64.2
40Damon Huard1998--2008mia-nwe-kan6349204.9%1.1%7.47242%4.3%5.84
41Jim Everett1986--1997ram-nor-sdg35957665.7%2.6%8.17973.2%4.2%6.54.6
42Roger Staubach1969--1979dal254911066.1%2.5%87443.5%6.3%6.73.9
43Bert Jones1973--1982clt-ram18589476.4%3.1%8.27583.6%4.6%6.34.3
44Frank Reich1985--1998buf-car-nyj-det6858398.8%2.1%7.77393.3%4.3%6.34.4
45Jeff Hostetler1986--1997nyg-rai-was17464705.5%1.9%7.77402.3%4.1%6.34.5
46Dan Fouts1973--1987sdg45165915.9%3.2%8.36.9953.1%5.5%7.14.7
47Bill Kenney1980--1988kan17374375.9%2.5%86.9493.2%4.2%6.54.6
48Y.A. Tittle1960--1964sfo-nyg11542408.9%4.3%8.76.9232.5%6.9%5.72.7
49Mark Brunell1994--2011gnb-jax-was-nor-nyj33905994.8%1.8%7.66.9913.2%2.9%6.24.9
50Aaron Brooks2000--2006nor-rai20822415.8%1.6%7.56.9543.3%4.1%6.44.7
51Patrick Ramsey2002--2008was-nyj-den5929165.2%2.3%7.86.9243.1%3.8%5.84.2
52Scott Mitchell1992--2001mia-det-rav-cin15925406%2.1%7.76.9452.6%4.6%5.93.9
53Randy Wright1984--1988gnb7106125.4%3.4%8.36.9332.2%5.5%5.93.5
54Rich Gannon1987--2004min-was-kan-rai30434915.5%1.5%7.46.9713%3.6%6.24.6
55Earl Morrall1960--1976det-nyg-clt-mia17529927.9%4.8%8.96.9444.2%6.9%6.63.6
56Sonny Jurgensen1960--1974phi-was31546747.7%3.9%8.46.9794.5%4.9%6.84.7
57Steve DeBerg1978--1998sfo-den-tam-kan-mia-atl34752725.4%2.3%7.86.91143.2%4.9%6.44.2
58Steve Beuerlein1988--2003rai-dal-crd-jax-car-den24317645.6%2.3%7.86.8663.4%4.2%6.85
59Fran Tarkenton1961--1978min-nyg488061316.8%2.8%86.81173.6%5.5%6.54.1
60John Brodie1960--1973sfo30783786.7%3.3%8.26.8793.3%6%6.13.5
61Doug Flutie1986--2005chi-nwe-buf-sdg15209485.2%2.4%7.86.8452.9%3.9%64.3
62Johnny Unitas1960--1973clt-sdg323351076.3%3.8%8.46.8592.7%7.3%6.53.2
63Joe Namath1965--1977nyj-ram28299686.4%4%8.56.8713.3%6.8%6.53.5
64Matt Ryan2008--2011atl14832436.1%1.9%7.56.8222.4%3%6.14.8
65Craig Erickson1992--1997tam-clt-mia7625184.8%2.7%7.96.8343.2%3.9%6.54.8
66Marc Bulger2002--2009ram23758424.9%2.6%7.86.8573.1%3.3%6.85.4
67Matt Cassel2005--2011nwe-kan11769425.1%2%7.66.8303.5%3.3%5.74.3
68Tom Flores1960--1969rai-buf-kan11960408.3%3.8%8.36.8442.8%6.7%5.72.8
69Phil Simms1979--1993nyg351411025.3%2.5%7.76.7723%4.3%6.44.6
70Derek Anderson2006--2011cle-crd-car9148215.5%2.4%7.76.7322.7%4.6%5.73.6
71Michael Vick2001--2011atl-phi18889655.8%2.4%7.76.7512.8%3.4%6.34.9
72Brett Favre1991--2010atl-gnb-nyj-min776932016.3%2.2%7.66.71253.2%4.9%6.44.3
73Craig Morton1965--1982dal-nyg-den291431186.7%3.7%8.26.7822.6%6.5%6.23.4
74Steve Pelluer1985--1990dal-kan6870173.3%2.2%7.66.7262.9%4.7%6.94.8
75Dan Marino1983--1999mia658711555.7%2.4%7.76.71054.1%3.9%6.85.1
76Donovan McNabb1999--2011phi-was-min408591065.4%2%7.46.7742.9%2.6%6.15
77Dave Krieg1980--1998sea-kan-det-crd-chi-oti400421136.7%3%7.96.7983%4.4%6.54.5
78Warren Moon1984--2000oti-min-sea-kan521951085.5%2.6%7.76.61103.1%4.2%6.84.9
79Jim Kelly1986--1996buf393301106.1%3.2%86.6673.1%4.6%6.64.6
80John Hadl1962--1977sdg-ram-gnb-oti339411037%3.7%8.26.6923.3%7.8%6.12.7
81Bernie Kosar1985--1996cle-dal-mia25254674.8%1.9%7.46.6663.1%3.4%6.65.1
82Jake Delhomme1999--2011nor-car-cle-htx22822655.5%2.9%7.86.6453.1%4.2%6.64.8
83Vince Evans1977--1995chi-rai9511377.1%3.8%8.26.6572.4%6%6.33.6
84John Elway1983--1998den564391635%2.6%7.76.6922.8%3.9%6.34.6
85Drew Bledsoe1993--2006nwe-buf-dal459461025.1%1.9%7.46.6992.4%4.2%5.94
86Jason Campbell2006--2011was-rai14417323.8%1.7%7.36.6393.3%2.7%6.45.3
87Pete Liske1964--1972nyj-den-phi5170167%2.6%7.66.6232.2%8.2%5.92.3
88Jeff George1990--2001clt-atl-rai-min-was28603485.5%2.7%7.76.6853.2%2.9%6.65.4
89Alex Smith2005--2011sfo13038334.4%1.1%76.6392.9%4.3%64.1
90Jim Zorn1976--1987sea-gnb-tam21249524.9%2.9%7.86.6682.8%5.4%6.13.7
91Lynn Dickey1971--1985oti-gnb23914526.5%4.4%8.46.6763.5%6.6%74.1
92Jon Kitna1997--2011sea-cin-det-dal30104565.7%2%7.46.6862.8%4.7%6.34.3
93Eric Hipple1981--1989det11009306.3%3%7.86.6361.8%5.5%6.44
94Bob Griese1967--1980mia265591087.4%3.9%8.16.5623.5%6.4%6.43.5
95Chris Miller1987--1999atl-ram-den19789375.7%2.4%7.56.5633.6%4.2%6.34.5
96Gus Frerotte1994--2008was-det-den-cin-min-mia-ram21666585.1%2.7%7.66.5602.5%4.1%6.24.4
97Matt Hasselbeck1999--2011gnb-sea-oti35891915.1%2.4%7.56.5803%3.4%6.34.8
98Tarvaris Jackson2006--2011min-sea7239274.5%3.1%7.86.5232.8%3.4%5.84.3
99Jeff Blake1992--2005nyj-cin-nor-rav-crd-phi-chi21711425.1%2.1%7.46.5773.6%3.6%6.34.7
100Tony Eason1983--1990nwe-nyj11703355.1%2.8%7.76.5313.3%3.4%6.75.2
101Jim Harbaugh1987--2000chi-clt-rav-sdg27194784.8%2.1%7.36.5932.3%3.6%6.24.6
102Don Majkowski1987--1996gnb-clt-det12906344.8%2.8%7.76.5432.6%4.2%64.2
103Gary Hogeboom1982--1989dal-clt-crd9598315.1%2.6%7.56.5282.7%6.1%6.74
104Joe Theismann1974--1985was26988956%2.8%7.66.5592.4%5.1%6.34.1
105Randall Cunningham1985--2001phi-min-dal-rav32405986.1%2.6%7.66.5733.1%3.6%6.34.7
106Byron Leftwich2003--2010jax-atl-pit-tam10439305%1.6%7.16.5312.6%3.5%6.24.7
107Tony Banks1996--2005ram-rav-was-htx15315435.2%2.2%7.46.5522%3.7%5.94.3
108Bobby Hebert1985--1996nor-atl22331635.2%3%7.76.5553.5%5%6.24.1
109Greg Landry1968--1984det-clt-chi16100556.7%3.9%8.16.5652.5%4.7%6.34.2
110Eli Manning2004--2011nyg30095775.5%2.2%7.36.4543.7%4.5%6.74.7
111Jay Fiedler1998--2005min-jax-mia-nyj12499505%2.6%7.56.4292.5%5.9%63.4
112Stan Humphries1989--1997was-sdg18538554.4%2.3%7.46.4392.2%5.1%5.93.7
113Jim Plunkett1971--1986nwe-sfo-rai28175855.6%3.4%7.96.4823.2%7.1%6.43.2
114Elvis Grbac1994--2001sfo-kan-rav17492614.8%2.4%7.46.4393.1%4.4%6.24.3
115Richard Todd1976--1985nyj-nor21636515.2%3.6%7.96.4703.2%7%6.23.1
116Steve Grogan1975--1990nwe27457806.7%4.3%8.26.4713.5%7.2%6.83.6
117Frank Ryan1960--1970ram-cle-was15833669.3%4.4%8.26.4424%6.1%6.63.9
118Carson Palmer2004--2011cin-rai25659505.9%2.9%7.66.4593.8%3.5%6.95.3
119Shaun Hill2005--2011min-sfo-det6209185.5%1.8%7.16.4163.2%2.8%6.35.1
120Mark Rypien1988--2001was-cle-ram-phi-clt20249585.7%3.3%7.76.4472.9%3.6%6.54.9
121Bubby Brister1986--2000pit-phi-nyj-den-min14801475.7%2.3%7.36.4511.9%4.3%5.93.9
122Kerry Collins1995--2011car-nor-nyg-rai-oti-clt42478924.4%2.1%7.26.41132.7%4%6.14.3
123Steve McNair1995--2007oti-rav330681004.6%2.1%7.26.4722.6%3.4%6.44.9
124Charlie Batch1998--2011det-pit10610405.2%2.8%7.56.3373.1%3.4%6.65.1
125Bill Nelsen1963--1972pit-cle15004466.5%4.1%86.3433%7.2%6.53.4
126Charley Johnson1961--1975crd-oti-den24410687.3%4.7%8.36.3703%5.9%6.33.6
127Steve Bartkowski1975--1986atl-ram24916605.9%3.1%7.66.3733.5%5.2%6.54.3
128Sam Bradford2010--2011ram567684.1%1.5%6.96.3181.9%2.5%5.64.5
129Gary Danielson1977--1988det-cle14000424.9%2.9%7.56.3433.5%5.3%6.74.4
130Brian Sipe1974--1983cle23896606%3.2%7.66.3623%5.4%6.23.8
131Jay Schroeder1985--1994was-rai-cin-crd20854715.2%2.7%7.46.3502.7%5.3%6.64.3
132Virgil Carter1968--1976chi-cin-sdg5127215.7%3%7.56.3242.1%4.7%5.63.5
133Tommy Kramer1977--1990min-nor25651645.9%2.8%7.46.3662.9%5.7%6.23.7
134Brad Johnson1994--2008min-was-tam-dal304571024.6%2.1%7.16.2702.9%3.9%6.24.5
135Kelly Holcomb1995--2007tam-clt-cle-buf-min645395.5%3.4%7.76.2294%4.5%6.54.6
136Quincy Carter2001--2004dal-nyj6491204.7%2.2%7.16.2181.8%5.3%5.93.5
137Ryan Fitzpatrick2005--2011ram-cin-buf10936226.2%2.4%7.26.2342.9%4.5%5.93.9
138Neil O'Donnell1991--2003pit-nyj-cin-oti23399725%2%76.2582.5%2.3%6.35.4
139James Harris1969--1979buf-ram-sdg8479445.8%4.2%86.2341.8%6.6%63.1
140Brian Griese1998--2008den-mia-tam-chi19440535.2%2.8%7.46.2403.3%4.2%6.64.7
141Terry Bradshaw1970--1983pit318221257%4.3%86.2623%7.3%6.12.9
142Bill Munson1964--1979ram-det-sea-sdg-buf12940416.4%2.6%7.26.2582.8%5%6.13.9
143Steve Tensi1966--1970sdg-den5558158.5%4.4%86.1293.5%5.7%5.83.3
144Jeff Kemp1981--1991ram-sfo-sea-phi6403286.7%2.9%7.36.1261.9%5.5%6.33.8
145Ty Detmer1993--2001gnb-phi-sfo-cle-det6499184.9%2.5%7.16.1242.7%4.6%6.54.4
146Billy Wade1960--1966ram-chi11390346.1%3.5%7.66.1333.8%6.3%6.43.7
147Dave M. Brown1992--2000nyg-crd10304294.1%2.5%7.26.1421.9%4.2%5.84
148Mark Sanchez2009--2011nyj10364305.1%2%6.96.1222.9%5%6.24
149Joe Ferguson1973--1990buf-det-tam-clt30631836.4%3.1%7.46.11073%5.8%6.13.5
150Norm Snead1961--1976was-phi-min-nyg-sfo30797576.9%4.3%7.96.11143.5%6.7%6.73.7
151Dennis Shaw1970--1975buf-crd6347125.9%5.3%8.46.1342.8%8.1%6.52.9
152Vince Ferragamo1977--1986ram-buf-gnb12564357.1%3.7%7.66.1422.9%7.1%6.53.4
153Jake Plummer1997--2006crd-den30593744.7%2.5%7.16.1752.9%4.8%6.44.3
154Tommy Maddox1992--2005den-ram-nyg-pit8754275.9%3.2%7.46.1282.6%5.3%6.13.7
155Daryle Lamonica1963--1974buf-rai210821047.8%4.6%86.1373%7.3%62.8
156Kyle Orton2005--2011chi-den-kan14532364.5%1.9%6.86.1353%3.1%6.45
157Roman Gabriel1962--1977ram-phi29780875.7%2.6%7.16.1793.2%4%5.84.1
158Bob Lee1969--1980min-atl-ram5416605.9%4.8%8.16.1241.2%6.2%52.3
159David Carr2002--2010htx-car-nyg-sfo14433323.4%2.2%76.1612.7%3.4%6.24.7
160Jack Trudeau1986--1995clt-nyj-car10494253.2%2.4%7.16432.3%5.2%5.83.5
161Steve Fuller1979--1986kan-chi7454334%3.5%7.56291.9%4%6.24.5
162Danny White1976--1988dal242431245.8%4%7.76594%5.3%6.74.4
163Archie Manning1971--1984nor-oti-min23911374.4%3.2%7.461103.1%5.1%6.34.1
164Ken Stabler1970--1984rai-oti-nor305791106.6%4.6%7.96643%7.3%6.53.3
165Doug Williams1978--1989tam-was18108495.4%2.8%7.26453.1%4.8%6.54.4
166Joe Pisarcik1977--1984nyg-phi5552254.6%4.1%7.86322.1%5.7%5.73.1
167Jim McMahon1982--1996chi-sdg-phi-min-crd-gnb19260864.5%3.3%7.46402.6%3.8%6.44.8
168Milt Plum1960--1969cle-det-ram-nyg13335466.9%4.9%8.16403.1%6%6.33.7
169Ron Jaworski1974--1989ram-phi-mia-kan29859895.4%2.9%7.26793.4%4.8%6.54.4
170Rodney Peete1989--2004det-dal-phi-was-car16636554.3%3.4%7.56482.2%4.3%6.54.6
171Vinny Testaverde1987--2007tam-cle-rav-nyj-dal-nwe-car475531025.3%3.1%7.361373.3%4.5%6.74.7
172Billy Kilmer1961--1978sfo-nor-was21555886.7%3.7%7.56813.3%5.9%6.13.5
173Tim Couch1999--2003cle11131225.5%3.2%7.36402.7%4.3%64.1
174Erik Kramer1987--1999atl-det-chi-sdg16336384.9%2.4%76483.4%4.1%6.54.7
175Trent Dilfer1994--2007tam-rav-sea-cle-sfo21489685.3%2.7%7.16652%5.1%63.7
176Mike Pagel1982--1993clt-cle-ram9593224.5%2.6%7.16532.9%4.9%63.8
177Kordell Stewart1995--2005pit-chi-rav15490763.5%2.1%6.85.9542.7%5.6%5.53
178Chad Henne2008--2011mia7114143.6%1.7%6.65.9202.4%4.6%6.74.7
179Jim Hart1966--1984crd-was35156935.7%4%7.65.91032.9%5.5%6.23.8
180Vince Young2006--2011oti-phi9102354.5%3%7.15.9272.2%4.9%6.54.3
181Josh McCown2002--2011crd-det-rai-car-chi6998154.2%1.6%6.55.9362.9%5.2%6.23.9
182Mark Malone1981--1989pit-sdg-nyj10733296.3%3%7.15.8442.3%5.9%5.83.2
183Babe Parilli1960--1969rai-nwe-nyj18778647.1%4.1%7.55.8473.2%7.5%5.92.5
184Don Strock1974--1988mia-cle5913377.1%3.6%7.35.8304.5%7.3%6.63.3
185Dick Wood1962--1966sdg-nyj-rai-mia7153177.1%3.4%7.25.8282.6%7.3%5.32.1
186Shaun King1999--2004tam-crd5057195.9%2.3%6.75.8161.1%4.1%5.53.7
187Pat Haden1976--1981ram10024414.4%2.9%75.8263.1%7.1%6.43.3
188Bobby Douglass1969--1978chi-sdg-nor-gnb6493166.2%3.5%7.25.8572.1%5.8%5.12.5
189Cotton Davidson1960--1968kan-rai11451306.5%4.1%7.55.7402.9%7.2%6.33.1
190Steve Bono1985--1999min-pit-sfo-kan-gnb-ram-car10576494.6%1.8%6.45.7262.5%3.7%5.74.1
191Marc Wilson1980--1990rai-nwe14526395.8%4%7.45.7422.8%5.8%6.53.9
192Billy Joe Tolliver1989--1999sdg-atl-oti-kan-nor10760245%2.6%6.85.7533%4.1%6.14.4
193Rick Mirer1993--2003sea-chi-nyj-sfo-rai11969273.9%2.4%6.65.6521.8%4.4%5.53.5
194Steve Ramsey1970--1976nor-den6437235.4%5.9%8.15.6282.4%6.5%6.33.4
195Jacky Lee1960--1969oti-den-kan6191309%7%8.55.5294%6.9%6.63.6
196Hugh Millen1987--1995ram-atl-nwe-den644082.3%4.2%7.45.5302.4%3.6%6.85.2
197Jim Ninowski1960--1969det-cle-was-nor6953334.3%4.5%7.55.5272.6%7.4%6.22.9
198Dave Wilson1981--1988nor7007164.2%5.2%7.85.5373.1%5.5%6.23.8
199Kyle Boller2003--2011rav-ram-rai8931304.1%1.7%6.25.5362.6%4.7%5.73.6
200Joey Harrington2002--2007det-mia-atl14693274.4%2.2%6.45.5552.5%3.8%5.53.9
201Todd Blackledge1983--1989kan-pit5366225.2%3.4%6.95.5221.7%5.2%5.32.9
202Mike Tomczak1985--1999chi-gnb-cle-pit16963793.8%3.9%7.15.5593.4%5.3%6.64.2
203Mike Livingston1968--1979kan11295374.4%3.2%6.85.5522.4%5.7%6.23.7
204Danny Kanell1996--2003nyg-atl-den5328145.3%2.5%6.55.5252.2%4%4.93.2
205Steve Dils1980--1988min-ram-atl5816183.5%2.6%6.55.4292.4%3.6%5.74.1
206Jack Thompson1979--1984cin-tam5329155.3%1.8%6.15.4303.5%6.2%6.33.6
207Kent Graham1992--2001nyg-crd-pit-was7801274.4%1.6%65.4331.8%3.1%5.74.3
208David Woodley1980--1985mia-pit9203384.4%3.5%6.95.4243%7.4%6.33.1
209Randy Johnson1966--1976atl-nyg-was-gnb8329147.8%4.4%7.25.4583.2%7.6%6.33
210Rex Grossman2003--2011chi-htx-was11015304.7%3.3%6.85.4272.3%4.3%6.24.3
211Jim Miller1995--2002pit-chi6410203.9%2.9%6.65.3183%3.2%5.64.3
212Dan Pastorini1971--1983oti-rai-ram-phi19469624.6%4.2%7.15.3812.5%6.1%5.42.7
213Paul McDonald1980--1984cle5550123.8%3.4%6.85.3232.8%5.1%74.7
214George Blanda1960--1975oti-rai220291428.4%6%7.85.3793.9%8%6.12.5
215Jack Kemp1960--1969sdg-buf22256714.6%5.2%7.55.2462.2%7.1%6.23
216David Whitehurst1977--1983gnb6205216.1%5.3%7.45.1301.1%5.4%5.73.3
217Zeke Bratkowski1960--1971chi-ram-gnb8005304.7%5.5%7.55.1453.5%8.9%6.62.7
218Steve Spurrier1967--1976sfo-tam6878486.4%4.9%7.15.1532.2%5.2%5.43.1
219Joe Kapp1967--1970min-nwe6746266.6%6.2%7.75.1262.2%8.1%5.72.1
220Bob Avellini1975--1984chi7288304.2%5.9%7.55362.3%6.8%5.72.7
221Frank Tripucka1960--1963den7676135.1%5.9%7.55293.3%6.7%5.22.3
222Pete Beathard1964--1973kan-oti-crd-ram8544404.5%5.3%7.24.9342.5%7.3%5.62.4
223Gary Cuozzo1963--1972clt-nor-min-crd7688474.6%3.9%6.54.9352.9%5.7%63.5
224Al Dorow1960--1962nyj-buf5732145.7%5%6.94.8184.7%8.5%5.82.1
225Steve Walsh1989--1999dal-nor-chi-ram-tam-clt8248273.9%3.2%6.24.8342.4%4.5%5.93.9
226Mike Phipps1970--1981cle-chi10806504.5%3.7%6.44.8511.7%8.4%5.31.6
227Scott Brunner1980--1985nyg-crd6843163.7%3.7%6.34.7293%5.8%6.23.6
228Jack Concannon1964--1975phi-chi-gnb-det6270274.6%4.3%6.54.6322.5%6.8%5.12.1
229Mike Taliaferro1964--1972nyj-nwe-buf5241198.2%4.7%6.34.4412.2%7.2%5.11.9

[continue reading…]

References

References
1 Unfortunately, I excluded sack data from this study due to its general unavailability for most of the covered time period.
{ 0 comments }

NYT Fifth Down: Post-week 17

At the New York Times Fifth Down Blog this week, I explain my choices for the major awards this season.

Offensive Player of the Year: Adrian Peterson, Minnesota Vikings

Generally, the Most Valuable Player award is given to the best quarterback, while the Offensive Player of the Year is usually the player with the most impressive statistics. In the last five years, Tom Brady — first in 2007, and then again in 2010 — is the only player to take home both awards in the same season. Last year, Drew Brees won the award while Aaron Rodgers took home the M.V.P., but running backs Priest Holmes (2002), Jamal Lewis (2003), Shaun Alexander (2005), LaDainian Tomlinson (2006), and Chris Johnson (2009) have all won the award in the last decade. While Calvin Johnson will probably get some support for breaking Jerry Rice’s single-season record for receiving yards, Adrian Peterson has had this award locked up for a month, and finishing the season with 2,097 yards was the icing on the cake.

I don’t think you’ll find too many people arguing about this one. Peterson’s story is outstanding, and it’s hard to argue that he didn’t provide the single most impressive performance by an offensive player this year. Quarterbacks may be more valuable, but it’s hard not to just sit back and admire what Peterson’s done. Johnson’s also had a magnificent season, but he was greatly aided by the Lions also breaking the record for pass attempts in a season.

Defensive Player of the Year: J.J. Watt, Houston Texans

The shine is off the Texans, but there’s no denying that their star lineman has been outstanding this year. If the stars were aligned slightly differently — say, the Texans were streaking towards the end of the year, and Watt had a monster primetime game late — he’d have a legitimate chance at the M.V.P. award. Last month, I talked about how this award was a three-man race with the stars all coming from the 2011 Draft. In that article I also mentioned Geno Atkins as a possible darkhorse, and he’s been ever better since. But Watt has 20.5 sacks and the national reputation as the Sultan of Swatt, so this award is pretty easy to predict.

And well justified. Watt’s production as a 3-4 defensive end is remarkable. He now owns the single-season record for sacks by a player at that position, but he’s far from one dimensional. We know that he is fantastic at tipping passes at the line of scrimmage and is excellent in run support. He’s a complete player in every respect, a dominant force at a position that rarely receives media attention.

I’d select Von Miller as my runner-up and give Atkins the bronze. While Aldon Smith gets more attention because of his lofty sack totals, he’s a one-dimensional player. While he’s outstanding at that one dimension, just being a dominant pass rusher only makes him the fourth best defensive player this year. He also disappeared down the stretch, which not coincidentally began when star defensive end Justin Smith went down with a triceps injury.

Comeback Player of the Year: Peyton Manning, Denver Broncos

Peyton Manning missed the entire 2011 season, but as soon as he took the field in 2012 he became the favorite to win Comeback Player of the Year. A quarterback has won this award each of the last four years — Chad Pennington (2008), Tom Brady (2009), Michael Vick (2010), and Matthew Stafford (2011) — and the trend should continue in 2012. Comeback Player of the Year is a two-man race, and there’s no wrong answer when choosing between Manning and Peterson. If the voters could, surely the majority would pick that Manning and Peterson split the award. If ever an award called for a split, this was it.

Peyton Manning’s neck injury was considered career-threatening this time last year. Many questioned his arm strength in the pre-season and in September, but by the end of the year he was once again the best quarterback in the league. It’s simply splitting hairs picking between Manning and Peterson, who tore two ligaments in his knee just over a year ago and rebounded to rush for 2,000 yards. And let’s at least recognize Jamaal Charles, who in any other year would likely take home the award. The Kansas City running back tore the anterior cruciate ligament in his left knee last season, and rebounded to rush for over 1,500 yards in 2012. My guess is that those voters looking for a tiebreaker focus on the fact that Manning missed the entire 2011 season while Peterson ran for 970 yards and 12 touchdowns last year, making Manning more of a “comeback” story.

You can view the full post here.

{ 3 comments }

In 2011, the Broncos scored 309 points and allowed 390 points. Despite being outscored by 81 points, the Tim Tebow express still made it into the post-season. In June, I speculated that the 2012 Broncos might set the record for the largest increase in pass completions in one year, and they did just that on Sunday. They also moved into fourth place on another list.

With 481 points and 289 points allowed, Denver outscored its opponents by 192 points in 2012. Peyton Manning and Von Miller have turned the Broncos into one of the best teams in the league a year after they were one of the worst (at least, as measured by points differential). Denver improving their points differential by a whopping 273 points this year relative to 2011, the fourth largest increase in football history.

RankYearTeamPFPADiffN-1 PFN-1 PAN-1 DiffImpr
11999St. Louis Rams526242284285378-93377
21929New York Giants3128622679136-57283
32001Chicago Bears338203135216355-139274
42012Denver Broncos481289192309390-81273
51998Minnesota Vikings556296260354359-5265
61975Baltimore Colts395269126190329-139265
72004San Diego Chargers446313133313441-128261
82006New Orleans Saints41332291235398-163254
91965Chicago Bears409275134260379-119253
102008Baltimore Ravens385244141275384-109250
111955Washington Redskins24622224207432-225249
121976New England Patriots376236140258358-100240
131963Oakland Raiders36328281213370-157238
141997New York Jets34828761279454-175236
151923Columbus Tigers119358424174-150234
161987Indianapolis Colts30023862229400-171233
171991Cleveland Browns293298-5228462-234229
181967New York Giants369379-10263501-238228
191969Atlanta Falcons2762688170389-219227
202010Detroit Lions362369-7262494-232225
211976Chicago Bears25321637191379-188225
222001Cleveland Browns285319-34161419-258224
231999Indianapolis Colts42333390310444-134224
242000New Orleans Saints35430549260434-174223
252010St. Louis Rams289328-39175436-261222
{ 1 comment }

These guys are pretty good.

These guys are pretty good.

After posting about SRS-style quarterback ratings on Monday, I was thinking about other things we can do with game-by-game data like that. In his QBGOAT series, Chase likes to compare QBs to the league average, which makes a lot of sense for all-time ratings — you want to reward guys who are at least above-average in a ranking like that. However, if we want seasonal value, perhaps average is too high a baseline.

Over at Football Outsiders, Aaron Schatz has always compared to “replacement level”, borrowing a concept from baseball. I like that approach, but replacement level can be hard to empirically determine. So for the purposes of this post, I wanted to come up with a quick-and-dirty baseline to which we can compare QBs.

To that end, I looked at all players who were not their team’s primary passer in each game since 2010. Weighted by recency and the number of dropbacks by each passer, they performed at roughly a 4.4 Adjusted Net Yards Per Attempt level. This is not necessarily the replacement level, but it does seem to be the “bench level” — i.e., the ANYPA you could expect from a backup-caliber QB across the league.

Using 4.4 ANYPA as the baseline, we get the following values for 2012:

QuarterbackQBYAB
Tom Brady1888.1
Peyton Manning1708.2
Matt Ryan1453.4
Drew Brees1441.8
Aaron Rodgers1337.4
Robert Griffin III1226.6
Matt Schaub1205.1
Josh Freeman1140.1
Cam Newton1128.2
Tony Romo1120.2
Ben Roethlisberger1082.8
Carson Palmer1011.9
Eli Manning1002.9
Joe Flacco914.8
Russell Wilson890.5
Matthew Stafford834.1
Andy Dalton756.9
Andrew Luck691.6
Sam Bradford616.3
Alex Smith558.5
Colin Kaepernick506.5
Ryan Fitzpatrick481.1
Philip Rivers447.7
Ryan Tannehill409.6
Brandon Weeden320.4
Michael Vick317.5
Jake Locker316.9
Jay Cutler293.8
Chad Henne217.4
Kirk Cousins156.8
Nick Foles152.5
Shaun Hill151.9
Matt Hasselbeck134.0
Kevin Kolb121.4
Blaine Gabbert92.2
Christian Ponder91.0
Mohamed Sanu87.7
Kyle Orton62.8
Matt Moore52.5
Derek Anderson30.1
Matt Flynn23.7
Dan Orlovsky17.6
Greg McElroy11.4
Tyrod Taylor9.2
Rusty Smith9.1
Chase Daniel5.6
Tyler Thigpen2.7
Graham Harrell-1.6
Terrelle Pryor-4.4
Matt Leinart-5.1
David Carr-5.9
Tim Tebow-6.3
Mark Sanchez-13.3
Charlie Batch-17.8
Kellen Clemens-22.4
Ryan Mallett-45.9
Byron Leftwich-46.6
Matt Cassel-47.7
Brad Smith-50.0
T.J. Yates-55.1
Jason Campbell-88.4
Brady Quinn-146.4
John Skelton-309.2
Ryan Lindley-382.0

If we weigh each game by how recent the results took place, we get this list:

QuarterbackWgtd QBYAB
Tom Brady1527.6
Drew Brees1205.4
Peyton Manning1202.0
Matt Ryan1129.8
Aaron Rodgers1109.4
Tony Romo961.1
Cam Newton936.6
Matt Schaub900.3
Robert Griffin III869.5
Eli Manning795.5
Ben Roethlisberger793.9
Josh Freeman790.3
Carson Palmer760.4
Russell Wilson722.9
Matthew Stafford687.5
Joe Flacco666.3
Andy Dalton520.4
Andrew Luck479.9
Sam Bradford459.9
Colin Kaepernick443.0
Alex Smith399.3
Philip Rivers384.9
Ryan Fitzpatrick324.0
Ryan Tannehill313.1
Brandon Weeden266.5
Michael Vick249.9
Jay Cutler236.8
Jake Locker192.4
Chad Henne178.7
Kirk Cousins158.7
Nick Foles150.5
Matt Hasselbeck133.1
Shaun Hill84.4
Kevin Kolb70.6
Matt Moore64.8
Kyle Orton59.8
Mohamed Sanu47.4
Matt Flynn47.4
Blaine Gabbert39.9
Dan Orlovsky26.3
Tim Tebow16.3
Derek Anderson16.3
Greg McElroy10.3
Chase Daniel5.1
Rusty Smith4.8
Tyrod Taylor4.0
Tyler Thigpen-0.8
Graham Harrell-1.4
Matt Leinart-2.8
David Carr-3.3
Terrelle Pryor-4.4
Charlie Batch-7.6
Kellen Clemens-14.0
Matt Cassel-24.2
T.J. Yates-29.7
Brad Smith-33.2
Byron Leftwich-38.3
Christian Ponder-39.4
Ryan Mallett-44.6
Jason Campbell-51.1
Mark Sanchez-91.0
Brady Quinn-113.4
John Skelton-263.6
Ryan Lindley-340.5

This kind of thing isn’t exactly the most advanced stat in the world, but it’s pretty good if you want to sort QBs into general groups based on how good they are (the assumption being that a player who never plays is implicitly a bench-level player by definition).

{ 2 comments }
Previous Posts