by Chase Stuart
on January 28, 2017

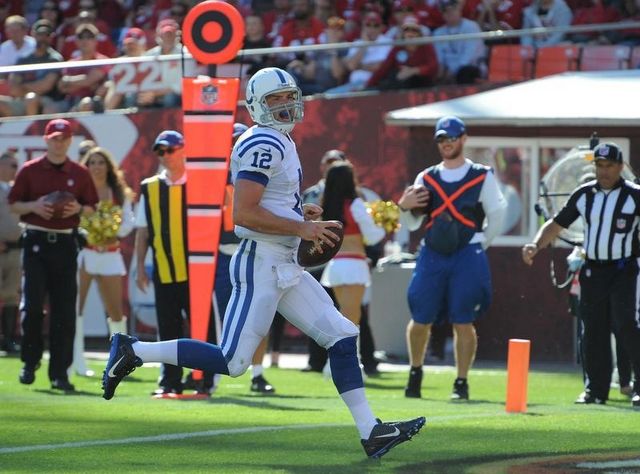
The two leaders in ANY/A in 2016.
and
Tom Brady finished the season ranked 1st and 2nd in the NFL in Adjusted Net Yard per Attempt. How unusual is that?
- In 1966, Bart Starr led the NFL in ANY/A and was the NFL MVP. Len Dawson led the AFL in ANY/A, and was the AFL’s first-team All-Pro selection at quarterback (running back Jim Nance was the MVP). The Packers and Chiefs met in the Super Bowl, of course, making it one of just two times that the Super Bowl featured two first-team All-Pro choices at quarterback. The other? Super Bowl III, featuring Earl Morrall and Joe Namath).
- In 1971, Roger Staubach had a historically great season, producing a remarkable 7.81 ANY/A. The runner-up that year was Bob Griese, at 6.35, and no other passer was over 6.00. Those 1971 seasons from Staubach and Griese both ranked in the top 50 in my era-adjusted passer rating seasons, too. Alan Page was the AP MVP choice that year, Staubach won the Bert Bell Award for Player of the Year, and Griese won the third MVP, given by the NEA. So when the Cowboys and Dolphins met in the Super Bowl, it featured two MVP quarterbacks, a feat that could be matched this year. The PFWA has already named Ryan as its MVP, but the AP or the Bert Bell Award could choose Brady, which would give us another set of dueling MVPs.
- In 1984 Dan Marino was a unanimous MVP (AP, NEA, PFWA, Bert Bell) on the back of a groundbreaking performance. His raw numbers (48 TDs, 5,084 yards) were remarkable, but so was his 8.94 ANY/A average. Joe Montana had a darn good year, too: his 49ers went 15-1 and his 7.93 ANY/A was 1.24 ANY/A better than any quarterback not named Marino. From an ANY/A dominance standpoint, it’s very similar to what Ryan and Brady have done this year.
[continue reading…]
Tagged as:
Matt Ryan,
Super Bowl,
Super Bowl LI,
Tom Brady
{ }
by Chase Stuart
on January 26, 2017
Before last year’s Super Bowl, I wrote that Carolina led the NFL in points scored in a unique way. What made the Panthers scoring success so unusual? Most notably were these two facts:
- Carolina ranked only 11th in yards, the worst-ever ranking for the top-scoring team; and
- Carolina ranked only 9th in NY/A, the worst-ever ranking for the top-scoring team.
With the Patriots, you may be surprised to learn that while New England finished 1st in points allowed, the defense ranked just 16th in DVOA. There are a few explanations here:
- The Patriots faced by far the easiest schedule of any defense in the NFL. New England’s SOS was -7.1%, while Tennessee was 31st at -4.2%, and the Bills were 30th at -3.0%. The Patriots would be tied for 8th in DVOA if that metric was not adjusted for strength of schedule, which is why the defense falls to 16th with those adjustments.
- New England had just 11 turnovers, tied with the Falcons for fewest in the league. Combined with a generally good offense, and the average opponent’s drive against New England started inside the 25-yard line, the best in the league. That means the Patriots defense had a lot of turf behind them, making life much easier for the defense.
- Opposing kickers missed 8 of 29 attempts, including three from within 45 yards. In addition, the Patriots were 8th in red zone defense and 3rd in goal-to-go defense, which helps the points allowed numbers.
New England’s defense was hardly bad by traditional numbers: the Patriots ranked 8th in total yards allowed, 6th in Net Yards per pass Attempt allowed, and 3rd and 4th in yards per carry allowed and rush defense DVOA. That’s a good defense, but again, is boosted by the very easy schedule. [continue reading…]
Tagged as:
Matt Ryan,
Patriots,
Super Bowl,
Super Bowl LI
{ }
by Chase Stuart
on December 27, 2016
Matt Ryan leads the NFL in the following categories:
- Touchdown Rate, at 6.8%
- Yards per Attempt, at 9.3
- Adjusted Yards per Attempt, at 10.0
- Yards per Completion, at 13.3
- Passer Rating, at 115.5
- Net Yards per Attempt, at 8.21
- Adjusted Net Yards per Attempt, at 8.90
Ryan also ranks 3rd in passing yards and 3rd in passing touchdowns, despite leading in the rate versions of those categories, because Ryan only ranks 18th in pass attempts, and that’s despite not missing any games. The Falcons rank 27th in pass attempts. The Falcons rank 12th in rushing attempts, but only rank 25th in total plays.
Why is that? Well, Atlanta only ranks 27th in offensive drives. And why is that? One reason is that the Falcons defense isn’t good at getting off the field. The Falcons defense is allowing 6.1 plays per drive, at a 2:45 minute clip per drive, and resulting in 2.18 points per drive. All three of those metrics place Atlanta in the bottom quarter of the league, as does Atlanta’s 41.6% third down rate. Even worse, the Falcons have the worst red zone defense in the league.
The Falcons have also scored 5 return touchdowns this year, which negated five potential possessions for the offense. But there’s another reason Atlanta has so few drives and plays this year: the offense is really, really good. Just 55 drives have ended in a punt or turnover this year, the fewest in the league. The Falcons are also the only team to have over half of its drives end in a score. If Atlanta had more three-and-outs, they’d have more drives and maybe more plays, but completed passes keep the clock running.
If the Falcons had a better defense, Ryan would probably have more pass attempts this year, and he might be producing some better raw numbers. If he had 5,200 passing yards, it would be clearer to the average fan that this is a historically great season. And because Atlanta tends to run near the goal line, the team ranks 3rd in rushing touchdowns, which depresses Ryan’s touchdown totals (though provides some assistance to his yards per attempt numbers). Instead, we have to focus on his rate numbers. So, which league-leading rate number is the best? [continue reading…]
Tagged as:
Falcons,
Matt Ryan
{ }
by Chase Stuart
on October 1, 2016
Julio Jones is typically the main driver of the Falcons offense. Last year, he had 33% of all Atlanta targets, and in 2014, he had 28% of Atlanta’s targets in the 15 games he played. But, as Adam Harstad noted, Jones has just under 20% of Atlanta’s targets this year.
Entering the season, Jones had averaged over 100 receiving yards per game over his previous 57 games, while the book on Matt Ryan was that he had reached his ceiling (or was on the downward slope of his career).
But this year, Ryan leads the league in yards per attempt, while the Falcons lead the NFL in both points and yards. If I told you that before the season, you would probably have guessed that Jones had about 500 yards, but in fact, he’s having a below-average year by his standards: he’s averaging a career low 63 yards per game, likely due to a calf injury that kept him to just 16 yards last week.
But right now, Ryan is averaging 9.4 yards per pass on throws to Jones, and and 9.5 yards per pass on throws to everyone else! Regular readers know I am not a fan of yards per target, but it is interesting to look at in certain situations. Let’s take a look at Atlanta’s breakdown: [continue reading…]
Tagged as:
Julio Jones,
Matt Ryan
{ }
by Chase Stuart
on April 14, 2014

Luck's rushing ability makes him a QBR star.
A few weeks ago, I put ESPN’s Total QBR under the microscope. Today, I want to look at the quarterbacks whose passing statistics most differ from their QBR grades.
Total QBR grades go back to 2006, so to start, I ran a regression using Adjusted Net Yards per Attempt to predict Total QBR. The best-fit formula was:
Total QBR = -13.5 + 11.23 * ANY/A
For those curious, the R^2 was 0.80, indicating a very strong relationship between ANY/A and Total QBR. What this formula tells us is that a passer needs to average 5.65 ANY/A to be “projected” to have a QBR of 50; from there, every additional adjusted net yard per attempt is worth 11.2 points of QBR. Last year, Peyton Manning averaged 8.87 ANY/A, which projects to a QBR of 86.2. In reality, Manning had a QBR of “only” 82.9; this means Manning’s QBR says he wasn’t quite as amazing as his excellent efficiency numbers would indicate (to say nothing of his otherworldly gross numbers). One likely reason for this result is that Manning ranked 29th in average pass length in the air (according to NFLGSIS) and 6th in yards after the catch per completion; this matters because ESPN gives more credit to quarterbacks on the yards they accumulate through the air. (Throughout this post, we will be forced to deal with educated guesses, because Total QBR is a proprietary formula.)
As it turns out, Manning rating higher in actual QBR than projected QBR is a stark departure from prior years. In 2012, he finished 7.2 points higher in actual QBR than projected QBR, but that’s nothing compared to his time with the Colts. In five years in Indianapolis during the Total QBR era, Manning finished at least 10 points higher in actual QBR each season.
Along with Manning, Matt Ryan and Andrew Luck are the two quarterbacks who are most likely to over-perform relative to their “projected” ratings. Let’s be careful about exactly what this means: whatever the ingredients that go into the QBR formula that don’t go into the ANY/A formula, Manning, Ryan, and Luck seem to have a lot of them.
Luck is a fascinating case. In 2012, he ranked just 20th in ANY/A, but 11th in QBR. I wrote several articles during Luck’s rookie season about how his QBR ratings surpassed his standard stats. Last year, he ranked 16th in ANY/A and 9th in QBR. Does this make Luck the quarterback most underrated (if you buy into QBR) by his traditional passing numbers (if you buy into ANY/A)? [continue reading…]
Tagged as:
Alex Smith,
Andrew Luck,
Brandon Weeden,
ESPN QBR,
Matt Ryan,
Nick Foles,
Peyton Manning,
Vince Young
{ }
by Chase Stuart
on July 28, 2013
An interesting tweet from Adam Schefter today: Matt Ryan has 56 regular season wins in his first five seasons, the most in NFL history. Ryan has started 78 games, one of only three quarterbacks (Peyton Manning, Joe Flacco) to start at least 75 games in their first five seasons.
I thought it would be interesting to take a look at not just quarterback wins, but quarterback winning percentage (minimum: 15 wins) and wins minus losses (as a compromise between winning percentage and wins). As it turns out, Ryan ranks 1st in wins, 7th in winning percentage, and 1st in wins over losses (or wins over .500) among all quarterbacks to enter the league since 1960.
Of course, having a good (or bad) winning percentage early in a quarterback’s career doesn’t tell us how much of a “winner” that quarterback will be in the future.
Tagged as:
Matt Ryan,
QB Starts,
wins
{ }
by Chase Stuart
on January 17, 2013

And then he asked me what my deal was.
A couple of interesting notes, courtesy of
Mike Sando on ESPN.com. The first is a good bit of trivia:
Jim Harbaugh joins
George Seifert,
Barry Switzer and
Rex Ryan as the only head coaches to reach the AFC or NFC Championship Game in each of their first two seasons as an NFL head coach. The second piece of information provides a possible clue as to how the game might unfold for Atlanta. Including the playoffs, the Falcons have allowed 8.9 yards per rush to quarterbacks this season, the worst rate in the NFL (excluding kneel downs).
To be fair, only three quarterbacks have done anything of note on the ground against the Falcons this year. Michael Vick rushed 7 times for 42 yards in a 30-17 loss. Vick had two first down carries that went for four yards, two third and long carries that went for 10 total yards but no first downs, and then three runs on 3rd and 3 or 4 where he picked up the first down. That’s not good, but not too alarming.
[continue reading…]
Tagged as:
49ers,
Colin Kaepernick,
Falcons,
Jim Harbaugh,
Matt Ryan,
Mike Smith,
Playoffs
{ }
by Chase Stuart
on January 14, 2013
The Best Weekend of the Year lived up to its reputation this weekend, as the divisional round of the playoffs gave us three outstanding games. Here is my reaction, with a disproportionate amount of time spent on the Denver-Baltimore game, because, well, if you saw it, you’d understand.
Baltimore 38, Denver 35
One of the best playoff games in NFL history, and an instant classic. This game could be analyzed for hours and there are countless talking points (Fox playing not to lose, Manning’s playoff failures, Ray Lewis’ retirement tour making at least one last stop, Tim Tebow anyone?) that will fill up the schedules of ESPN and talk radio for weeks. But let’s start with a big picture review of the game from the perspective of the team I expected to win the Super Bowl.
If you want to assign credit and blame to Denver, this is how I would rank the five Broncos units on Saturday, from best to worst.
1) Special teams. Sure, Matt Prater missed a long field goal, but Trindon Holliday’s two return touchdowns were a thing of beauty — especially for fans of excellent blocking. Holliday’s runs were more about textbook blocking by the return unit and poor coverage by the Ravens than Holliday himself, but in any event, the Broncos special teams had a great day. In fact, here is how Pro-Football-Reference broke down the game by unit in terms of Expected Points Added:
[continue reading…]
Tagged as:
2-point conversions,
Colin Kaepernick,
Joe Flacco,
John Fox,
Matt Ryan,
Peyton Manning,
Playoffs,
Russell Wilson,
Tom Brady
{ }
by Chase Stuart
on January 13, 2013
Yesterday, I previewed Saturday’s games with um, mixed results (skip the Denver-Baltimore preview and just read the San Francisco-Green Bay breakdown twice). Let’s take another crack at it by examining Sunday’s matchups.
Seattle Seahawks (11-5) (+1) at Atlanta Falcons (13-3), Sunday, 1:00PM ET

Did you know Marshawn Lynch eats Skittles?
Once again, Atlanta is tasked with facing a
dominant wildcard team. Is this the year
Matt Ryan finally
silences his critics?
Atlanta is only a one-point favorite, just the seventh time a home team has been given such little respect this late in the season since 2000. Home teams are 3-3 when underdogs or small favorites over that span in the divisional conference championship rounds, although one of those losses came by the Falcons in 2010 against the Packers when Atlanta was a 1.5-point favorite. But let’s focus on these two teams, because the stats might surprise you.
Russell Wilson edges Matt Ryan in Y/A (7.9 to 7.7), AY/A (8.1 to 7.7), and passer rating (100.0 to 99.1), despite having a significantly worse set of receivers. Ryan does have the edge in NY/A (7.0 to 6.8) but the two are deadlocked in ANY/A at 7.0. Both quarterbacks led four 4th quarter comebacks this year, and Wilson led 5 game-winning drives while Ryan led six. Considering one quarterback has Roddy White, Julio Jones, and Tony Gonzalez, and the other is a 5’10 rookie, I consider this pretty remarkable.
[continue reading…]
Tagged as:
Arian Foster,
Falcons,
J.J. Watt,
Matt Ryan,
Matt Schaub,
Patriots,
Playoffs,
Russell Wilson,
Seahawks,
Texans,
Tom Brady
{ }
by Chase Stuart
on January 10, 2013

Matt Ryan is about to throw a touchdown or an interception, depending upon the month.
For the second time in three years, the Atlanta Falcons are the NFC’s number one seed. Just like
in 2010, the Falcons started this season 13-2 but ended the year with only
11 Pythagorean wins. In 2010, Atlanta lost its first game to the #6 seed Packers, who sported the highest SRS of any NFC team in 2010. This year, Atlanta hosts the #6 seed Seahawks, who finished 2012 with
highest SRS of any NFC team. History suggests that
this is a difficult challenge for Atlanta, regardless of the Falcons’ lofty record.
One of the obvious topics the mainstream media has hit on this week has been Matt Ryan’s inability to win in the playoffs. As everyone knows, Atlanta is 0-3 in the playoffs in the Mike Smith/Matt Ryan era. As Ryan prepares for his fourth playoff start on Sunday, history offers some comfort: four other quarterbacks (since 1950) have been in exactly the same situation, entering their fourth playoff start with an 0-3 record. Those quarterbacks went 3-1 in their fourth game. Let’s stroll down memory lane.
- At age 37, Y.A. Tittle and the New York Giants went to Soldier Field to battle the famed 1963 Bears. Tittle had gone 0-3 in his previous three NFL playoff games, and had lost his lone playoff game in the AAFC, too. In 1957, Tittle was on the wrong side of the most famous comeback in playoff history prior to Bills/Oilers. In that game, Tittle threw three touchdowns against the Lions as San Francisco opened up what looked to be an insurmountable 27-7 lead. But Tittle finished the day with three interceptions, and the Lions came back and won, 31-27. In 1961, Tittle was with the Giants, and was part of an embarassing 37-0 shutout on the quite literal frozen tundra of Lambeau Field. Tittle was a miserable 6/20 for 65 yards with 4 interceptions. The next year, the Giants and Packers met again, this time at a frozen and windy Yankee Stadium, with the Packers again topping the Giants. So you can imagine that when Tittle and the Giants had to travel to Soldier Field in 1963 — the Giants third straight year in the title game — Tittle probably carried the choker label. With a wind chill of -11 degrees, the weather was again miserable, and the result was more of the same for Tittle and New York. The Giants lost 14-10, and Tittle threw 1 touchdown against 5 interceptions.
- Jack Kemp took the Chargers to the AFL title game in the league’s first two seasons. On New Year’s Day 1961, Kemp was outplayed by Houston’s George Blanda, and Billy Cannon put the final nail in the coffin as the Oilers won, 24-16. The Oilers and Chargers met again in the title game the following year — this time in San Diego — but Kemp had a miserable game, throwing 4 interceptions as the Chargers lost, 10-3. By 1963, Kemp was with the Bills, and Buffalo had finished the year tied with the Patriots, setting up a one-game playoff for the division title at War Memorial Stadium. But Kemp struggled and was benched for Daryle Lamonica at halftime, as the Bills lost 26-8. In 1964, the Bills went 12-2, and entered the AFL title game against Kemp’s old team, San Diego. At this time, Kemp had an 0-3 post-season record, and surely Chargers fans taunted the citizens of Buffalo by calling Kemp the Mayor of Chokesville. While Kemp did not produce stellar numbers, the Bills managed to defeat the Chargers and capture their first AFL championship. The hero of the game may have been Mike Stratton, who produced the “hit heard round the world” early in the game, knocking out San Diego’s Keith Lincoln. In any event, the Mayor of Chokesville was able to abdicate his throne.
[continue reading…]
Tagged as:
Falcons,
Matt Ryan,
Playoffs
{ }