by Chase Stuart
on January 25, 2018
Nick Foles is no stranger to great games. He has the greatest passing game in Eagles history, recorded on November 3rd, 2013 against the Raiders. Foles completed 22 of 28 passes for 406 yards and 7 touchdowns, with just one sack for one yard and zero interceptions. That translates to a whopping 18.79 Adjusted Net Yards per Attempt.
We can adjust that result for both era and quality of defense: Oakland’s pass defense was bad that season, allowing 7.41 ANY/A to opposing passers, but even still, that means Foles still averaged well over 11 more ANY/A against the Raiders than the average passer that season. Over the course of his 29 dropbacks, Foles provided 330 ANY above expectation, easily the best game in Eagles history. In fact, it’s one of just eight games since 2002 with over 300 ANY over expectation, joining three Peyton Manning games (against the Broncos in both the ’03 and ’04 playoffs, and with the Broncos against the Ravens in the 2013 Kickoff Classic), two Ben Roethlisberger games (Packers 2009, Colts 2014), and performances by Drew Brees (Patriots, 2009) and Kurt Warner (Packers, 2009 playoffs).
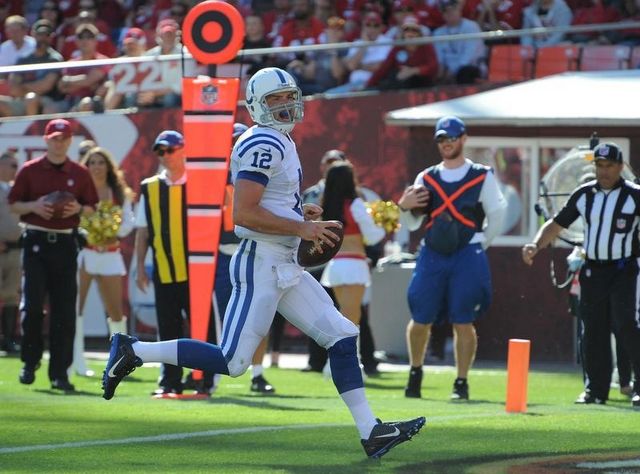
But then, against the Vikings, Foles had another masterpiece. And what made this one particularly special was that it came against a really good Minnesota defense. During the regular season, the Vikings allowed just 4.57 ANY/A, second best in the NFL. But in the NFC Championship Game, Foles was 26 for 33 for 352 yards with 3 TDs and no interceptions, with one sack for six yards. That translates to 406 Adjusted Net Yards on 34 dropbacks, or 11.94 ANY/A. That is 7.37 ANY/A above what the average opposing QB produced against the Vikings during the regular season; over the course of 34 dropbacks, that translates to 250 Adjusted Net Yards of added value.
[continue reading…]
Tagged as:
Nick Foles
{ }
by Chase Stuart
on April 14, 2014

Luck's rushing ability makes him a QBR star.
A few weeks ago, I put ESPN’s Total QBR under the microscope. Today, I want to look at the quarterbacks whose passing statistics most differ from their QBR grades.
Total QBR grades go back to 2006, so to start, I ran a regression using Adjusted Net Yards per Attempt to predict Total QBR. The best-fit formula was:
Total QBR = -13.5 + 11.23 * ANY/A
For those curious, the R^2 was 0.80, indicating a very strong relationship between ANY/A and Total QBR. What this formula tells us is that a passer needs to average 5.65 ANY/A to be “projected” to have a QBR of 50; from there, every additional adjusted net yard per attempt is worth 11.2 points of QBR. Last year, Peyton Manning averaged 8.87 ANY/A, which projects to a QBR of 86.2. In reality, Manning had a QBR of “only” 82.9; this means Manning’s QBR says he wasn’t quite as amazing as his excellent efficiency numbers would indicate (to say nothing of his otherworldly gross numbers). One likely reason for this result is that Manning ranked 29th in average pass length in the air (according to NFLGSIS) and 6th in yards after the catch per completion; this matters because ESPN gives more credit to quarterbacks on the yards they accumulate through the air. (Throughout this post, we will be forced to deal with educated guesses, because Total QBR is a proprietary formula.)
As it turns out, Manning rating higher in actual QBR than projected QBR is a stark departure from prior years. In 2012, he finished 7.2 points higher in actual QBR than projected QBR, but that’s nothing compared to his time with the Colts. In five years in Indianapolis during the Total QBR era, Manning finished at least 10 points higher in actual QBR each season.
Along with Manning, Matt Ryan and Andrew Luck are the two quarterbacks who are most likely to over-perform relative to their “projected” ratings. Let’s be careful about exactly what this means: whatever the ingredients that go into the QBR formula that don’t go into the ANY/A formula, Manning, Ryan, and Luck seem to have a lot of them.
Luck is a fascinating case. In 2012, he ranked just 20th in ANY/A, but 11th in QBR. I wrote several articles during Luck’s rookie season about how his QBR ratings surpassed his standard stats. Last year, he ranked 16th in ANY/A and 9th in QBR. Does this make Luck the quarterback most underrated (if you buy into QBR) by his traditional passing numbers (if you buy into ANY/A)? [continue reading…]
Tagged as:
Alex Smith,
Andrew Luck,
Brandon Weeden,
ESPN QBR,
Matt Ryan,
Nick Foles,
Peyton Manning,
Vince Young
{ }
by Chase Stuart
on February 21, 2013
Russell Wilson is too awesome for snide comments.
Since 1990, there have been 48 rookie quarterbacks that threw at least 224 pass attempts, the necessary amount to qualify for the league’s efficiency ratings. There are many conventional ways to measure rookie quarterbacks, but the off-season lets us play around with more obscure measures.
For example, have you ever considered how rookie quarterbacks performed compared to how their teams passed in the prior year? David Carr, Tim Couch, and Kerry Collins took over expansion teams, but we can compare the passing stats of the other 45 rookie quarterbacks to the team stats from the prior season. To compare across eras, I am grading each individual and team relative to the league average each season.
Let’s start with Net Yards per Attempt. Ben Roethlisberger averaged 7.41 NY/A in 2004 when the league average was 6.14; therefore, Roethlisberger was at 121% of league average. Meanwhile, the 2003 Steelers under Tommy Maddox were at 99% of league average. For each of the 45 rookie quarterbacks, I plotted them in the graph below. The Y-axis shows how the quarterback performed as a rookie, while the X-axis shows how his team performed in the prior season. Because it makes sense to think of “up and to the right” as positive, the X-axis goes in reverse order. Take a look – I have an abbreviation for each quarterback next to his data point:
[continue reading…]
Tagged as:
Andrew Luck,
Brandon Weeden,
Nick Foles,
Robert Griffin III,
Russell Wilson,
Ryan Tannehill
{ }