
Russell Wilson is too awesome for snide comments.
For example, have you ever considered how rookie quarterbacks performed compared to how their teams passed in the prior year? David Carr, Tim Couch, and Kerry Collins took over expansion teams, but we can compare the passing stats of the other 45 rookie quarterbacks to the team stats from the prior season. To compare across eras, I am grading each individual and team relative to the league average each season.
Let’s start with Net Yards per Attempt. Ben Roethlisberger averaged 7.41 NY/A in 2004 when the league average was 6.14; therefore, Roethlisberger was at 121% of league average. Meanwhile, the 2003 Steelers under Tommy Maddox were at 99% of league average. For each of the 45 rookie quarterbacks, I plotted them in the graph below. The Y-axis shows how the quarterback performed as a rookie, while the X-axis shows how his team performed in the prior season. Because it makes sense to think of “up and to the right” as positive, the X-axis goes in reverse order. Take a look – I have an abbreviation for each quarterback next to his data point:
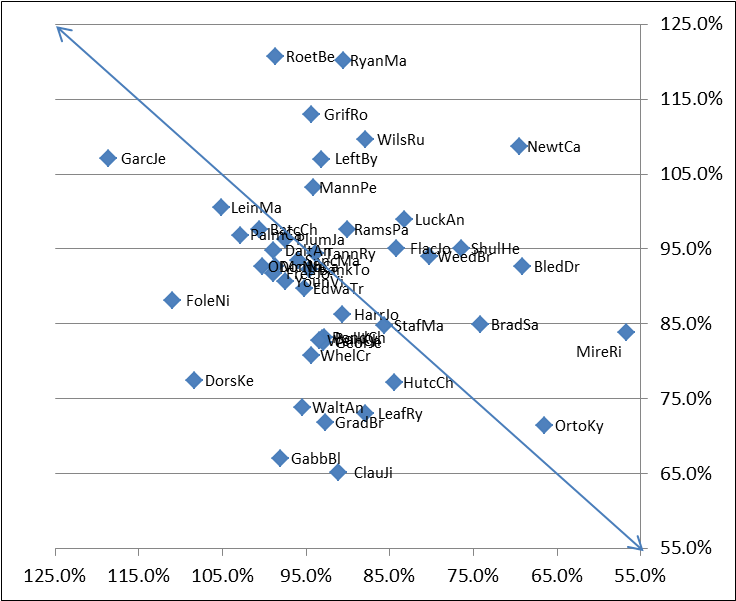
Remember, the higher (larger NY/A) and farther to the right (taking over a worse team), the more impressive (at least in theory) the rookie season. Obviously someone like Cam Newton (replacing Jimmy Clausen) has an advantage over a Jeff Garcia (replacing Steve Young) or Mark Sanchez (replacing Brett Favre), but the chart does help visualize how the rookie performed and the type of situation he entered.
Cam Newton stands out as excpetion, while even someone like Kyle Orton goes on the positive side of the ledger. Matt Ryan and Ben Roethlisberger both had excellent rookie years, but Ryan took over a worse team.
If we look at the rookie quarterbacks as measured by NY/A, Robert Griffin III ranked ahead of Russell Wilson who was ahead of Andrew Luck who was ahead of Brandon Weeden: however, the 2011 Redskins were ahead of the 2011 Seahawks who were ahead of the 2011 Colts who were ahead of the 2011 Browns. The fifth rookie quarterback, Ryan Tannehill, is a little tough to see, but he’s just a little bit to the left of Weeden on the graph: he was at 94% of the league average in ANY/A, a few tenths of a percentage point ahead of where the Matt Moore’s Dolphins were in 2011.
The worst quarterbacks? Blaine Gabbert and Ken Dorsey are the farther from the arrow, meaning they were the farthest (on the negative side) compared to the prior year’s performance. For Dorsey, he was replacing a very good quarterback in Jeff Garcia, while Gabbert failed to meet even the average standards set by David Garrard. Grading a rookie quarterback by how he performed in one statistic to the team’s prior quarterback is far too simplistic, but this is just another data point in the argument that it’s time for Jacksonville to give up on Gabbert. Some have leaped praise on Eagles rookie Nick Foles, but it’s worth remembering that his performance was still far below where the team was in 2011 (of course, the same could be said for Michael Vick).
What if we do the same thing with touchdown rate instead of NY/A?

A picture can say a thousand words, or just three: Russell Wilson – damn. The 2011 Seahawks threw touchdowns on just 2.9% of their passes, ranking 26th in the league. Russell Wilson had a 6.6% touchdown rate, ranking him second in the NFL behind Aaron Rodgers. Touchdown rate isn’t subject to the same inflation as completion percentage — in fact, touchdown rate is lower now than it was in the pre-merger NFL. That makes this stat pretty impressive: Since 1970, Dan Marino (6.8%) is the only true rookie [1]Mark Rypien had an 8.7% touchdown rate in his rookie season in 1988, but it comes with a couple of asterisks. He threw only 208 passes, below the qualifying amount, and he was drafted in 1986 and … Continue reading with a higher touchdown percentage than Wilson.
One more chart, this time looking at interception rates. Note that as in the prior charts, above 100% is better, which means fewer interceptions than average. Because of how the interception rate is skewed, I’ve had to modify the proportion of the X-axis relative to the Y-axis to make it easier to view:

Robert Griffin III’s interception rate was absurdly good — it is essentially ‘off the charts’ good — and comes a year after Washington ranked in the bottom quarter of the league in that metric. However, because interception rates are notoriously random and since a lot of really good quarterbacks struggled with interceptions as rookies, I hesitate to put too much emphasis on the metric. Interception rate is also an area where Nick Foles excelled, but so did Charlie Batch and Neil O’Donnell.
I love the graphs, but sometimes you just want to look at the numbers. The table below shows all 45 rookies in this study, and lists the team’s NY/A, Touchdown Rate, and Interception Rate in the year prior to the rookie quarterback starting, along with those same metrics during the player’s rookie season. As above, all the stats are listed as percentages of league average. The final three columns show the differentials. It is sorted by the NY/A differential. Since Newton was 9% above average in NY/A and the 2010 Panthers were 30% below average in NY/A, Newton is credited with a 39 in the NY/A differential column.
| Player | Year | Tm | N-1 NY/A | N-1 TD RT | N-1 INT RT | RK NY/A | RK TD RD | RK INT RT | NY/A Diff | TD RT Diff | INT RT Diff |
|---|---|---|---|---|---|---|---|---|---|---|---|
| Cam Newton | 2011 | CAR | 70 | 43 | 68 | 109 | 95 | 88 | 39 | 52 | 20 |
| Matt Ryan | 2008 | ATL | 90 | 77 | 116 | 120 | 94 | 111 | 30 | 18 | -5 |
| Rick Mirer | 1993 | SEA | 57 | 49 | 80 | 84 | 69 | 93 | 27 | 20 | 13 |
| Drew Bledsoe | 1993 | NWE | 69 | 76 | 90 | 93 | 97 | 93 | 23 | 21 | 3 |
| Ben Roethlisberger | 2004 | PIT | 99 | 90 | 102 | 121 | 129 | 86 | 22 | 39 | -16 |
| Russell Wilson | 2012 | SEA | 88 | 69 | 106 | 110 | 155 | 103 | 22 | 87 | -2 |
| Heath Shuler | 1994 | WAS | 76 | 58 | 83 | 95 | 97 | 70 | 19 | 40 | -13 |
| Robert Griffin III | 2012 | WAS | 94 | 75 | 72 | 113 | 120 | 207 | 18 | 44 | 135 |
| Andrew Luck | 2012 | IND | 83 | 61 | 111 | 99 | 86 | 92 | 16 | 25 | -19 |
| Byron Leftwich | 2003 | JAX | 93 | 97 | 157 | 107 | 84 | 85 | 14 | -13 | -72 |
| Brandon Weeden | 2012 | CLE | 80 | 66 | 127 | 94 | 64 | 80 | 14 | -2 | -47 |
| Joe Flacco | 2008 | BAL | 84 | 55 | 125 | 95 | 84 | 100 | 11 | 28 | -24 |
| Sam Bradford | 2010 | STL | 74 | 53 | 80 | 85 | 70 | 116 | 11 | 17 | 37 |
| Peyton Manning | 1998 | IND | 94 | 78 | 94 | 103 | 106 | 67 | 9 | 28 | -26 |
| Patrick Ramsey | 2002 | WAS | 90 | 77 | 112 | 98 | 99 | 87 | 8 | 22 | -25 |
| Kyle Orton | 2005 | CHI | 66 | 43 | 94 | 71 | 63 | 87 | 5 | 20 | -7 |
| Ryan Tannehill | 2012 | MIA | 94 | 100 | 105 | 94 | 58 | 98 | 1 | -41 | -7 |
| Matthew Stafford | 2009 | DET | 86 | 90 | 75 | 85 | 83 | 58 | -1 | -8 | -17 |
| Jake Plummer | 1997 | ARI | 97 | 96 | 99 | 96 | 129 | 60 | -1 | 33 | -39 |
| Tony Banks | 1996 | STL | 95 | 108 | 84 | 92 | 104 | 83 | -2 | -4 | -1 |
| Mark Sanchez | 2009 | NYJ | 96 | 106 | 65 | 93 | 79 | 56 | -2 | -27 | -9 |
| Charlie Batch | 1998 | DET | 101 | 90 | 97 | 98 | 85 | 166 | -3 | -4 | 69 |
| Andy Dalton | 2011 | CIN | 99 | 101 | 87 | 95 | 91 | 115 | -4 | -11 | 28 |
| Joey Harrington | 2002 | DET | 91 | 75 | 85 | 86 | 70 | 82 | -4 | -6 | -4 |
| Matt Leinart | 2006 | ARI | 105 | 80 | 98 | 100 | 74 | 100 | -5 | -6 | 2 |
| Trent Edwards | 2007 | BUF | 95 | 111 | 98 | 90 | 62 | 105 | -5 | -50 | 8 |
| Carson Palmer | 2004 | CIN | 103 | 126 | 113 | 97 | 93 | 77 | -6 | -33 | -36 |
| Cade McNown | 1999 | CHI | 99 | 76 | 125 | 93 | 86 | 79 | -6 | 10 | -46 |
| Vince Young | 2006 | TEN | 97 | 86 | 130 | 91 | 85 | 87 | -7 | -1 | -43 |
| Josh Freeman | 2009 | TAM | 99 | 82 | 122 | 92 | 83 | 50 | -7 | 1 | -72 |
| Chad Hutchinson | 2002 | DAL | 84 | 86 | 70 | 77 | 70 | 95 | -7 | -17 | 26 |
| Neil O'Donnell | 1991 | PIT | 100 | 115 | 97 | 93 | 105 | 143 | -8 | -10 | 46 |
| Christian Ponder | 2011 | MIN | 93 | 64 | 57 | 83 | 104 | 65 | -10 | 41 | 8 |
| Kyle Boller | 2003 | BAL | 93 | 104 | 104 | 83 | 79 | 81 | -10 | -25 | -23 |
| Jeff George | 1990 | IND | 93 | 90 | 113 | 83 | 113 | 91 | -10 | 23 | -22 |
| Chris Weinke | 2001 | CAR | 93 | 86 | 97 | 83 | 52 | 96 | -11 | -35 | -1 |
| Jeff Garcia | 1999 | SFO | 119 | 174 | 122 | 107 | 74 | 114 | -12 | -100 | -7 |
| Craig Whelihan | 1997 | SDG | 94 | 102 | 93 | 81 | 65 | 72 | -14 | -37 | -21 |
| Ryan Leaf | 1998 | SDG | 88 | 54 | 82 | 73 | 19 | 54 | -15 | -35 | -28 |
| Bruce Gradkowski | 2006 | TAM | 93 | 89 | 107 | 72 | 69 | 116 | -21 | -20 | 9 |
| Andrew Walter | 2006 | OAK | 95 | 91 | 130 | 74 | 27 | 67 | -22 | -63 | -62 |
| Nick Foles | 2012 | PHI | 111 | 93 | 64 | 88 | 53 | 139 | -23 | -40 | 75 |
| Jimmy Clausen | 2010 | CAR | 91 | 83 | 72 | 65 | 23 | 98 | -26 | -59 | 27 |
| Ken Dorsey | 2004 | SFO | 108 | 123 | 111 | 77 | 59 | 80 | -31 | -64 | -31 |
| Blaine Gabbert | 2011 | JAX | 98 | 127 | 66 | 67 | 68 | 109 | -31 | -60 | 43 |
References
| ↑1 | Mark Rypien had an 8.7% touchdown rate in his rookie season in 1988, but it comes with a couple of asterisks. He threw only 208 passes, below the qualifying amount, and he was drafted in 1986 and spent the first two years of his career on injured reserve. |
|---|