≡ Menu

Are Good Drafting Teams Also Bad At The Draft?

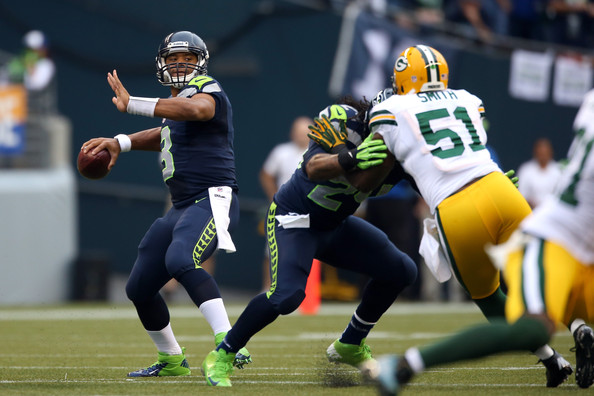
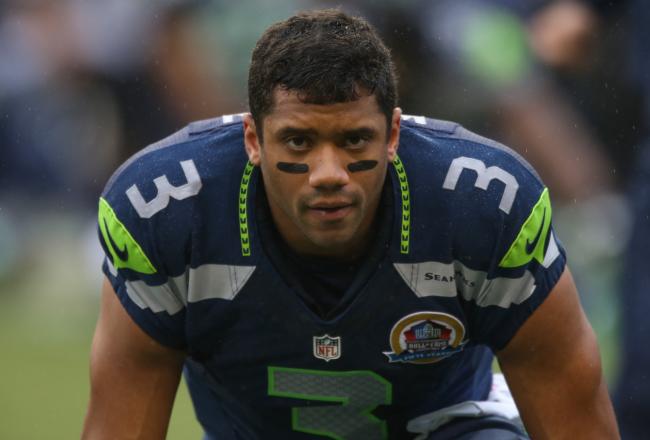
The Seahawks dominated the 2012 NFL Draft. Seattle drafted the best player, Russell Wilson, in the third round. The second most valuable pick of the draft was, by almost any measure, linebacker Bobby Wagner, a Hall of Fame candidate selected in the second round. The Seahawks even had one of the two or three best picks of the seventh round, in J.R. Sweezy.

And yet with its first pick in the draft, Seattle swung and missed on edge rusher Bruce Irvin, who played and started fewer games with the Seahawks than Sweezy.

The Redskins and Bucs had similar stories. Washington rolled snake eyes when it drafted RG3, although one could argue (depending on why you think he failed in D.C.) that his disappointing tenure with the Redskins wasn’t a fault of scouting. But the Redskins drafted Kirk Cousins in the 4th round and Alfred Morris in the 6th round — it was an extremely impressive draft once you forget the team’s first pick. Tampa Bay drafted a man without a position, safety/linebacker Mark Barron, with the seventh overall pick, and he lasted just 37 games with the team before being traded for 4th and 6th round picks. But the Bucs selected Doug Martin and Lavonte David with the team’s next two picks, and safety Keith Tandy was a good find (mostly on special teams) in the sixth round.

On the other side, you have the Panthers and Steelers. Carolina hit a home run with Luke Kuechly in the first round, but the Panthers next three picks have started just 37 games. The Panthers non-Kuechly portion of the draft was saved with Josh Norman in the sixth round, but even he only had one great year in Carolina.

Pittsburgh drafted an All-Pro in guard David DeCastro late in the first round, but the team’s next seven picks were disappointments. The Steelers final pick was OT Kelvin Beachum, a successful late round pick who started for two years in Pittsburgh. [continue reading…]

{ 1 comment }

Today’s guest post comes from Miles Wray, a long-time reader of the site. He’s written an interesting post on special teams today, but you may know him as the host of the daily NBA podcast The 82 Review. You can also find him on Twitter @mileswray. What follows are Miles’ words: as always, we thank our guest writers for their contributions.


As Chase noted in December, the Seahawks’ Russell Wilson had an opportunity to be just the fifth quarterback to lead his NFL team in rushing yards — an accomplishment that even Michael Vick can’t claim. In the final weeks of the season, Wilson absolutely coasted home with this dubious title belt: he racked up 586 rushing yards, the second-highest total in his career.

That historically rare achievement may mask the historically unprecedented scenario in Seattle’s running backs room. Since the NFL schedule expanded to 16 games in 1978, there had only been six previous times when, at the end of the regular season, a team’s leading running back or fullback finished with less than 350 total yards. [1]Excluding strike-shortened seasons. But in all six of those other cases, that leading rusher still managed to top 300 yards on the season. Well, nobody in Seattle got past 250 this year:

[continue reading…]

References

References
1 Excluding strike-shortened seasons.
{ 5 comments }

Here’s a look at the 2017 rushing leaders for the Seattle Seahawks:

No. Player Age Pos G GS Att Yds
TD Lng Y/A Y/G A/G
3 Russell Wilson 29 QB 12 12 71 432 3 29 6.1 36.0 5.9
32 Chris Carson 23 rb 4 3 49 208 0 30 4.2 52.0 12.3
27 Eddie Lacy 26 rb 9 3 69 179 0 19 2.6 19.9 7.7
21 J.D. McKissic 24 rb 9 1 33 143 1 30 4.3 15.9 3.7
34 Thomas Rawls 24 rb 9 3 50 129 0 23 2.6 14.3 5.6
39 Mike Davis 25 rb 2 2 22 82 0 22 3.7 41.0 11.0
16 Tyler Lockett 25 WR 12 7 8 46 0 22 5.8 3.8 0.7
22 C.J. Prosise 23  rb 5 0 11 23 0 8 2.1 4.6 2.2
Team Total 26.3 12 316 1233 4 30 3.9 102.8 26.3

You might have noticed that quarterback Russell Wilson actually leads the team in rushing yards.  Which is… pretty unusual.  Excluding situations when players who didn’t enter the NFL as a running back but played that position (like Ty Montgomery or Denard Robinson), only twice in the last 20 years has a non-RB led his team in rushing yards.  Do you know who and when?

Show


Before them, the last player was Randall Cunningham – who did it for the 1987, 1988, 1989, and 1990 Eagles. The only other time since the merger that a non-RB has led his team in rushing yards was Bears quarterback Bobby Douglass in 1972.

And before Douglass, you have to go back to 1960, when Lenny Moore led the Colts in rushing yards the year after moving to wide receiver (he still actually led the team in carries, too, but Alan Ameche was the fullback and Alex Hawkins was the running back; Moore finished with 936 receiving yards and 374 rushing yards). Also that year, Jets (well, Titans) quarterback Al Dorow led the expansion franchise in rushing yards.

Positional designations get a little tricky pre-1960, but a few other quarterbacks pulled off the feat in the ’50s. Tobin Rote led the Lions in rushing in 1958, and the Packers in rushing in 1951, 1952, and 1956. Charley Trippi led the Cardinals in rushing in 1951 and 1952, although the 1952 Cardinals had the greatest four-way race for a franchise rushing title you’ll ever see.

This is a long way of saying it’s going to be pretty noteworthy if Wilson leads the Seahawks in rushing, which seems very likely to happen.

{ 9 comments }

Guest Post: Passing Volume vs. Passing Efficiency

Today’s guest post comes from Ben Baldwin, a contributor for Field Gulls and Bryan’s site, http://thegridfe.com. You can find more of Ben’s work here or on Twitter @guga31bb. What follows are Ben’s words.


Arguing on the internet

A common argument on the internet (e.g. Twitter, where I spent too much time) is that the efficiency of players like Dak Prescott and Russell Wilson in their rookie seasons (and subsequent seasons, for Wilson) was not impressive because they were not asked to throw the ball as much. Once they are asked to throw more often, the argument goes, we can expect their efficiency to fall off. Here is one of many, many examples:

Do quarterbacks really look good because they throw less? [continue reading…]

{ 17 comments }

This week at the New York Times, a look at the dominant display by Russell Wilson over the last month:

The Seahawks have won four consecutive games, with the bulk of the credit going to Wilson. He has completed 89 of 118 passes (75 percent) for 1,171 yards (9.9 yards per attempt), with an incredible 16 touchdowns and zero interceptions. He has taken just five sacks in this time after struggling in that department for most of his career. He has averaged 11.93 adjusted net yards per attempt over his last four games, the best stretch of his career.

The graph below displays Wilson’s ANY/A average in each of his 69 career games, including playoffs. The blue dot represents each game, while the green line displays a rolling four-game average:

You can read the full article, and see the fun graph, here (or here).

{ 0 comments }

What is Wrong With Jimmy Graham?

With just 21 catches for 204 yards and two touchdowns through five games, Jimmy Graham is hardly making a big impact in Seattle. Consider that over his last four years in New Orleans, he averaged 5.6 receptions, 69.7 yards and 0.73 touchdowns per game, while he is at 4.2, 40.8, and 0.4 in those metrics, respectively, so far with the Seahawks.

So what’s wrong? Well, let’s start by focusing just on receiving yards. The drop from 69.7 to 40.8 is quite significant, but is there one main factor driving it? We can break receiving yards down into several components. For example, we can parse out four different metrics from simple receiving yards:

Receiving Yards = Team Pass Attempts * (Targets/Team Pass Attempt) * (Receptions/Target) * (Yards/Reception)

[continue reading…]

{ 5 comments }

Probably was picked off

Probably was picked off

I still can’t quite comprehend what happened. Leading 19-7 with less than three minutes remaining, Green Bay somehow lost the NFC Championship Game. It was the most remarkable comeback in conference championship game history since at least 2006, when Peyton Manning and the Colts came back from the dead against the Patriots.

But this game had the added element of Russell Wilson looking like he had no idea what he was doing out there. With four minutes remaining, Wilson had one of the ugliest stat lines in playoff history: he was 8/22 for 75 yards with no touchdowns, four interceptions, and four sacks for 24 yards. He was averaging -4.96 Adjusted Net Yards per Attempt. It was worse than Ryan Lindley against Carolina, a performance that would rival Kerry Collins in the Super Bowl against the Ravens for worst playoff passing performance ever.

Wilson’s stat line was straight out of a 1976 boxscore featuring a rookie quarterback against the Steelers. Yet, somehow, minutes later, the game would be in overtime. Wilson ended regulation with a still miserable stat line of 11/26 for 129 yards, with 0 touchdowns (to be fair, he did run one in), 4 interceptions, and 4 sacks for -24 yards. That translates to an ANY/A average (which gives a 45-yard penalty for interceptions, and a 20-yard bonus for touchdowns, while penalizing for sacks) of -2.50.

If the Seahawks returned the overtime kickoff for a touchdown, the game would have easily gone down as the worst performance by a playoff-winning quarterback in history. But in overtime, Wilson did his best work: first, he found Doug Baldwin for ten yards. Then, after taking a one-yard sack, he hit Baldwin on 3rd-and-7 for 35 yards. The next play, Wilson hit Jermaine Kearse for a 35-yard touchdown, and Seattle was headed back to the Super Bowl.

Wilson finished 14/29 for 209 yards, with 1 touchdown, 4 interceptions, and five sacks for -25 yards. That translates to an anemic ANY/A average of +0.71. How does that compare historically? I thought it would be worthwhile to compare the ANY/A average of every winning quarterback in a playoff game to the league average ANY/A that season. So, in 2014, the NFL averaged 6.13 Adjusted Net Yards per Attempt per pass. This means Wilson finished 5.42 ANY/A below average. And given that Wilson had 34 dropbacks, it means that Wilson produced -184 Adjusted Net Yards over average. As it turns out, that’s only the … third worst ever by a winning quarterback. [continue reading…]

{ 19 comments }

Predictions in Review: NFC West

During the 2013 offseason, I wrote 32 articles under the RPO 2013 tag. In my Predictions in Review series, I review those preview articles with the benefit of hindsight. Last week was the AFC West; this week, the NFC West.

Let’s begin in Arizona, where I actually got one right.

Questioning the Narrative on Larry Fitzgerald, June 20, 2013

The conventional wisdom was that Larry Fitzgerald was going to have a bounce-back year in 2013. That view was widely-held: in fact, I caged a lot of my negative Fitzgerald comments with caveats, as it felt like criticizing Fitzgerald was just something football writers didn’t do. Fitzgerald was one of the game’s best wide receivers when Kurt Warner was under center, and it felt wrong to argue with folks who wanted to give him a pass for the mediocre numbers he produced with John Skelton/Ryan Lindley/Kevin Kolb. With Carson Palmer in Arizona in 2013, the expectation was a big year for Fitzgerald. Instead, he produced 82 passes for only 954 yards, although he did score 10 touchdowns.

For the second year in a row, Fitzgerald failed to lead his team in receiving yards per game, with Andre Roberts (2012) and Michael Floyd (2013) instead earning those honors. So what’s happened with Fitzgerald? I have no idea, but he’s certainly not the same player he was during the Warner/Anquan Boldin days. And while the touchdowns made sure he wasn’t a complete fantasy bust, he gained just 22.2% of all Cardinals receiving yards in 2013, somehow falling short of his 23.6% mark in his miserable 2012 season. [continue reading…]

{ 6 comments }

It’s Carroll-Harbaugh X! Okay, the Whats Your Deal Bowl may not have quite the hype of Brady/Manning XV, but don’t tell that to folks on the West Coast. Pete Carroll and Jim Harbaugh are longtime rivals who have managed to alienate 31 other fanbases in the NFL. For the record, Harbaugh holds a 6-3 record over Carroll, including a 4-2 mark in the NFL. Of course, Carroll’s Seahawks won the last two games at CenturyLink Field, the site of the NFC Championship Game.

Let’s begin our preview by analyzing each team’s passing offense:

Sadly, this post is not sponsored by beats by Dre

Sadly, this post is not sponsored by beats by Dre.

Picking between Colin Kaepernick and Russell Wilson feels like an exercise in hair-splitting. Over the last two seasons, these two have nearly identical passing numbers, ranking 4th and 5th in ANY/A. Kaepernick was slightly better last year, Wilson slightly better this year, and then Kaepernick has been better in the playoffs. By ANY/A standards, this is a complete wash.

What about the weapons? That’s one area where it at least appears like the 49ers have the edge. Michael Crabtree, Anquan Boldin, and Vernon Davis are legitimate stars who combine to give Kaepernick three versatile weapons on every play. A healthy Percy Harvin changes things for Seattle, but with Harvin declared out for the game, Golden Tate, Doug Baldwin, and Zach Miller represent a clear downgrade from the 49ers bunch.

But remember, when we look at the passing statistics of Kaepernick and Wilson, those numbers already incorporate the quality of each quarterback’s targets. After all, a quarterback’s ANY/A or NY/A averages are not mere reflections of the passer, but of the passing offense as a whole. On the other hand, Kaepernick hasn’t had those three players together for most of his career. In fact, the trio has only been available in 7 of Kaepernick’s 28 career starts. In 10 starts, only Crabtree and Davis were on the team, and in another 10, Kaepernick had just Boldin and Davis. [1]There was also one start, against Indianapolis, where both Crabtree and Davis were out. The table below shows Kaepernick’s numbers as a starter depending on the availability of his three weapons: [continue reading…]

References

References
1 There was also one start, against Indianapolis, where both Crabtree and Davis were out.
{ 1 comment }

Division Preview: New Orleans at Seattle

Brees and Wilson scheming to get on an amusement park ride

Brees and Wilson scheming to get on an amusement park ride.

On the surface, this does not appear to be a very even matchup. In home games in 2013, Seattle outscored opponents by 15.4 points per game, an average that includes the loss to Arizona. In road games during the regular season, the Saints were outscored by 4.6 points per game. Both of those averages, of course, include Seattle’s 27-point demolition of the Saints in Seattle just six weeks ago. The 20-point difference between Seattle’s average home margin and the New Orleans’ average road margin — which, for brevity’s sake, I’m going to call the “projected MOV” — is very high, even by historical standards.  In fact, only 20 playoff games since 1950 featured a game with a larger projected MOV.

The table below shows the 50 playoff games with the largest projected MOV since 1950, measured from the perspective of the home team. For games since 1978, I’ve also shown the pre-game points spread. The largest projected MOV came in 1998, when the Vikings hosted the Cardinals in the playoffs. That year, Minnesota outscored teams by 23.6 points per game at home, while Arizona was outscored by 9.1 PPG on the road. Those numbers combine for a projected MOV for Minnesota of nearly 33 points! The game took place during the division round of the playoffs and the Vikings were 16.5-point favorites. You can click on the boxscore link to see the PFR boxscore for the game, which Minnesota won, 41-21.

YearHomeRoadHm PD/GRd PD/GProj MOVRdSpreadBoxscorePFPAW/L
1998MINARI23.63-9.1332.75D-16.5Boxscore4121W
1991WASDET22.88-7.530.38C-14Boxscore4110W
1973MIACIN21.86-6.7128.57DBoxscore3416W
1991WASATL22.88-426.88D-11.5Boxscore247W
1999STLTAM24.63-226.63C-14Boxscore116W
1969MINCLE24.29-1.8626.14CBoxscore277W
1978DALATL14.75-11.2526D-15Boxscore2720W
1987SFOMIN20.29-4.1324.41D-11Boxscore2436L
1979PITHOU20.38-424.38C-9.5Boxscore2713W
1950RAMCHI23.5-0.1723.67DBoxscore2414W
2008CARARI15.38-7.8823.25D-10Boxscore1333L
1999STLMIN24.631.3823.25D-7Boxscore4937W
1977RAMMIN18.86-422.86DBoxscore714L
1997DENJAX22-0.3822.38W-6.5Boxscore4217W
2011NORDET23.25122.25W-10.5Boxscore4528W
2007NWEJAX21.5120.5D-13.5Boxscore3120W
1996PITIND15-5.3820.38W-8Boxscore4214W
1996CARDAL16.5-3.7520.25D3.5Boxscore2617W
1996DENJAX14.38-5.8820.25D-12.5Boxscore2730L
1979PITMIA20.380.2520.13D-9.5Boxscore3414W
2004ATLSTL6.88-12.8819.75D-6.5Boxscore4717W
2011GNBNYG18.75-0.8819.63D-8Boxscore2037L
2007NWESDG21.51.8819.63C-14Boxscore2112W
1989SFOMIN14.88-4.3819.25D-7.5Boxscore4113W
1985CHIRAM19.50.2519.25C-10.5Boxscore240W
1969MINRAM24.295.1419.14DBoxscore2320W
1969DALCLE17.29-1.8619.14DBoxscore1438L
2009NWEBAL18.38-0.6319W-4Boxscore1433L
1973MIAOAK21.862.8619CBoxscore2710W
1998NYJJAX16.38-2.518.88D-9Boxscore3424W
2012DENBAL16.13-2.6318.75D-9Boxscore3538L
2005SEAWAS16.75-1.8818.63D-8.5Boxscore2010W
1985MIACLE13-5.6318.63D-10.5Boxscore2421W
1979SDGHOU14.63-418.63D-8Boxscore1417L
1977DALMIN14.57-418.57CBoxscore236W
1998MINATL23.635.2518.38C-11Boxscore2730L
1998DENMIA14.63-3.2517.88D-13.5Boxscore383W
2011SFONYG16.75-0.8817.63C-2Boxscore1720L
1999JAXMIA13.63-3.8817.5D-8Boxscore627W
1954CLEDET21.674.1717.5CBoxscore5610W
1991HOUNYJ15.63-1.7517.38W-9Boxscore1710W
2001PITBAL14.5-2.7517.25D-5.5Boxscore2710W
1963SDGBOS12.86-4.2917.14CBoxscore5110W
2012BALIND9.38-7.6317W-7Boxscore249W
1997SFOMIN15.38-1.6317D-11.5Boxscore3822W
1998DALARI7.75-9.1316.88W-7Boxscore720L
1969OAKHOU13.71-3.1416.86DBoxscore567W
1967OAKHOU21.714.8616.86CBoxscore407W
1996GNBCAR18.882.1316.75C-12Boxscore3013W
1988CINSEA15.38-1.3816.75D-6.5Boxscore2113W

[continue reading…]

{ 3 comments }

Brees and Wilson scheming to get on an amusement park ride

Brees and Wilson scheming to get on an amusement park ride.

New Orlean’s Drew Brees is officially listed as six feet tall. Seattle’s Russell Wilson is officially listed as 5’11. That means the average height of the starting quarterbacks in tonight’s game is 71.5 inches, tied for the shortest average in any game since 1964. In fact, it’s been twelve years since a game has featured two quarterbacks of such short stature, when in week two of the 2001 season, Doug Flutie (5’10) and the Chargers beat Anthony Wright (6’1) and the Cowboys.

The other two games since 1990 where the average height of the starting quarterbacks was below six feet also involved Flutie facing a 73-inch quarterback: a 24-21 win in 1999 against Pittsburgh and Kordell Stewart and a 17-16 win year earlier against Mark Brunell and the Jags.

Twenty-five years ago, two other Flutie vs. 6’1 Quarterback games make the list: this game against Jim McMahon and this one against Dave Krieg.

You have to go back to 1978 to find a game before tonight where (1) the average height of the starting quarterbacks was under six feet and (2) Doug Flutie was not involved. Fran Tarkenton (6’0) and Pat Haden (5’11) met five times in the mid-to-late ’70s, and Billy Kilmer (6’0) also faced Haden in the final game of the 1977 season.

Kilmer and 5’11 Bob Berry met three times in the early ’70s, and Sonny Jurgensen (5’11) faced Gary Cuozzo (6’0) and Tarkenton twice each. The only other games of the post-merger era were Len Dawson (6’0) vs. Berry in 1972 and Bill Nelsen and Edd Hargett in 1971. [continue reading…]

{ 7 comments }

Wilson does his best Roethlisberger.

Wilson does his best Roethlisberger.

On the surface, Russell Wilson and Ben Roethlisberger have almost nothing in common. Wilson was an undersized, overlooked, third-round pick, while Roethlisberger was a first round pick who is one of the most physically imposing quarterbacks in NFL history. But both players had pretty similar rookie years in a couple of respects.

In 2004, Roethlisbeger went 14-0 as the Steelers quarterback. Pittsburgh finished last in pass attempts that season, but Roethlisberger ranked 7th among quarterbacks with a 6.9 Adjusted Net Yards per Attempt average. In 2012, Wilson went 11-5 as starter, the Seahawks ranked 32nd in pass attempts, and Wilson averaged 7.0 ANY/A, the 8th-highest mark in the league. Both teams were powered by great defenses and running games, and for a long time, Roethlisberger carried the label of game manager. He also appeared in three Super Bowls, winning two of them.

Wilson threw 393 passes last season, an average of 24.6 per game. The NFL average was 34.7 pass attempts per game, which means Wilson averaged 10.1 fewer attempts per game than average. I looked at 146 different quarterbacks with at least 50 starts since 1960 and noted how many passes they attempted in their first 16 starts. As it turns out, only four of them — Tom Flores, Chris Chandler, Joe Ferguson, and Roethlisberger — were farther from league average (on the minus side) than Wilson.

In Flores’ case, he was the starter for the Raiders in 1960 but he split time with Babe Parilli: they were essentially running a quarterback-by-committee in Oakland, so that explains why Flores didn’t throw many passes.

Twenty-eight years later, a similar situation unfolded in Indianapolis. Gary Hogeboom started the season, but was quickly benched for Jack Trudeau. Once Trudeau suffered a season-ending knee injury, Chandler took over, but Hogeboom still had 13 or more pass attempts in five of Chandler’s starts.
[continue reading…]

{ 2 comments }

Russell Wilson is too awesome for snide comments.

Russell Wilson is too awesome for snide comments.

Since 1990, there have been 48 rookie quarterbacks that threw at least 224 pass attempts, the necessary amount to qualify for the league’s efficiency ratings. There are many conventional ways to measure rookie quarterbacks, but the off-season lets us play around with more obscure measures.

For example, have you ever considered how rookie quarterbacks performed compared to how their teams passed in the prior year? David Carr, Tim Couch, and Kerry Collins took over expansion teams, but we can compare the passing stats of the other 45 rookie quarterbacks to the team stats from the prior season. To compare across eras, I am grading each individual and team relative to the league average each season.

Let’s start with Net Yards per Attempt. Ben Roethlisberger averaged 7.41 NY/A in 2004 when the league average was 6.14; therefore, Roethlisberger was at 121% of league average. Meanwhile, the 2003 Steelers under Tommy Maddox were at 99% of league average. For each of the 45 rookie quarterbacks, I plotted them in the graph below. The Y-axis shows how the quarterback performed as a rookie, while the X-axis shows how his team performed in the prior season. Because it makes sense to think of “up and to the right” as positive, the X-axis goes in reverse order. Take a look – I have an abbreviation for each quarterback next to his data point:
[continue reading…]

{ 2 comments }

Reviewing the Divisional Round of the Playoffs

The Best Weekend of the Year lived up to its reputation this weekend, as the divisional round of the playoffs gave us three outstanding games. Here is my reaction, with a disproportionate amount of time spent on the Denver-Baltimore game, because, well, if you saw it, you’d understand.

Baltimore 38, Denver 35

One of the best playoff games in NFL history, and an instant classic. This game could be analyzed for hours and there are countless talking points (Fox playing not to lose, Manning’s playoff failures, Ray Lewis’ retirement tour making at least one last stop, Tim Tebow anyone?) that will fill up the schedules of ESPN and talk radio for weeks. But let’s start with a big picture review of the game from the perspective of the team I expected to win the Super Bowl.

If you want to assign credit and blame to Denver, this is how I would rank the five Broncos units on Saturday, from best to worst.

1) Special teams. Sure, Matt Prater missed a long field goal, but Trindon Holliday’s two return touchdowns were a thing of beauty — especially for fans of excellent blocking. Holliday’s runs were more about textbook blocking by the return unit and poor coverage by the Ravens than Holliday himself, but in any event, the Broncos special teams had a great day. In fact, here is how Pro-Football-Reference broke down the game by unit in terms of Expected Points Added:
[continue reading…]

{ 29 comments }

Yesterday, I previewed Saturday’s games with um, mixed results (skip the Denver-Baltimore preview and just read the San Francisco-Green Bay breakdown twice). Let’s take another crack at it by examining Sunday’s matchups.

Seattle Seahawks (11-5) (+1) at Atlanta Falcons (13-3), Sunday, 1:00PM ET

An offense where the star eats Skittle is a young one

Did you know Marshawn Lynch eats Skittles?

Once again, Atlanta is tasked with facing a dominant wildcard team. Is this the year Matt Ryan finally silences his critics?

Atlanta is only a one-point favorite, just the seventh time a home team has been given such little respect this late in the season since 2000. Home teams are 3-3 when underdogs or small favorites over that span in the divisional conference championship rounds, although one of those losses came by the Falcons in 2010 against the Packers when Atlanta was a 1.5-point favorite. But let’s focus on these two teams, because the stats might surprise you.

Russell Wilson edges Matt Ryan in Y/A (7.9 to 7.7), AY/A (8.1 to 7.7), and passer rating (100.0 to 99.1), despite having a significantly worse set of receivers. Ryan does have the edge in NY/A (7.0 to 6.8) but the two are deadlocked in ANY/A at 7.0. Both quarterbacks led four 4th quarter comebacks this year, and Wilson led 5 game-winning drives while Ryan led six. Considering one quarterback has Roddy White, Julio Jones, and Tony Gonzalez, and the other is a 5’10 rookie, I consider this pretty remarkable.
[continue reading…]

{ 5 comments }