
Probably was picked off
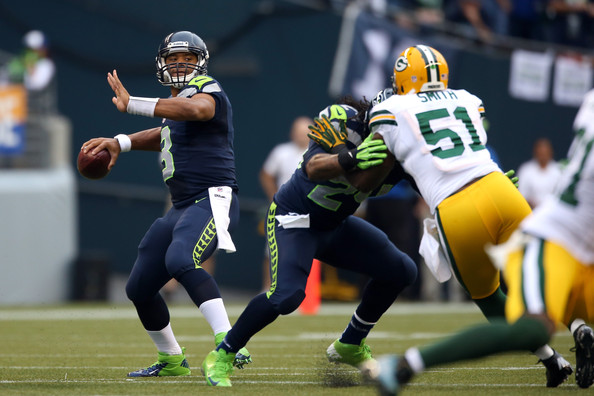
But this game had the added element of Russell Wilson looking like he had no idea what he was doing out there. With four minutes remaining, Wilson had one of the ugliest stat lines in playoff history: he was 8/22 for 75 yards with no touchdowns, four interceptions, and four sacks for 24 yards. He was averaging -4.96 Adjusted Net Yards per Attempt. It was worse than Ryan Lindley against Carolina, a performance that would rival Kerry Collins in the Super Bowl against the Ravens for worst playoff passing performance ever.
Wilson’s stat line was straight out of a 1976 boxscore featuring a rookie quarterback against the Steelers. Yet, somehow, minutes later, the game would be in overtime. Wilson ended regulation with a still miserable stat line of 11/26 for 129 yards, with 0 touchdowns (to be fair, he did run one in), 4 interceptions, and 4 sacks for -24 yards. That translates to an ANY/A average (which gives a 45-yard penalty for interceptions, and a 20-yard bonus for touchdowns, while penalizing for sacks) of -2.50.
If the Seahawks returned the overtime kickoff for a touchdown, the game would have easily gone down as the worst performance by a playoff-winning quarterback in history. But in overtime, Wilson did his best work: first, he found Doug Baldwin for ten yards. Then, after taking a one-yard sack, he hit Baldwin on 3rd-and-7 for 35 yards. The next play, Wilson hit Jermaine Kearse for a 35-yard touchdown, and Seattle was headed back to the Super Bowl.
Wilson finished 14/29 for 209 yards, with 1 touchdown, 4 interceptions, and five sacks for -25 yards. That translates to an anemic ANY/A average of +0.71. How does that compare historically? I thought it would be worthwhile to compare the ANY/A average of every winning quarterback in a playoff game to the league average ANY/A that season. So, in 2014, the NFL averaged 6.13 Adjusted Net Yards per Attempt per pass. This means Wilson finished 5.42 ANY/A below average. And given that Wilson had 34 dropbacks, it means that Wilson produced -184 Adjusted Net Yards over average. As it turns out, that’s only the … third worst ever by a winning quarterback.
The table below shows Wilson’s NFC Championship Game performance, along with the 49 worst passing games by a quarterback who won a postseason game prior to 2014. [1]In other words, the 50 worst ever, but excluding any other games from 2014, of which I don’t think any would qualify, anyway.
| Rk | Quarterback | Tm | Year | Opp | Boxscore | Rd | Cmp/Att: Pyd TD/INT: Sk-Skyd | any/a | lgavg | VALUE |
|---|---|---|---|---|---|---|---|---|---|---|
| 1 | George Blanda | HOU | 1961 | SDG | Boxscore | C | 18/40: 160 1/5: 0-0 | -1.13 | 3.85 | -199 |
| 2 | David Woodley | MIA | 1982 | NYJ | Boxscore | C | 9/21: 87 0/3: 4-27 | -3 | 4.76 | -194 |
| 3 | Russell Wilson | SEA | 2014 | GNB | Boxscore | C | 14/29: 209 1/4: 5-25 | 0.71 | 6.13 | -184 |
| 4 | Ron Jaworski | PHI | 1980 | DAL | Boxscore | C | 9/29: 91 0/2: 2-14 | -0.42 | 4.87 | -164 |
| 5 | Tommy Thompson | PHI | 1948 | CRD | Boxscore | C | 2/12: 7 0/2: 0-0 | -6.92 | 4.61 | -138 |
| 6 | Steve McNair | TEN | 1999 | BUF | Boxscore | W | 13/24: 76 0/1: 3-21 | 0.37 | 5.18 | -130 |
| 7 | Jay Fiedler | MIA | 2000 | IND | Boxscore | W | 19/34: 185 1/3: 2-9 | 1.69 | 5.21 | -126 |
| 8 | Jim Kelly | BUF | 1991 | DEN | Boxscore | C | 13/25: 117 0/2: 1-8 | 0.73 | 5.18 | -116 |
| 9 | Jim Plunkett | OAK | 1980 | CLE | Boxscore | D | 14/30: 149 0/2: 2-17 | 1.31 | 4.87 | -114 |
| 10 | Boomer Esiason | CIN | 1988 | BUF | Boxscore | C | 11/20: 94 1/2: 3-20 | 0.17 | 5.02 | -111 |
| 11 | Dieter Brock | RAM | 1985 | DAL | Boxscore | D | 6/22: 50 0/1: 1-3 | 0.09 | 4.86 | -110 |
| 12 | Mark Brunell | WAS | 2005 | TAM | Boxscore | W | 7/15: 41 0/1: 2-15 | -1.13 | 5.34 | -109 |
| 13 | Bobby Layne | DET | 1952 | RAM | Boxscore | D | 9/21: 144 0/4: 1-5 | -1.85 | 3.12 | -109 |
| 14 | Tom Brady | NWE | 2006 | SDG | Boxscore | D | 27/51: 280 2/3: 2-4 | 3.42 | 5.38 | -104 |
| 15 | David Garrard | JAX | 2007 | PIT | Boxscore | W | 9/21: 140 1/2: 4-36 | 1.36 | 5.52 | -104 |
| 16 | Pat Haden | RAM | 1976 | DAL | Boxscore | D | 10/21: 152 0/3: 3-22 | -0.21 | 4.07 | -103 |
| 17 | Paul Christman | CRD | 1947 | PHI | Boxscore | C | 3/14: 54 0/2: 0-0 | -2.57 | 4.74 | -102 |
| 18 | Craig Morton | DAL | 1970 | DET | Boxscore | D | 4/18: 38 0/1: 1-16 | -1.21 | 4.16 | -102 |
| 19 | Peyton Manning | IND | 2006 | BAL | Boxscore | D | 15/30: 170 0/2: 1-9 | 2.29 | 5.38 | -96 |
| 20 | Ben Roethlisberger | PIT | 2005 | SEA | Boxscore | S | 9/21: 123 0/2: 1-8 | 1.16 | 5.34 | -92 |
| 21 | Craig Morton | DAL | 1972 | SFO | Boxscore | D | 8/21: 96 1/2: 3-17 | 0.39 | 4.28 | -92 |
| 22 | Don Heinrich | NYG | 1958 | CLE | Boxscore | D | 1/7: 31 0/2: 0-0 | -8.43 | 4.54 | -91 |
| 23 | Tom Brady | NWE | 2007 | SDG | Boxscore | C | 22/33: 209 2/3: 2-11 | 2.94 | 5.52 | -90 |
| 24 | Joe Ferguson | BUF | 1981 | NYJ | Boxscore | W | 17/34: 268 2/4: 2-38 | 2.5 | 5 | -90 |
| 25 | Ben Roethlisberger | PIT | 2010 | NYJ | Boxscore | C | 10/19: 133 0/2: 2-12 | 1.48 | 5.73 | -89 |
| 26 | Frankie Albert | SFO | 1949 | NYY | Boxscore | D | 8/17: 96 1/2: 2-22 | 0.21 | 4.87 | -89 |
| 27 | Ron Jaworski | PHI | 1980 | MIN | Boxscore | D | 17/38: 190 1/2: 2-11 | 2.73 | 4.87 | -86 |
| 28 | Philip Rivers | SDG | 2008 | IND | Boxscore | W | 20/36: 217 0/1: 4-27 | 3.63 | 5.7 | -83 |
| 29 | Kordell Stewart | PIT | 1997 | NWE | Boxscore | D | 14/31: 134 0/1: 2-0 | 2.7 | 5.16 | -81 |
| 30 | Donovan McNabb | PHI | 2008 | NYG | Boxscore | D | 22/40: 217 1/2: 0-0 | 3.68 | 5.7 | -81 |
| 31 | George Blanda | OAK | 1969 | HOU | Boxscore | D | 1/5: 33 0/2: 0-2 | -11.21 | 4.23 | -81 |
| 32 | Jim Harbaugh | IND | 1995 | KAN | Boxscore | D | 12/27: 112 1/1: 2-10 | 2.66 | 5.41 | -80 |
| 33 | Kurt Warner | STL | 1999 | TAM | Boxscore | C | 26/43: 258 1/3: 0-0 | 3.33 | 5.18 | -80 |
| 34 | Terry Bradshaw | PIT | 1975 | BAL | Boxscore | D | 8/13: 103 0/2: 3-27 | -0.88 | 4.04 | -79 |
| 35 | Arnie Herber | GNB | 1939 | NYG | Boxscore | C | 5/8: 62 1/3: 0-0 | -6.63 | 3.01 | -77 |
| 36 | Steve McNair | TEN | 2003 | BAL | Boxscore | W | 14/23: 159 1/3: 0-0 | 1.91 | 5.2 | -76 |
| 37 | Tom Brady | NWE | 2011 | BAL | Boxscore | C | 22/36: 239 0/2: 1-5 | 3.89 | 5.9 | -74 |
| 38 | Ben Roethlisberger | PIT | 2004 | NYJ | Boxscore | D | 17/30: 181 1/2: 1-10 | 3.26 | 5.63 | -74 |
| 39 | Eli Manning | NYG | 2011 | SFO | Boxscore | C | 32/58: 316 2/0: 6-49 | 4.8 | 5.9 | -71 |
| 40 | Brad Johnson | WAS | 1999 | DET | Boxscore | W | 15/31: 174 1/2: 1-8 | 3 | 5.18 | -70 |
| 41 | James Harris | RAM | 1974 | WAS | Boxscore | D | 8/24: 95 1/2: 0-0 | 1.04 | 3.91 | -69 |
| 42 | Mark Sanchez | NYJ | 2009 | SDG | Boxscore | D | 12/23: 100 1/1: 1-7 | 2.83 | 5.65 | -68 |
| 43 | Joe Flacco | BAL | 2009 | NWE | Boxscore | W | 4/10: 34 0/1: 0-0 | -1.1 | 5.65 | -67 |
| 44 | Bubby Brister | PIT | 1989 | HOU | Boxscore | W | 15/33: 127 0/0: 1-15 | 3.29 | 5.24 | -66 |
| 45 | Irv Comp | GNB | 1944 | NYG | Boxscore | C | 3/10: 73 1/3: 0-0 | -4.2 | 2.24 | -64 |
| 46 | Brett Favre | GNB | 1997 | TAM | Boxscore | D | 15/28: 190 1/2: 4-19 | 3.16 | 5.16 | -64 |
| 47 | Drew Bledsoe | NWE | 1996 | JAX | Boxscore | C | 20/33: 178 0/1: 2-17 | 3.31 | 5.14 | -64 |
| 48 | Fran Tarkenton | MIN | 1976 | RAM | Boxscore | C | 12/27: 143 0/1: 4-34 | 2.06 | 4.07 | -62 |
| 49 | Peyton Manning | IND | 2006 | KAN | Boxscore | W | 30/38: 268 1/3: 1-5 | 3.8 | 5.38 | -62 |
| 50 | Shaun King | TAM | 1999 | WAS | Boxscore | D | 15/32: 157 1/1: 2-15 | 3.44 | 5.18 | -59 |
The worst game ever belongs to George Blanda, who capped off a marvelous 1961 season with a complete stinker in one of the hardest-hitting games in AFL history. As bad as Blanda was that day, Jack Kemp was hardly any better, finishing with -3 Adjusted Net Yards on 38 dropbacks.
A similar story could be told about the second worst game on the list: David Woodley’s horrible game was easily the better of the two quarterback performances that day. Playing on a muddy field, Jets quarterback Richard Todd completed just 15 passes on 41 dropbacks and was intercepted five times in a game that became known as the Mud Bowl.
Aaron Rodgers was not great on Sunday – yet another feather in the cap of the Seahawks pass defense — but he wasn’t exactly Kemp or Todd. Given the era of 1961 and the field conditions in 1982, you certainly won’t get any arguments from me if you say that Wilson’s performance was the worst in the playoffs by a winning quarterback in football history.
References
| ↑1 | In other words, the 50 worst ever, but excluding any other games from 2014, of which I don’t think any would qualify, anyway. |
|---|