≡ Menu

Overtime in the Playoffs From 2011 Through 2021

The 2009 NFC Championship Game was a classic game featuring two future Hall of Fame quarterbacks in Brett Favre and Drew Brees. The Vikings battled the Saints in the Superdome to a 28-28 tie after four quarters. New Orleans won the coin toss, giving Brees and the offense the ball first. The Saints appeared to go three-and-out, but an incomplete pass on third down was negated by a defensive holding penalty. The Saints got to the Vikings 41-yard line, and a pass interference penalty gave them another 12 yards. A couple of minutes later, and Garrett Hartley hit a 40-yard field goal to send New Orleans to the Super Bowl.

It was an anticlimactic ending to a great game. After battling for four quarters, the Saints — aided by a pair of penalties — drove 39 yards in 10 plays to set up a chip shot field goal and won the game. The coin toss was too significant a factor in the game, critics felt, especially as kickers were becoming automatic at longer and longer distances.

So beginning in 2011, the NFL changed the rules: the team that wins the coin toss can’t win the game on a field goal. It must score a touchdown, or else the other team would get the ball, too. That would make the flip of the coin a bit less valuable, or so we were told.

Since then, there have been 11 overtime games played during the NFL playoffs. The team that won the coin toss has won 10 of those games. Let’s walk down memory lane: [continue reading…]

{ 2 comments }

Resting Starters

Adam Steele is back again, this time with a look at teams resting their starters over the years. Bless him.


Over the past few years I’ve been documenting the historical instances of teams resting their starters in late season games. I like to remove such games when comparing teams since even a single upside down result can warp a club’s statistical profile (especially since these meaningless games disproportionately affect the best teams in a given season). Now that the 2021 regular season is complete, I figured I might as well share this database with FP readers in hopes that some of you might find it useful or interesting. [continue reading…]

{ 0 comments }

2020 Is A Very Offensive-Powered Final Four Ever

Two years ago, I wrote that 2018 gave us The Most Offensive-Powered Final Four Ever. Well, Tom Brady and Patrick Mahomes are back, this time joined by the Packers and Aaron Rodgers and the Bills and Josh Allen (as opposed to the Saints and Drew Brees and the Rams and Sean McVaybot in ’18). In 2018, the top four teams in scoring made it to the final four: it doesn’t get any more clear cut than that.

This year, the top three scoring teams — Green Bay, Buffalo, and Tampa Bay, in order — are in the final four. They are joined by the Chiefs, who ranked 3rd in the AFC (behind Tennessee) and 6th in the NFL in scoring (also behind New Orleans). Saying that Kansas City has the worst offense of any playoff team left is a bit like saying that Batman is the superhero with the weakest powers; you may have a bunch of evidence, but nobody is going to take your claim very seriously. It is also worthwhile to point that that the Chiefs ranked 2nd in the NFL in scoring after 16 weeks, before benching Patrick Mahomes and several other starters in a meaningless week 17 game and falling to 6th in the rankings.

And while this year may not have the final four according to the ranks, it is certainly up there as one of the highest-powered final fours of all time. In 2020, NFL teams averaged 24.8 points per game; the Packers led the league by averaging 31.8 points per game, or 7.0 points per game better than average. There have been 204 teams to make it to the conference championship game since 1970, and I calculated how many points per game each team scored relative to league average in each season. I also did the same for points allowed. The graph below shows all 204 teams, with their points scored per game relative to league average on the X-Axis, and the points allowed metric on the Y-Axis. In other words:

Top right = good offense, good defense
Top left = bad offense, good defense
Bottom left = bad offense, bad defense
Bottom right = good offense, bad defense

As you would expect, most of the teams that make it to the conference championship game fall in the upper right quadrant. I have color-coded the 2020 teams in the graph below. [continue reading…]

{ 0 comments }

NFL Playoff Seedings – A Monte Carlo Simulation

Let’s look at each round of the NFL playoffs,

Wild Card Round

There are two games played here in each conference: the 6 seed travels to on the road to face the 3 seed, and the 5 seed visits the 4 seed. The 1 and 2 seeds have byes.

My assumptions throughout this post are (1) home field advantage matters, and (2) the stronger seed is the better team, with the exception of 4 vs. 5. With 4-team divisions, the best team to not win its division — that is, often, the 2nd best team in the division with a very good division winner — is more often than not a better team than the worst division winner.

Still, home field advantage matters. So I am assuming that the 3 seed has a 60% chance of winning its game, while the 4 seed has a 55% chance of winning its game (this is lower than the general rule that the home team wins about 57% of games).

This means, after the wild card round, there’s a 100% chance that the 1 seed remains, a 100% chance that the 2 seed remains, a 60% chance that the 3 seed remains, a 55% chance that the 4 seed remains, a 45% chance that the 5 seed remains, and a 40% chance that the 6 seed remains. If you want to change these percentages, that’s very easy; more on that at the end of this post.

Division Round

Who will the 1 and 2 seeds face in the Division Round? The 1 seed has a 33% chance of facing the 4 seed, a 27% chance of facing the 5 seed, and a 40% chance of facing the 6 seed. This is because the 1 seed always plays the 6 seed when the 6 seed wins in the Wild Card round (40% chance), and faces the 4/5 winner 60% of the time. The 2 seed has a 60% chance of facing the 3 seed (when the 3 seed beats the 6 seed), a 22% chance of facing the 4 seed, and an 18% chance of facing the 5 seed.

So what will happen in the Division round?  Again, we need to come up with some probability; I took a stab at that below.  If you don’t like them, you can change them letter!
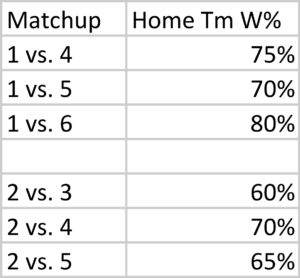
These seem reasonable to me; maybe you want to give the home team a bigger edge, but they’re close enough (and simple!) for our purposes.  So how likely is each seed to make the conference championship game using these numbers?

The 1 seed can make it by beating the 6 seed (40% chance that game happens, 80% chance of winning, therefore a 32% chance the 1 seed makes the Conference Championship Game by beating the 6 seed), the 5 seed (27%, 70%, 19%) or the 4 seed (33%, 75%, 25%): therefore, the 1 seed has a 76% chance of getting to host the title game.

The 2 seed can make it by beating the 5 seed (18% chance, 65% conditional win probability, 12% chance the 2 seed makes it by beating the 5 seed), the 4 seed (22%, 70%, 15%), or the 3 seed (60%, 60%, 36%), for a 63% chance.

You can do this calculation for all the seeds.  The 6 seed, for example, only has an 8% chance (40% chance in the Wild Card round, 20% chance in the Divisional Round) of getting to the CCG.  The 3 seed has a 24% chance, while the 4 and 5 seeds each have around a 14-15% chance.

In fact, the 5 seed has a slightly better chance of making it to the CCG than the 4 seed, because of the assumption that it is the better team.  This is offset, of course, by being on the road in the Wild Card round.

Conference Championship Game

With 6 teams in the playoff field, there are 30 possible combinations (6 x 5) for the conference champinoship game.  Of course, only half of those truly exist because home field automatically goes to the better seed.  And 4 of those 15 combinations are impossible — 1 can’t play 6 and 2 can’t play 3, since it would automatically play in the Division Round, while 3/6 and 4/5 can’t meat in the CCG since they meet in the Wild Card round.  The table below shows the chance of each combination happening, along with my projection of the likelihood that the home team wins.
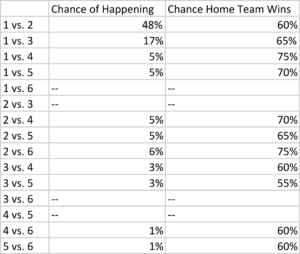
Again, if you disagree with any of these results, you will be able to change them! Just keep reading.

Conference Champion

If you perform all of the calculations using the assumptions in this post, you’ll see that there’s a roughly 48% chance the 1 seed wins the conference, a ~30% chance the 2 seed makes it to the Super Bowl, and the percentages drop to ~10%, 4-5%, 5-6%, and 2-3% for the 3, 4, 5, and 6 seeds.

Monte Carlo Simulation

One way to re-create the above is by performing a Monte Carlo simulationYou can download the Excel file that I created here. This file simulates 32,000 NFL postseasons with random results, weighted based on the percentage chance the home team has of winning each game.

Here’s how to read/use this sheet. On the Wild Card sheet, the pre-game win probabilities are in cells V11 and V12, which are highlighted in yellow. Let’s say you think the 5 seed in a given season is really good and/or the 4 seed is really weak; in that case, let’s change the home team win probability from 55% to 40%. Well, this still only shifts the Conference Championship odds (in Column S on the “ccg” sheet) a little bit; the 5 seed jumps from just over 5% to just over 7%, while the 4 seed drops to about 3.5%.

Let’s go to the “div” sheet. Let’s say you think the 1 seed is really strong, and should have a 90% chance of winning no matter its opponent in the Division Round. Even still, this only jumps its odds of winning the conference to about 57%.

What do you think?

{ 0 comments }

In Super Bowl II, Green Bay quarterback Bart Starr completed 13 of 24 passes for 202 yards, with 1 TD and no interceptions. He also took three sacks for 30 yards, and his backup was sacked once for 10 yards.

That means on 28 dropbacks, the Green Bay passing attack picked up 162 yards and produced 1 TD and 0 INTs, which translates to 142 Adjusted Net Yards. That’s an Adjusted Net Yards per Attempt average of 6.50 in Super Bowl II for Green Bay.

So was that a good performance by Starr and the Packers passing attack? No.

It was a great one. Passing efficiency was a lot different in 1967 than it is today, and the Raiders had a great pass defense. In 1966, Oakland allowed 3.14 ANY/A to opposing passers, the 3rd-best in the AFL; in 1967, that number dropped to just 2.23, the best in the AFL and third in all of pro football. And in 1968, opposing QBs averaged just 2.81 ANY/A against the Raiders. (And in 1969, it was just 2.64.)

The graph below shows every game for the Raiders defense from 1966 to 1968, in chronological order. Joe Namath consistently gave the Raiders problems, including in the famous Heidi Game in 1968. But otherwise, the Raiders pass defense tended to overwhelm most quarterbacks. On the X-Axis, we have games played in order. The Y-Axis shows the ANY/A allowed by the Raiders, shown from -6 to 14 (since the league average ANY/A was around 4.0). [continue reading…]

{ 0 comments }

The 1981 San Diego Chargers led the NFL in points and yards, but ranked 26th in points allowed and 27th in yards allowed in a 28-team NFL. The Chargers made it to the AFC Championship Game, but had the poor fortune of playing in Cincinnati in a game with -32 degree wind chill. The game wound up being known as the Freezer Bowl, and the Chargers lost 27-7. San Diego might have been better off playing in 2018.

The table below shows where each of the final four teams rank in points, yards, points allowed, and yards allowed, along with each team’s average rank of the two offensive categories and average rank of the two defensive categories. The final column shows the difference between the team’s offensive and defensive ranks, as a way of describing whether a team is offensive-powered or defensive-powered.

YearTeamPF RkYd RkPA RkYA RkAvg Off RkAvg Def RkOff Heavy
2018NOR3814145.5148.5
2018NWE457214.5149.5
2018LAR222019219.517.5
2018KAN112431127.526.5

Let’s use the Saints as an example. New Orleans ranks 3rd in points for and 8th in yards, while ranking 14th in points allowed and 14th in yards allowed. Therefore, New Orleans has an average offensive rank (3, 8) of 5.5, and an average defensive rank of 14 (14,14). The Saints are considered offensive heavy to the tune of 8.5 slots (14 minus 5.5). And that makes the Saints the least offensive-heavy team remaining in the final four.

The graph below shows the average offensive rank (taking the average of each team’s rank in points and yards) and defensive rank for each of the final four teams in each season since the merger. As you can see, this is a heavily-slanted year for offense: [continue reading…]

{ 1 comment }

The Saints crushed the Eagles in New Orleans during the regular season

In week 11 this season, the Eagles traveled to New Orleans and were obliterated, 48-7. The loss dropped Philadelphia to 4-6, nearly ending their playoff hopes. But behind Nick Foles, the Eagles miraculously made the postseason — after the Saints loss, Philadelphia’s odds of winning a Wild Card berth dropped to just 2% — and won a Wild Card matchup against the Bears. That brings the Eagles back to the Superdome, with a chance for revenge against the Saints.

The Eagles are 8-point underdogs, and the ugly regular season performance is just one of the reasons why. But it’s hard not to draw comparisons to another team in green that once avenged a regular season embarrassment. Eight seasons ago, the Jets traveled to Foxboro for a Monday Night game with a potential division title hanging in the balance. Both teams were 9-2, and New York had defeated New England at home earlier in the year. But that night, the Patriots blew out the Jets 45-3, in a game that showed just how far the Jets still had to go to measure up to the league’s best teams.

Except, it hadn’t. Because 41 days later, in a rematch in Foxboro in the division round of the playoffs, the Jets shocked the Patriots, winning 28-21 as 9.5-point underdogs.

As it turns out, that’s the largest margin ever avenged in the playoffs in a rematch at the same site. The table below shows all postseason games featuring:

1) A rematch of a regular season game in the same location;

2) In the regular season, the winning team won by at least 14 points;

3) In the playoffs, the winning team lost the regular season game.

WonLostYearRS MargRS WkRS BoxscoreLocLineRdP Boxscore
NYJNWE2010-421345-3Road9.5D28-21
MINRAM1977-32635-3RoadD14-7
DENHOU1987-30440-10Home-10D34-10
KANHOU1993-30230-0Road7D28-20
ARIDAL1998-28138-10Road7W20-7
PITHOU1989-27727-0Road7W26-23
ARIGNB2009-261733-7Home2.5W51-45
GNBNYG1944-241024-0RoadC14-7
RAMDAL1979-24730-6Road8.5D21-19
NYGRAM1984-21533-12Road4.5W16-13
BUFBCL1948-201535-15RoadD28-17
BALPIT2014-20943-23Road3W30-17
BUFNYJ1981-19733-14Road3W31-27
PITIND2005-191226-7Road8.5D21-18
TAMDET1997-18727-9Home-3W20-10
RAMCLE1951-15238-23HomeC24-17
RAMTAM1979-15421-6Road-3.5C9-0
CHINYG1946-14614-0RoadC24-14
WASDAL1982-141324-10Home2C31-17
WASPHI1990-141028-14Road4.5W20-6
SDGKAN1992-14124-10Home-3W17-0
INDDEN2003-141631-17Home-3W41-10
NWEPIT2004-14834-20Road-3C41-27
INDNYJ2009-141629-15Home-8.5C30-17
{ 0 comments }

The Kansas City Chiefs led the NFL in scoring in 2018, and fielded the third highest scoring team in NFL history. But that doesn’t always lead to playoff success. Since 2000, just one team that led the NFL in scoring has won the Super Bowl.

The table below shows all teams to lead the NFL (or combined AFL/NFL) in the Super Bowl era, and how those teams fared in the playoffs. [continue reading…]

{ 0 comments }

Through 14 games this season, Alabama outscored its opponents by 31.5 points per game. Last night, in the most shocking national championship game I can remember, Clemson dominated Alabama in historic fashion. The Tigers beat Alabama 44-16, a 28-point margin of victory against a Nick Saban Alabama team that in 12 seasons had never lost a game by more than 14 points.

No team in NFL history has outscored opponents by 20 points per game and then lost a playoff game by 20+ points. The closest comparisons:

  • The 1967 Raiders outscored opponents by 16.8 points per game. Oakland defeated Houston 40-7, to up its average points differential per game to 17.9 through 15 games. Then, in the Super Bowl against the Packers, Oakland lost by 19 points, 33-14.
  • The 1969 Vikings outscored opponents by 17.6 points per game.  After a couple of close playoff wins, Minnesota lost Super Bowl IV by 16 points, 23-7.

In more recent times: the 2012 Patriots outscored opponents by 14.1 points and lost in the playoffs by 15 points, the 2013 Broncos outscored opponents by 12.9 points and lost by 35 points, and the 2011 Packers outscored opponents by 12.6 points and lost by 17 points.

My first reaction was to think of the 1983 Redskins: that year, Washington outscored opponents by 13.1 points and lost by 29 points.

What I wanted to do was plot team points differential in the regular season against each team’s worst playoff loss.  I plotted regular season points differential on the X-Axis and worst playoff margin on the Y-Axis; then I realized we just want to focus on the bottom right quadrant of that graph (positive regular season points differential, negative playoff margin).  So here is that bottom right quadrant of the graph: [continue reading…]

{ 0 comments }

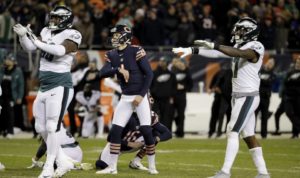
Cody Parkey watches the Bears season flash before his eyes.

In a regular season game against the Lions, Bears field goal kicker Cody Parkey missed 2 field goals and 2 extra points that was notable because all 4 misses hit the uprights. Last night, Parkey’s leg somehow vaulted another ball into the uprights (with a tip to Treyvon Hester, literally) in a much more painful situation.  The #3 seed Bears, at home against the Eagles, trailed 16-15 with 10 seconds remaining when Parkey lined up for a 43-yard field goal.  After Parkey’s kick hit the left upright, then bounced on the crossbar, and then landed in the field of play, the Bears magical season was over.

Parkey is not alone. Below are the most heartbreaking, last-second missed field goals in the postseason since 1990 — also known as since Norwood, which remains by a large margin the most heartbreaking miss in postseason history. To qualify, a kick must have been in overtime or in the final seconds of regulation, and the kicking team had to lose the game.

#10) Mike Vanderjagt (Colts) against the Dolphins (2000-12-30)

The Colts led 14-0 in the Wild Card round against the Dolphins before allowing Miami to send the game to overtime at 17 apiece. After a defensive stop, Indianapolis drove 51 yards to set up a game-winning field goal attempt from Vanderjagt, who had made 25 of 27 attempts during the regular season. But his 50-yard attempt was no good, the Dolphins drove down the field for the winning score. Two years later, Vanderjagt blamed his Colts teammates and coaches for the team’s lack of playoff success, and three years after that, Vanderjagt would strike again.

#9) No Field Goal Attempt (Giants) against the 49ers (2003-01-05)

You read that correctly: this one was so painful in part because Matt Bryant never even had a chance. The Giants blew a 38-14 lead to the 49ers, as San Francisco came all the way back to take a 39-38 lead with one minute to go. New York drove down the field and got to the 49ers 23-yard line with just six seconds remaining. There, disaster struck: Trey Junkin, signed by the Giants just days earlier, botched the snap, and the Giants never had a chance to kick the game-winning field goal. [continue reading…]

{ 1 comment }

The 2018 season was the greatest offensive season in NFL history. Teams averaged a whopping 23.3 points per game, which technically ranks second behind the 2013 season (23.4). But there is no doubt that the 2018 season was the better offensive season:

In 2018, teams scored 1,286 offensive touchdowns; in 2013, teams scored 1,214 offensive touchdowns.

Field goal kickers were better 5 years ago; teams hit 863 field goals in 2013, and just 802 this season. And don’t forget about the effect of the rules changes on extra points: teams connected on 99.6% of extra points that year, compared to just 94.3% this year while kicking from much farther away. Had kickers had the same rate on extra points in 2018 as they did in 2013, the NFL would have seen 66 more points; meanwhile, teams scored just 33 more points in 2013 compared to 2018.

Teams also scored 20 special teams return touchdowns in 2013, compared to just 13 this year. In addition, teams scored a whopping 26 more touchdowns on defense (95 in 2013, 69 in 2018), and 9 other return touchdowns came in 2013, versus 4 other return touchdowns this year.

So yes, 2018 was the greatest offensive season in history, and it wasn’t particularly close. But that didn’t translate to the Wild Card round of the playoffs, where teams averaged just 18.1 points per game across four games. That’s pretty low by Wild Card round standards: take a look. [continue reading…]

{ 8 comments }

Post Your 2018 Playoff Predictions

Post your playoff predictions in the comments. Here are mine:

Wild Card Round

(3) Houston over (6) Indianapolis
(4) Dallas over (5) Seattle
(5) Chargers over (4) Baltimore
(3) Chicago over (6) Philadelphia

Divisional Round

(1) New Orleans over (5) Dallas
(2) Rams over (3) Chicago
(5) Chargers over (1) Kansas City
(2) New England over (3) Houston

Conference Championships

(2) New England over (5) Chargers
(1) New Orleans over (2) Rams

Super Bowl

(2) New England over (1) New Orleans

{ 0 comments }

Kansas City will likely defeat the Raiders on Sunday, capping an impressive 12-4 regular season. Those four losses, however, all came against playoff teams: in New England, in Seattle, in Los Angeles against the Rams, and at home against the Chargers. Meanwhile, Kansas City will have beaten just two playoff teams: the Chargers, and whoever winds up winning the AFC North (the Chiefs went 4-0 against the AFC North, beating Pittsburgh in week 2 and Baltimore in week 14).

Does this mean the Chiefs are less likely to succeed in the playoffs than if, say, they had gone 6-0 against playoff teams and 6-4 against non-playoff teams?

In 2005, the Steelers went 2-4 against playoff teams during the regular season, but went 4-0 in the postseason (with three wins on the road) to win Super Bowl XL.

Meanwhile, the 2011 Ravens did exactly what my hypothetical 2018 Chiefs did: that year, Baltimore went 6-0 against playoff teams and just 6-4 against non-playoff teams. The Ravens defeated the Texans in the Wild Card round before falling to the Patriots in the Division round.

A number of Super Bowl champions performed poorly against playoff teams during the regular season: the 1999 Rams went 0-2, the 2007 Giants went 1-5, the 1980 Raiders went 1-4, the 2011 Giants went 1-3, and the 2005 Steelers and 2012 Ravens both went 2-4. The 2008 Steelers are a Super Bowl champion that had a losing record (3-4) against playoff teams, but went undefeated (9-0) against non-playoff teams.

Where do the Chiefs line up historically? Kansas City is 10 wins above .500 against playoff teams, and 2 wins below .500 against non-playoff teams. Add those numbers together, and the Chiefs get a score of +12. There are 60 teams in the Super Bowl era who finished +12 or higher. The most extreme case belongs to the 2011 Bengals, who went 9-0 against non-playoff teams (+9) and 0-7 against playoffs teams (-7), for a total score of 16 (9 minus -7). The full list, below:

TeamyearReg Sea W%Record vs. PTRecord vs. NonPTPlayoff RecordDiff
CIN20110.5630-79-00-116
JAX19990.8750-214-01-116
ATL20050.5000-78-1Miss14
KAN20130.6881-510-00-114
PHI20090.6880-411-10-114
SDG19920.6880-411-11-114
SDG20040.7501-411-00-114
SFO19960.7501-411-01-114
STL19990.8130-213-13-014
MIA19721.0000-014-03-014
DAL19690.8210-211-0-10-113
SDG19680.6431-58-0Miss12
OAK19700.6430-48-0-21-112
HOU20040.4380-77-2Miss12
NOR19940.4380-77-2Miss12
KAN19790.4380-77-2Miss12
CIN19760.7141-49-0Miss12
HOU19750.7141-49-0Miss12
MIA19910.5001-77-1Miss12
ATL19920.3750-86-2Miss12
CHI20120.6252-68-0Miss12
BAL20170.5630-59-2Miss12
DET20160.5630-59-20-112
BAL20090.5631-68-11-112
PIT19760.7140-310-11-112
MIA19750.7140-310-1Miss12
BAL20080.6882-59-02-112
MIA20010.6882-59-00-112
NWE19850.6882-59-03-112
RAI19840.6882-59-00-112
NYG20070.6251-59-14-012
IND20010.3751-95-1Miss12
NOR19980.3751-95-1Miss12
DET20110.6251-59-10-112
WAS19990.6251-59-11-112
NYG19880.6250-410-2Miss12
OAK19800.6881-410-14-012
DET20140.6881-410-10-112
MIN19920.6881-410-10-112
DEN19850.6881-410-1Miss12
KAN20180.7502-410-0??12
SFO20130.7502-410-02-112
PIT20100.7502-410-02-112
SFO19980.7502-410-01-112
NOR19920.7502-410-00-112
MIA19900.7502-410-01-112
NYG19890.7502-410-00-112
NYG19930.6880-311-21-112
CHI19900.6880-311-21-112
KAN19680.8571-211-00-112
OAK20160.7501-311-10-112
TEN20030.7501-311-11-112
WAS19860.7501-311-12-112
DEN20120.8132-311-00-112
NWE20110.8131-212-12-112
OAK19760.9291-112-03-012
SDG20060.8752-212-00-112
BAL19680.9291-112-02-112
CHI19860.8751-113-10-112

For Chiefs fans, the 2005 Steelers may be the most inspiring name on this list, but not the most memorable. The easy comparison is to Andy Reid’s first team in Kansas City in 2013: that Chiefs team went 10-0 against non-playoff teams but 1-5 against playoff teams and then lost its first playoff game. The big difference: that Kansas City team had to go on the road, while this Chiefs team should be home for the postseason.

{ 0 comments }

Parity Does Not Exist In The 2018 NFL

With three weeks left, the NFL playoff picture is nearly complete.  In the AFC, the Chiefs, Patriots, and Chargers are all going to make the postseason; in 2017, Kansas City and New England won their divisions, and the Chargers won 9 games.

The Steelers and Ravens are favorites to go to the postseason; Pittsburgh won the AFC North last year, and Baltimore won 9 games.  The AFC South will likely go to Houston, and that would be the only “surprise” in the AFC this year.  The Texans won just 4 games last year, although expectations were much higher this year with a healthy Deshaun Watson.  The Titans, who made the playoffs last year, are still technically in the hunt for the division title, which would make the AFC (lack of) turnover even more extreme.

Things aren’t much different in the NFC.  The Saints and Rams have already clinched their division titles for the second year in a row. The Seahawks and Cowboys, who each won 9 games last year, will likely be in the postseason this year.  The Bears are the Texans of the NFC, going from 5-11 to division champion with a first round quarterback from the 2017 Draft.  Nobody in the NFC wants the 6th spot, but the Vikings — who went 13-3 last year — are the current favorite.

Think about that: if the season ended today, then 10 of the 12 playoff teams in 2018 had a winning record in 2017. There is still time for the Dolphins or Colts to snag the 6 seed in the AFC from the AFC North runner up, but in the NFC, the Eagles and Panthers (who both won 11+ games last year) are on deck for the 6 seed if the Vikings falter.

How does that compare to prior years? Assuming 10 of the 12 2018 playoff teams — 83% — had a winning record in 2017, that would stand out as a pretty big outlier. It would mark a reversion to the 1980s, pre-salary cap and free agency era of the NFL, where parity didn’t play a central role. The graph below shows, for each year since 1970, the percentage of teams that made the postseason and had a winning record the prior year. [continue reading…]

{ 0 comments }

Championship Leverage, By Bryan Frye

Today’s post is a re-post from friend of the program Bryan Frye’s site, which is being republished with his permission and encouragement. As regular readers know, Bryan operates his own fantastic site, http://www.thegridfe.com. You can view all of Bryan’s guest posts here, and follow him on twitter @LaverneusDingle. What follows are Bryan’s words, with minor editing from Chase.


Over the years, I’ve given much thought to the value (Championship Leverage) of postseason games relative to regular season games. Sabermetrics guru Tom Tango invented the Leverage Index in 2008 to apply a value to the gravity of a given base-out-inning situation in baseball. Later, Neil Paine used the concept for basketball and, subsequently, football. I found his application of the concept to NFL quarterbacks to be particularly interesting, and I decided to go into more detail on Neil’s methodology and expand the findings back to 1936 (the first NFL season with a standardized schedule). [continue reading…]

{ 0 comments }

Postseason Rushing Leaders, By Year

Do you know who the leader in rushing yards in a single postseason?

Click Show for Answer Show


What about the rushing leader among players who played in only three postseason games?

Click Show for Answer Show


What about the rushing leader in the last 10 years in a postseason?

Click Show for Answer Show

[continue reading…]

{ 3 comments }

Nick Foles is no stranger to great games. He has the greatest passing game in Eagles history, recorded on November 3rd, 2013 against the Raiders. Foles completed 22 of 28 passes for 406 yards and 7 touchdowns, with just one sack for one yard and zero interceptions. That translates to a whopping 18.79 Adjusted Net Yards per Attempt.

We can adjust that result for both era and quality of defense: Oakland’s pass defense was bad that season, allowing 7.41 ANY/A to opposing passers, but even still, that means Foles still averaged well over 11 more ANY/A against the Raiders than the average passer that season. Over the course of his 29 dropbacks, Foles provided 330 ANY above expectation, easily the best game in Eagles history. In fact, it’s one of just eight games since 2002 with over 300 ANY over expectation, joining three Peyton Manning games (against the Broncos in both the ’03 and ’04 playoffs, and with the Broncos against the Ravens in the 2013 Kickoff Classic), two Ben Roethlisberger games (Packers 2009, Colts 2014), and performances by Drew Brees (Patriots, 2009) and Kurt Warner (Packers, 2009 playoffs).

But then, against the Vikings, Foles had another masterpiece. And what made this one particularly special was that it came against a really good Minnesota defense. During the regular season, the Vikings allowed just 4.57 ANY/A, second best in the NFL. But in the NFC Championship Game, Foles was 26 for 33 for 352 yards with 3 TDs and no interceptions, with one sack for six yards. That translates to 406 Adjusted Net Yards on 34 dropbacks, or 11.94 ANY/A. That is 7.37 ANY/A above what the average opposing QB produced against the Vikings during the regular season; over the course of 34 dropbacks, that translates to 250 Adjusted Net Yards of added value.
[continue reading…]

{ 27 comments }

The playoffs. Less than two minutes to go. You need a score to win, but you’re far away from the end zone. And then a miracle happens.

There have been just 8 touchdowns in NFL playoff history that meet the following four criteria:

  • The touchdown came in the final two minutes of regulation or at any point in overtime;
  • The touchdown was at least 50+ yards;
  • The touchdown tied or gave the team the lead;
  • The touchdown was scored by the winning team.

Here are those eight scores. [continue reading…]

{ 15 comments }

Drew Brees Loses Another Playoff Game Drew Brees Style

In his first playoff game, Drew Brees threw a game-tying touchdown pass to Antonio Gates with 11 seconds remaining to force overtime against the Jets. In overtime, Brees and the Chargers drove 48 yards down the field, and converted two third downs, to set up a game-winning 40-yard field goal. Unfortunately for Brees, Nate Kaeding missed the kick, and the Jets won in overtime.

In his second playoff game, Brees had an efficient performance in a win over the Eagles. The next week, New Orleans faced an excellent Bears team in frigid conditions in Chicago. Brees’ teammates lost two fumbles, rushed for a total of 48 yards, and allowed 37 points in an NFCCG loss.

Brees’ next three playoff games were all in 2009, when he threw 8 touchdowns and no interceptions as the Saints won the Super Bowl.

His next playoff game? That was the BeastQuake game when Marshawn Lynch rumbled for a 67-yard touchdown in the 4th quarter. The Saints lost 41-36, despite Brees throwing for 404 yards and 2 touchdowns with no interceptions.  This would not be the last time Brees would lose a game despite his team scoring over 30 points.

The next playoff game of his career was his best, at least statistically.  Even with era and defensive adjustments, it ranked as one of the 10 best passing games in postseason history: He threw for 466 yards and 3 TDs on 43 attempts in a 45-28 win over the Lions.

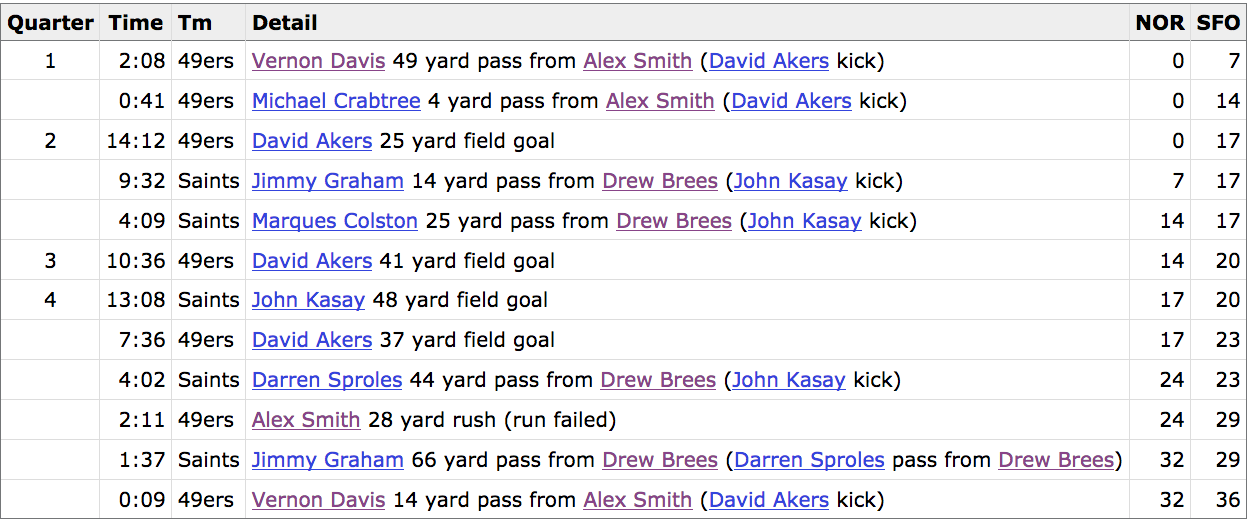
The next week Brees lost in one of the classic games in modern postseason history. Take a look at the boxscore:

This was the first game in playoff history with four lead changes in the final five minutes. Brees had a monster game against a great 49ers pass defense, and gave his team the lead in the final two minutes. Alas, that was not enough. This would not be the last time that would happen, either.

Two years later, Brees and the Saints won in Philadelphia as underdogs. This was, statistically, the worst playoff game of his postseason career. On the other hand, he and the Saints were a dome team playing a night game in Philadelphia in freezing conditions, and after a rough first half, the Saints scored two touchdowns and two field goals in five second half possessions. On the final drive, he picked up two first downs to set up the game-winning field goal.

The next week wasn’t good: he was 24/43 for 309 yards and 1 TD which oh wait it was against the 2013 Seahawks. In Seattle. So yeah, that was a pretty good game in a losing effort.

That brings us to 2017. In the first round of the playoffs, Brees went 23/33 for 376 yards and 1 TDs in a 31-26 win over Carolina. And then yesterday against the Vikings? After a miserable first half, Brees and the Saints scored three touchdowns on the team’s first four drives of the second half. The final touchdown put New Orleans ahead by 1 point with 2:20 to go.

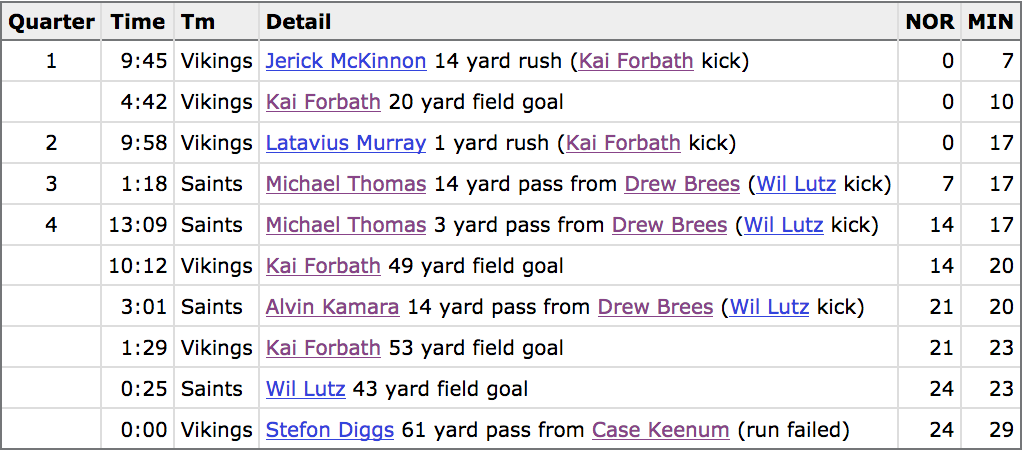
Minnesota answered with a 9-play, 40-yard drive that culminated with a 53-yard field goal. New Orleans got the ball back, down 2 with 89 seconds left and one timeout, and drove 50 yards for the field goal. The Saints took a 24-23 lead with 25 seconds remaining.

With 10 seconds remaining, the Vikings had the ball at their own 39 yard line with no timeouts left. And then this happened:

Well, this happened:

One of the greatest plays in playoff history. An instant classic. And yet, once again, Brees was left holding the short straw. Does this boxscore look familiar?

There have been two games in NFL postseason history with four lead changes [1]I am excluding ties, but if you include them, only one other game gets in there. in the final five minutes. And Brees was on the losing end in both of them.

As a reminder, in 13 playoff games:

  • The other team has scored 28+ points 6 times, and Brees is 2-4 in those games This includes the only two games in playoff history with four lead changes in the final five minutes and the BeastQuake game where the Saints scored 36 points.
  • Brees’ teams are 5-2 when the opponent scores under 28 points. The two losses include a game against one of the best pass defenses in NFL history and a game where his kicker missed a 40-yard field goal in overtime.
  • The average score of a Drew Brees playoff game is 28.8 to 26.8. While with the Saints, that jumps to 29.8 to 27.4.

In the last 10 postseasons, there have been 27 games with at least 56 points combined (i.e., an average of 28 points per team). Brees’s Saints have been involved in six of those 27 games. Keep in mind that there have been 214 playoff games over that stretch, and New Orleans has only been in 10 of them.

That means 60% of all Drew Brees playoff games see 56+ points scored, compared to 10% of all other games.

Brees is one of just four quarterbacks with a career passer rating in the playoffs over 100 and has averaged 324 passing yards per game in the playoffs, easily the most of all time. His stat line — 354/537, 4,209 yards, 29 TDs, 9 INTs, 100.7 passer rating, 22 sacks — looks like that of an MVP candidate, especially when you consider that’s in only 13 games. Pro-rated to 16 games, and it’s 5,180 yards with 36 TDs and 11 INTs on 661 attempts. Those are nearly identical to the numbers he put up in an MVP caliber 2013 season.

In other words, Drew Brees in the playoffs plays like the best version of Drew Brees in the regular season, which is pretty darn incredible. But what’s even more incredible is the string of events that have left him with just a 7-6 record. For that 7-6 record, he can thank Kaeding, Lynch, Vernon Davis, Stefon Diggs, and going up against two of the best defenses of the last 15 years.

References

References
1 I am excluding ties, but if you include them, only one other game gets in there.
{ 116 comments }

This duo took the NFC by storm in 2011.

We know that, in general, home teams are favorites in the postseason. But home teams are almost always the favorites in the division round, because those teams are coming off of a bye. In the wild card round, it’s not unusual to see road teams favored: that didn’t happen this year, but it’s easy to see why bad division winner can be an underdog against the best wild card team. It’s happened 20 times since 1990, and in 2015, three of the four home teams were underdogs in the wild card round, and the fourth was a one-point favorite. And all four home teams lost.

The conference championship game features, in theory, the two best teams in the conference; it’s not hard to understand that sometimes, the best team isn’t the #1 seed, and they can wind up being road favorites. It’s happened eight times since 1990, mostly recently two seasons ago. The Broncos were home underdogs to the Patriots in the 2015 AFCCG and won; New England was the better team on paper but lost a H2H tiebreaker for the 1 seed. The Falcons were home dogs in the 2012 AFCCG to the 49ers and lost; San Francisco was 4 points better in the SRS than Atlanta that year, but the Falcons won the 1 seed because they had a much easier schedule than the 49ers and outperformed their Pythagorean win total. The Packers might have been the best team in the NFC in 2010, but lost the NFC North by one game to the Bears; Green Bay won the Super Bowl and was a road favorite in the 2010 NFCCG in Chicago. In short, it happens.

But what rarely happens is seeing a top two seed coming off of a bye be a home dog. In fact, since the NFL expanded to 6 playoff teams per conference in 1990 and instituted byes for the top two seeds, it’s happened just three other times. [continue reading…]

{ 1 comment }

One of the best champions in Cleveland sports history.

The Cleveland Cavaliers and Golden State Warriors are facing off in the NBA Finals for the third straight season. That’s never happened before in NBA history, and it only happened once in pro football history… and it also involved Cleveland.

In 1952, the Browns won the American with an 8-4 record, while the Detroit Lions won the National division with a 9-3 record (after defeating the defending-champion Rams in the National tiebreaker game). Otto Graham and Bobby Layne were the two top quarterbacks in the NFL that year according to both the AP and the NY Daily News. Detroit traveled to Cleveland on December 28th and defeated the Browns 17-7, with Doak Walker’s 67-yard touchdown providing the biggest blow.

The next season, Graham had a season for the ages by any measure.  You’d be hard-pressed to argue for a better regular season by any quarterback from World War II to 1983, when a Graham-led Browns passing game finished with a Relative ANY/A of +5.00.  The Browns began the 12-game season with 11 straight wins, while Detroit finished 10-2 with both losses coming against the 8-3-1 Rams.  Cleveland lost the season finale in Philadelphia, and then traveled to Detroit for an NFL Championship rematch.

The Browns and Lions were tied 10-10 after three quarters, and Cleveland was up 16-10 late in the game.  But in the final minutes, Layne found an unlikely hero in Jim Doran for a 33-yard game-winning touchdown (video here), with Walker’s extra point providing the margin of victory. The bigger story? Graham having one of the chokiest games in football history, finishing with 2 of 15 for 20 yards with 2 interceptions. [continue reading…]

{ 15 comments }

2016 Postseason Game Scripts

With one massive exception, the 2016 playoffs were not very interesting. The home team usually won, the favorite usually won, and usually by a large margin. In 8 of 10 games (ignoring the neutral site Super Bowl), the home team was the favorite and won by 13+ points.

And the Game Scripts weren’t all that exciting, either. Most of the games weren’t Super Bowl, and there was just one comeback. Of course, it wasn’t just any comeback; it was perhaps the comeback. Take a look: [continue reading…]

{ 7 comments }

Thoughts on the 2016 NFL Playoffs

The cherry on top of a boring dessert

There were really only three notable games in this year’s playoffs. The Super Bowl, of course, was a classic game, if not necessarily a good one to watch from start to finish. The Patriots completed a historic comeback and won in overtime, 34-28.

And there were two upsets: the Packers went into Dallas and won, 34-31, in what was the best game of the playoffs. And the Steelers went into Kansas City and won in a sloppy game, 18-16, where Pittsburgh kicked six field goals.

The other 8 games? All were won by the favorites, and all were won by at least 13 points. That matched the number of times the favorite won by over 10 points in the three previous years combined.

Since 1990, the favorites have won 7.6 of 11 games, on average, in the postseason. With 9 wins by favorites in 2016, that matches the most times the favorite has won in the playoffs, but it happened six other times, too. So 2016 wasn’t all that notable in that regard.

And since 1990, teams have won by over 10 points in just over half of all playoff games. With 8 such wins, that is the most ever, but it happened four other times, too (although not since 2002). But what makes the 2016 playoffs stand out is the combination of the two factors: 8 times the favorite won and won by over 10 points, compared to just 4.4 times on average. The only other time that happened was in 1996. [1]And 8 of the 10 times, the home team won, which is high, but also not particularly unusual (the home team won 6.8 games on average).

The table below shows the average results (from the perspective of the winning team) in every playoff year since 1990: [continue reading…]

References

References
1 And 8 of the 10 times, the home team won, which is high, but also not particularly unusual (the home team won 6.8 games on average).
{ 1 comment }

In 22 team games in the 2016 playoffs, just four times did a rusher crack the 100-yard mark — or even exceed 75 rushing yards.  In the Patriots three wins, their leading rusher never cracked 50 yards, and James White was three yards away in the Super Bowl from giving New England three different leading rushers in three games.

Rushing
Rk Date Tm Opp Result G# Week Att Yds
Y/A TD
1 Le’Veon Bell 2017-01-15 PIT @ KAN W 18-16 18 19 30 170 5.67 0
2 Le’Veon Bell 2017-01-08 PIT MIA W 30-12 17 18 29 167 5.76 2
3 Thomas Rawls 2017-01-07 SEA DET W 26-6 17 18 27 161 5.96 1
4 Ezekiel Elliott 2017-01-15 DAL GNB L 31-34 17 19 22 125 5.68 0
5 Devonta Freeman 2017-02-05 ATL NWE L 28-34 19 21 11 75 6.82 1
6 Lamar Miller 2017-01-14 HOU @ NWE L 16-34 18 19 19 74 3.89 0
7 Lamar Miller 2017-01-07 HOU OAK W 27-14 17 18 31 73 2.35 1
8 Tevin Coleman 2017-01-14 ATL SEA W 36-20 17 19 11 57 5.18 0
9 Russell Wilson 2017-01-14 SEA @ ATL L 20-36 18 19 6 49 8.17 0
10 LeGarrette Blount 2017-01-22 NWE PIT W 36-17 18 20 16 47 2.94 1
11 Christine Michael 2017-01-08 GNB NYG W 38-13 17 18 10 47 4.70 0
12 Ty Montgomery 2017-01-15 GNB @ DAL W 34-31 18 19 11 47 4.27 2
13 Aaron Rodgers 2017-01-22 GNB @ ATL L 21-44 19 20 4 46 11.50 0
14 Devonta Freeman 2017-01-14 ATL SEA W 36-20 17 19 14 45 3.21 1
15 Devonta Freeman 2017-01-22 ATL GNB W 44-21 18 20 14 42 3.00 0
16 Dion Lewis 2017-01-14 NWE HOU W 34-16 17 19 13 41 3.15 1
17 Latavius Murray 2017-01-07 OAK @ HOU L 14-27 17 18 12 39 3.25 1
18 Spencer Ware 2017-01-15 KAN PIT L 16-18 17 19 8 35 4.38 1
19 Thomas Rawls 2017-01-14 SEA @ ATL L 20-36 18 19 11 34 3.09 0
20 DeAngelo Williams 2017-01-22 PIT @ NWE L 17-36 19 20 14 34 2.43 1
21 Zach Zenner 2017-01-07 DET @ SEA L 6-26 17 18 11 34 3.09 0
22 Jay Ajayi 2017-01-08 MIA @ PIT L 12-30 17 18 16 33 2.06 0
23 LeGarrette Blount 2017-01-14 NWE HOU W 34-16 17 19 8 31 3.88 0
24 LeGarrette Blount 2017-02-05 NWE @ ATL W 34-28 19 21 11 31 2.82 0
25 Jonathan Grimes 2017-01-07 HOU OAK W 27-14 17 18 4 30 7.50 0
26 Paul Perkins 2017-01-08 NYG @ GNB L 13-38 17 18 10 30 3.00 0

White’s Super Bowl heroics aside — you know, he scored a record 20 points and caught a record 14 passes — New England certainly didn’t get much production from the ground game in the playoffs. Even as a team, the Patriots averaged only 86.3 yards per game in the postseason. Among the 51 Super Bowl champions, that slots in just between two other Patriots teams, giving New England three of the four Super Bowl champions that failed to crack the 90 rushing yards mark in the playoffs. But one team averaged just 37 rushing yards per game in the postseason. Can you guess? Scroll to the bottom of the table to see. [continue reading…]

{ 1 comment }

2016 Playoff Passing Numbers

These two were the top passers of the 2016 postseason

With the 2016 postseason in the books, who were the best and worst passers? There are 11 playoff games every year, and since there were no games where a starting quarterback was injured or benched during the game, that gives us 22 quarterback performances to evaluate.

The best performance belongs to Matt Ryan against the Packers in the NFC Championship Game. Ryan threw for 392 yards with 4 TDs and 0 interceptions or sacks. That’s 472 Adjusted Net Yards and it came on 38 dropbacks, which translates to a 12.42 ANY/A average. His opponent, Green Bay, allowed 6.85 ANY/A to passers this year; that means over the course of 38 dropbacks, Ryan produced 212 Adjusted Net Yards of Value above average.

Using that methodology, here are the single game playoff passing numbers from the 2016 postseason: [continue reading…]

{ 22 comments }

Atlanta had a really, really good offense this year. My favorite statistic: the Falcons had 59 drives end in a punt or a turnover, and 58 end in a touchdown.  Atlanta averaged 3.03 points per drive this year, and yet, the offense has been even better in the playoffs.

There was no stopping Matt Ryan and the Falcons against Green Bay, as the group scored 44 points on 9 drives in the NFC Championship Game. In the division round, the Falcons scored 36 points on 9 or 10 drives against Seattle, depending on whether you want to treat the Falcons final drive of the game as a real drive.  In two NFC playoff games, Atlanta’s offense has scored 10 touchdowns, seen 5 drives end on punts, 3 end on field goals, with zero turnovers and one drive end with the clock running out.

Scoring 80 points on 18 or 19 drives translates to an average of 4.21 or 4.44 points per drive. Take an average of those two numbers, and the offense is still averaging a whopping 4.32 points per drive. How remarkable is that? Well, it’s the best average for any of the 102 Super Bowl teams in their pre-Super Bowl playoff games.

The NFL has not historically recorded drive stats, so I previously wrote how one can estimate the number of offensive drives a team has in a game or season.  I used that formula to measure the best playoff offenses entering the Super Bowl; unsurprisingly, the 1990 Bills were the previous hottest offense.

Against Miami in the division round, Buffalo had between 10 and 12 drives, depending on how you treat the final drives of the half (the Bills received the ball with 14 seconds left on their own 32, and took a knee) and the game (Buffalo received the ball with just over one minute to go, and ran three times for a first down to run out the clock). Those other ten drives ended as follows, in order: Touchdown, Field Goal, Field Goal, Touchdown, Touchdown, Interception, Field Goal, Touchdown, Touchdown, Punt. That’s 44 points on 10 real drives.

The next week, in the AFC Championship Game against the Raiders, the Bills had 11 or 12 drives, as the final drive of the game featured Buffalo taking a pair of knees to close out a 51-3 victory. The first 11 drives went: TD, TD, Interception, TD, missed FG, TD, TD, Punt, TD, FG, Punt.  That’s 44 points (Buffalo also scored on a pick six, and one extra point was missed) on 11 drives. [continue reading…]

{ 14 comments }

Through 10 weeks, the Packers were 4-6 with a -29 points differential, 8th-worst in the NFL. If Green Bay wins today, the Packers will become the 5th team to make the Super Bowl after being 2 games below .500 at any point during the season.

  • In 1993, Emmitt Smith famously held out during the first two weeks of the season; Dallas lost both of those games (and a third game in November in which Smith left due to injury after just one carry), beginning the season 0-2.  The Cowboys went on to repeat as Super Bowl champions.
  • In 1996, the Patriots began the season with road losses to Buffalo and Miami.  New England wasn’t a great team that year, but finished 11-5, and a Jaguars upset in Mile High cleared the path for the Patriots to make it to the Super Bowl.
  • Five years later, the Patriots again began the season 0-2, with Drew Bledsoe of course being injured in the second game of the season.  Enter Tom Brady, who won his first game but lost his second, meaning the Patriots were against two games under .500 at 1-3 after four games.  New England, of course, won the franchise’s first Super Bowl that season.
  • In ’07, the Patriots lost the Super Bowl to a Giants team that started the year 0-2 with two losses.  New York allowed 80 points in those games, but it turned out to be a bit of a scheduling issue: those games came against the 13-3 Cowboys and 13-3 Packers, teams the Giants later beat in the playoffs.

The Packers would be a bit of a different case, of course, as 4-6 is different than 0-2 (although I’m not sure which is more “impressive” to come back from).  The latest in a season a Super Bowl team was under .500?  The 1979 Rams were 5-6 after 11 games, which means the Packers would “tie” this record if Green Bay wins today.  What about Super Bowl champions? Well, that would be the ’01 Patriots, at 3-4 after 7 games; so if the Packers win two more games, they would set that record. [continue reading…]

{ 0 comments }

Can The Steelers Pass Rush Lead Them To The Super Bowl?

Over the first 8 weeks of the season, the Pittsburgh Steelers had just 8 sacks.  That was the fewest in the NFL, and the corresponding 2.84% sack rate was also the worst in the league.

Since then, things have changed pretty significantly.  Pittsburgh has 36 sacks, most in the league since the start of week 9, five more than any other team in the NFL.  [1]Notably, the Giants are 2nd in sacks over that period, with 31; meanwhile, the Giants had the second-worst sack rate, at 2.85%, and second fewest sacks, with 8, over the first eight weeks.  And only Arizona’s defense (8.94%) has a higher sack rate than Pittsburgh’s 8.53% since then.

Here’s the sack rate for the Steelers defense in each game this season: in a black horizontal line, I’ve shown the league average sack rate. [continue reading…]

References

References
1 Notably, the Giants are 2nd in sacks over that period, with 31; meanwhile, the Giants had the second-worst sack rate, at 2.85%, and second fewest sacks, with 8, over the first eight weeks.
{ 2 comments }

The median amount of points scored in Falcons games this year is 57 points; in Packers games, that number is 53 points. So why is the over/under 60 points?

The average isn’t much different: there have been 58.9 points scored in Atlanta games, and 52.0 points scored in Green Bay games. You may be surprised to learn that during Green Bay’s 8-game winning streak, there have been 51.6 points scored per game: 32.1 by the Packers, and 19.5 by Packers opponents.

Of course, what’s really driving these numbers is not the points scored by both teams in these games, but by both offenses. The Packers are averaging 28.0 points per game this year over 18 games, 32.1 points per game during this 8-game winning streak, and 34.8 over the team’s last 5 games. Atlanta is averaging 33.9 points per game over 17 games, and 38.0 points over their current 5-game winning streak.

So by that line of thinking, a 60-point over/under probably feels low. But it is currently (the line may change) tied for the 2nd highest over/under of any game since 1978, with the only other playoff game on the list:

WinnerLoserYearWeekBoxscoreLineOver/UnderPFPATotal Pts
STLSFO20009Boxscore-763342458
NORDET2011WCBoxscore-10.560452873
KANOAK200416Boxscore-9.560313061
CARSTL200010Boxscore13.559.5272451
DENWAS20138Boxscore-1158.5452166
STLIND200116Boxscore-1358.5421759
STLATL20007Boxscore-1858.5452974
GNBNWE201413Boxscore-358262147
INDMIN20049Boxscore-758312859
CARSTL200014Boxscore85816319
DENPHI20134Boxscore-11.557.5522072

What do you think? Over or Under?

{ 5 comments }

In the wildcard round last season, all four road teams won.  It isn’t unusual to see a lower seed win in the wildcard round, as often you have the stronger team being on the road against a weak division winner.  That was probably the case when we saw KC beat Houston and Green Bay win in Washington last year; in addition, the Steelers upset the Bengals and Seahawks beat the Vikings.

Since then? Not a single road team has won a playoff game.  The four teams with bye last year — Carolina, Arizona, New England, and Denver — all won in the division round of the playoffs.  Then the #1 seeded Broncos and Panthers won, too, marking six straight home wins.  We skip the Super Bowl, although for trivia fans, the champion Broncos were in fact the designated home team.

In the first round of the playoffs this year, all four home teams won.  The “weak division winner” Texans were aided by a QB injury and beat the Raiders, while the 4 seed in the NFC (the Packers) rode a hot end-of-year streak to beat the Giants.  In addition, Seattle and Pittsburgh won as 3 seeds.

Then, yesterday, the 1 seeded Patriots and 2 seeded Falcons beat the Texans and Seahawks, respectively.  That runs the streak up to 12 straight wins by home teams in the playoffs.  That’s easily the most in NFL history.

In addition, if we include last year’s Super Bowl, that means the last 8 playoff games have been decided by at least 13 points.

Points
Tm Year Date
Time Opp Week Day Result PF PA PD
CAR 2015 2016-01-24 6:42 ARI 20 Sun W 49-15 49 15 34
DEN 2015 2016-02-07 6:39 CAR 21 Sun W 24-10 24 10 14
HOU 2016 2017-01-07 4:35 OAK 18 Sat W 27-14 27 14 13
SEA 2016 2017-01-07 8:15 DET 18 Sat W 26-6 26 6 20
PIT 2016 2017-01-08 1:05 MIA 18 Sun W 30-12 30 12 18
GNB 2016 2017-01-08 4:40 NYG 18 Sun W 38-13 38 13 25
ATL 2016 2017-01-14 4:35 SEA 19 Sat W 36-20 36 20 16
NWE 2016 2017-01-14 8:15 HOU 19 Sat W 34-16 34 16 18

There had never even been six straight games decided by at least 13 points, so this is also an NFL playoff record.

{ 4 comments }
Previous Posts