
The 1981 San Diego Chargers led the NFL in points and yards, but ranked 26th in points allowed and 27th in yards allowed in a 28-team NFL. The Chargers made it to the AFC Championship Game, but had the poor fortune of playing in Cincinnati in a game with -32 degree wind chill. The game wound up being known as the Freezer Bowl, and the Chargers lost 27-7. San Diego might have been better off playing in 2018.
The table below shows where each of the final four teams rank in points, yards, points allowed, and yards allowed, along with each team’s average rank of the two offensive categories and average rank of the two defensive categories. The final column shows the difference between the team’s offensive and defensive ranks, as a way of describing whether a team is offensive-powered or defensive-powered.
| Year | Team | PF Rk | Yd Rk | PA Rk | YA Rk | Avg Off Rk | Avg Def Rk | Off Heavy |
|---|---|---|---|---|---|---|---|---|
| 2018 | NOR | 3 | 8 | 14 | 14 | 5.5 | 14 | 8.5 |
| 2018 | NWE | 4 | 5 | 7 | 21 | 4.5 | 14 | 9.5 |
| 2018 | LAR | 2 | 2 | 20 | 19 | 2 | 19.5 | 17.5 |
| 2018 | KAN | 1 | 1 | 24 | 31 | 1 | 27.5 | 26.5 |
Let’s use the Saints as an example. New Orleans ranks 3rd in points for and 8th in yards, while ranking 14th in points allowed and 14th in yards allowed. Therefore, New Orleans has an average offensive rank (3, 8) of 5.5, and an average defensive rank of 14 (14,14). The Saints are considered offensive heavy to the tune of 8.5 slots (14 minus 5.5). And that makes the Saints the least offensive-heavy team remaining in the final four.
The graph below shows the average offensive rank (taking the average of each team’s rank in points and yards) and defensive rank for each of the final four teams in each season since the merger. As you can see, this is a heavily-slanted year for offense:
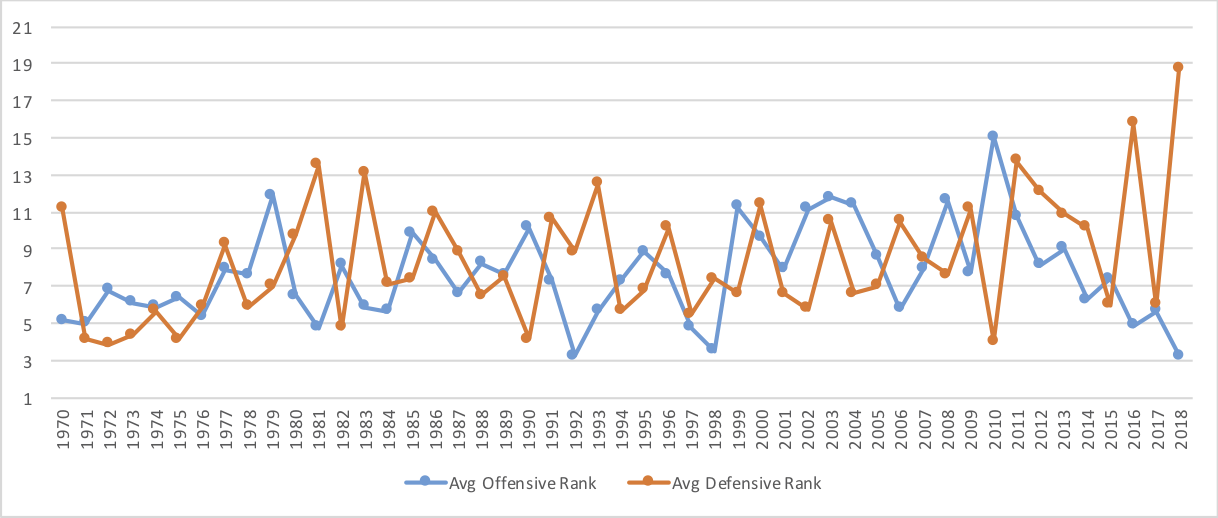
And here is the same data in table form. This year, the final four teams have offenses that, on average, rank 15.5 slots higher than their defenses. The 2016 final four is the only year that comes close, but the offenses are better in 2018 while the defenses are worse. Make no mistake: this is the most unbalanced set of final four teams we have ever seen:
| Year | PF Rk | PA Rk | Yd Rk | YA Rk | Avg Off Rk | Avg Def Rk | Off Heavy |
|---|---|---|---|---|---|---|---|
| 2018 | 2.5 | 16.25 | 4 | 21.25 | 3.25 | 18.75 | 15.5 |
| 2016 | 4.5 | 14.75 | 5.25 | 16.75 | 4.875 | 15.75 | 10.875 |
| 1981 | 4.25 | 11.75 | 5.25 | 15.25 | 4.75 | 13.5 | 8.75 |
| 1983 | 3.5 | 13 | 8.25 | 13.25 | 5.875 | 13.125 | 7.25 |
| 1993 | 4.5 | 9.25 | 6.75 | 15.75 | 5.625 | 12.5 | 6.875 |
| 1970 | 6.5 | 11 | 3.75 | 11.25 | 5.125 | 11.125 | 6 |
| 1992 | 3.5 | 8.25 | 3 | 9.5 | 3.25 | 8.875 | 5.625 |
| 2006 | 4 | 10.25 | 7.5 | 10.75 | 5.75 | 10.5 | 4.75 |
| 2012 | 7.25 | 7 | 9 | 17.25 | 8.125 | 12.125 | 4 |
| 1998 | 3 | 5 | 4 | 9.75 | 3.5 | 7.375 | 3.875 |
| 2014 | 5.25 | 10.25 | 7.25 | 10 | 6.25 | 10.125 | 3.875 |
| 1991 | 6 | 8.75 | 8.5 | 12.5 | 7.25 | 10.625 | 3.375 |
| 2009 | 6.75 | 9.75 | 8.75 | 12.5 | 7.75 | 11.125 | 3.375 |
| 1980 | 4.5 | 10.5 | 8.5 | 9 | 6.5 | 9.75 | 3.25 |
| 2011 | 8.75 | 11.25 | 12.75 | 16.25 | 10.75 | 13.75 | 3 |
| 1986 | 7 | 9.25 | 9.75 | 12.75 | 8.375 | 11 | 2.625 |
| 1996 | 6 | 9 | 9.25 | 11.25 | 7.625 | 10.125 | 2.5 |
| 1987 | 6 | 7.75 | 7.25 | 10 | 6.625 | 8.875 | 2.25 |
| 2013 | 5.75 | 9 | 12.25 | 12.75 | 9 | 10.875 | 1.875 |
| 2000 | 9.25 | 9.75 | 10 | 13 | 9.625 | 11.375 | 1.75 |
| 1984 | 6.75 | 5.5 | 4.5 | 8.75 | 5.625 | 7.125 | 1.5 |
| 1977 | 7.25 | 9.5 | 8.5 | 9 | 7.875 | 9.25 | 1.375 |
| 1997 | 3.75 | 6.25 | 5.75 | 4.75 | 4.75 | 5.5 | 0.75 |
| 2007 | 6 | 8 | 9.75 | 9 | 7.875 | 8.5 | 0.625 |
| 1976 | 5.25 | 4.5 | 5.5 | 7.25 | 5.375 | 5.875 | 0.5 |
| 2017 | 5 | 3 | 6.25 | 9 | 5.625 | 6 | 0.375 |
| 1989 | 6.25 | 6.25 | 9 | 8.75 | 7.625 | 7.5 | -0.125 |
| 1974 | 6.25 | 3.75 | 5.5 | 7.5 | 5.875 | 5.625 | -0.25 |
| 1971 | 4.75 | 4.5 | 5.25 | 3.75 | 5 | 4.125 | -0.875 |
| 2001 | 5.75 | 4.5 | 10 | 8.75 | 7.875 | 6.625 | -1.25 |
| 2003 | 10 | 9.5 | 13.5 | 11.5 | 11.75 | 10.5 | -1.25 |
| 2015 | 6.25 | 6.75 | 8.5 | 5.25 | 7.375 | 6 | -1.375 |
| 1994 | 6 | 5 | 8.5 | 6.25 | 7.25 | 5.625 | -1.625 |
| 2005 | 6.25 | 4.5 | 11 | 9.5 | 8.625 | 7 | -1.625 |
| 1973 | 6.5 | 3.25 | 5.75 | 5.5 | 6.125 | 4.375 | -1.75 |
| 1978 | 7.25 | 6 | 8 | 5.75 | 7.625 | 5.875 | -1.75 |
| 1988 | 10 | 7 | 6.5 | 6 | 8.25 | 6.5 | -1.75 |
| 1995 | 7.75 | 5.25 | 10 | 8.25 | 8.875 | 6.75 | -2.125 |
| 1975 | 7 | 4.75 | 5.75 | 3.5 | 6.375 | 4.125 | -2.25 |
| 1985 | 7.75 | 5.75 | 12 | 9 | 9.875 | 7.375 | -2.5 |
| 1972 | 5.75 | 3 | 7.75 | 4.75 | 6.75 | 3.875 | -2.875 |
| 1982 | 7.5 | 4 | 8.75 | 5.5 | 8.125 | 4.75 | -3.375 |
| 2008 | 10 | 9 | 13.25 | 6.25 | 11.625 | 7.625 | -4 |
| 1999 | 10.25 | 5.75 | 12.25 | 7.5 | 11.25 | 6.625 | -4.625 |
| 2004 | 9.75 | 4.75 | 13 | 8.5 | 11.375 | 6.625 | -4.75 |
| 1979 | 11.25 | 8.25 | 12.5 | 5.75 | 11.875 | 7 | -4.875 |
| 2002 | 9.25 | 5 | 13 | 6.5 | 11.125 | 5.75 | -5.375 |
| 1990 | 9.25 | 4 | 11 | 4.25 | 10.125 | 4.125 | -6 |
| 2010 | 14 | 3.25 | 16 | 4.75 | 15 | 4 | -11 |
It’s also the worst set of defensive teams we have ever seen. By way of comparison, in 2010, the final four teams had an average rank of 4.75 in yards allowed and 3.25 in points allowed. The Jets, Packers, Steelers, and Bears produced the most one-sided, defensive-powered final four we had ever seen.
Finally, here are all teams to make the conference championship game since 1970. The 2018 Chiefs have dethroned the ’81 Chargers and now stand out as the most one-sided final four team in favor of offense; the 1999 Bucs are the most one-sided team in favor of defense.
| Year | Team | PF Rk | Yd Rk | PA Rk | YA Rk | Avg Off Rk | Avg Def Rk | Off Heavy |
|---|---|---|---|---|---|---|---|---|
| 2018 | NOR | 3 | 8 | 14 | 14 | 5.5 | 14 | 8.5 |
| 2018 | NWE | 4 | 5 | 7 | 21 | 4.5 | 14 | 9.5 |
| 2018 | LAR | 2 | 2 | 20 | 19 | 2 | 19.5 | 17.5 |
| 2018 | KAN | 1 | 1 | 24 | 31 | 1 | 27.5 | 26.5 |
| 2017 | MIN | 10 | 11 | 1 | 1 | 10.5 | 1 | -9.5 |
| 2017 | JAX | 5 | 6 | 2 | 2 | 5.5 | 2 | -3.5 |
| 2017 | PHI | 3 | 7 | 4 | 4 | 5 | 4 | -1 |
| 2017 | NWE | 2 | 1 | 5 | 29 | 1.5 | 17 | 15.5 |
| 2016 | NWE | 3 | 4 | 1 | 8 | 3.5 | 4.5 | 1 |
| 2016 | PIT | 10 | 7 | 10 | 12 | 8.5 | 11 | 2.5 |
| 2016 | GNB | 4 | 8 | 21 | 22 | 6 | 21.5 | 15.5 |
| 2016 | ATL | 1 | 2 | 27 | 25 | 1.5 | 26 | 24.5 |
| 2015 | DEN | 19 | 16 | 4 | 1 | 17.5 | 2.5 | -15 |
| 2015 | CAR | 1 | 11 | 6 | 6 | 6 | 6 | 0 |
| 2015 | ARI | 2 | 1 | 7 | 5 | 1.5 | 6 | 4.5 |
| 2015 | NWE | 3 | 6 | 10 | 9 | 4.5 | 9.5 | 5 |
| 2014 | SEA | 10 | 9 | 1 | 1 | 9.5 | 1 | -8.5 |
| 2014 | NWE | 4 | 11 | 8 | 13 | 7.5 | 10.5 | 3 |
| 2014 | GNB | 1 | 6 | 13 | 15 | 3.5 | 14 | 10.5 |
| 2014 | IND | 6 | 3 | 19 | 11 | 4.5 | 15 | 10.5 |
| 2013 | SFO | 11 | 24 | 3 | 5 | 17.5 | 4 | -13.5 |
| 2013 | SEA | 8 | 17 | 1 | 1 | 12.5 | 1 | -11.5 |
| 2013 | NWE | 3 | 7 | 10 | 26 | 5 | 18 | 13 |
| 2013 | DEN | 1 | 1 | 22 | 19 | 1 | 20.5 | 19.5 |
| 2012 | SFO | 11 | 11 | 2 | 3 | 11 | 2.5 | -8.5 |
| 2012 | BAL | 10 | 16 | 12 | 17 | 13 | 14.5 | 1.5 |
| 2012 | ATL | 7 | 8 | 5 | 24 | 7.5 | 14.5 | 7 |
| 2012 | NWE | 1 | 1 | 9 | 25 | 1 | 17 | 16 |
| 2011 | SFO | 11 | 26 | 2 | 4 | 18.5 | 3 | -15.5 |
| 2011 | BAL | 12 | 15 | 3 | 3 | 13.5 | 3 | -10.5 |
| 2011 | NYG | 9 | 8 | 25 | 27 | 8.5 | 26 | 17.5 |
| 2011 | NWE | 3 | 2 | 15 | 31 | 2.5 | 23 | 20.5 |
| 2010 | CHI | 21 | 30 | 4 | 9 | 25.5 | 6.5 | -19 |
| 2010 | PIT | 12 | 14 | 1 | 2 | 13 | 1.5 | -11.5 |
| 2010 | NYJ | 13 | 11 | 6 | 3 | 12 | 4.5 | -7.5 |
| 2010 | GNB | 10 | 9 | 2 | 5 | 9.5 | 3.5 | -6 |
| 2009 | NYJ | 17 | 20 | 1 | 1 | 18.5 | 1 | -17.5 |
| 2009 | MIN | 2 | 5 | 10 | 6 | 3.5 | 8 | 4.5 |
| 2009 | IND | 7 | 9 | 8 | 18 | 8 | 13 | 5 |
| 2009 | NOR | 1 | 1 | 20 | 25 | 1 | 22.5 | 21.5 |
| 2008 | PIT | 20 | 22 | 1 | 1 | 21 | 1 | -20 |
| 2008 | BAL | 11 | 18 | 3 | 2 | 14.5 | 2.5 | -12 |
| 2008 | PHI | 6 | 9 | 4 | 3 | 7.5 | 3.5 | -4 |
| 2008 | ARI | 3 | 4 | 28 | 19 | 3.5 | 23.5 | 20 |
| 2007 | SDG | 5 | 20 | 5 | 14 | 12.5 | 9.5 | -3 |
| 2007 | NYG | 14 | 16 | 17 | 7 | 15 | 12 | -3 |
| 2007 | NWE | 1 | 1 | 4 | 4 | 1 | 4 | 3 |
| 2007 | GNB | 4 | 2 | 6 | 11 | 3 | 8.5 | 5.5 |
| 2006 | NWE | 7 | 11 | 2 | 6 | 9 | 4 | -5 |
| 2006 | CHI | 2 | 15 | 3 | 5 | 8.5 | 4 | -4.5 |
| 2006 | NOR | 5 | 1 | 13 | 11 | 3 | 12 | 9 |
| 2006 | IND | 2 | 3 | 23 | 21 | 2.5 | 22 | 19.5 |
| 2005 | CAR | 8 | 22 | 5 | 3 | 15 | 4 | -11 |
| 2005 | PIT | 9 | 15 | 3 | 4 | 12 | 3.5 | -8.5 |
| 2005 | DEN | 7 | 5 | 3 | 15 | 6 | 9 | 3 |
| 2005 | SEA | 1 | 2 | 7 | 16 | 1.5 | 11.5 | 10 |
| 2004 | PIT | 11 | 16 | 1 | 1 | 13.5 | 1 | -12.5 |
| 2004 | ATL | 16 | 20 | 14 | 14 | 18 | 14 | -4 |
| 2004 | PHI | 8 | 9 | 2 | 10 | 8.5 | 6 | -2.5 |
| 2004 | NWE | 4 | 7 | 2 | 9 | 5.5 | 5.5 | 0 |
| 2003 | NWE | 12 | 17 | 1 | 7 | 14.5 | 4 | -10.5 |
| 2003 | CAR | 15 | 16 | 10 | 8 | 15.5 | 9 | -6.5 |
| 2003 | PHI | 11 | 18 | 7 | 20 | 14.5 | 13.5 | -1 |
| 2003 | IND | 2 | 3 | 20 | 11 | 2.5 | 15.5 | 13 |
| 2002 | TAM | 18 | 24 | 1 | 1 | 21 | 1 | -20 |
| 2002 | TEN | 13 | 17 | 11 | 10 | 15 | 10.5 | -4.5 |
| 2002 | PHI | 4 | 10 | 2 | 4 | 7 | 3 | -4 |
| 2002 | OAK | 2 | 1 | 6 | 11 | 1.5 | 8.5 | 7 |
| 2001 | PHI | 9 | 17 | 2 | 7 | 13 | 4.5 | -8.5 |
| 2001 | PIT | 7 | 3 | 3 | 1 | 5 | 2 | -3 |
| 2001 | NWE | 6 | 19 | 6 | 24 | 12.5 | 15 | 2.5 |
| 2001 | STL | 1 | 1 | 7 | 3 | 1 | 5 | 4 |
| 2000 | BAL | 14 | 16 | 1 | 2 | 15 | 1.5 | -13.5 |
| 2000 | NYG | 15 | 13 | 5 | 5 | 14 | 5 | -9 |
| 2000 | OAK | 3 | 6 | 9 | 17 | 4.5 | 13 | 8.5 |
| 2000 | MIN | 5 | 5 | 24 | 28 | 5 | 26 | 21 |
| 1999 | TAM | 27 | 28 | 3 | 3 | 27.5 | 3 | -24.5 |
| 1999 | JAX | 6 | 7 | 1 | 4 | 6.5 | 2.5 | -4 |
| 1999 | STL | 1 | 1 | 4 | 6 | 1 | 5 | 4 |
| 1999 | TEN | 7 | 13 | 15 | 17 | 10 | 16 | 6 |
| 1998 | NYJ | 5 | 4 | 2 | 7 | 4.5 | 4.5 | 0 |
| 1998 | ATL | 4 | 7 | 4 | 8 | 5.5 | 6 | 0.5 |
| 1998 | DEN | 2 | 3 | 8 | 11 | 2.5 | 9.5 | 7 |
| 1998 | MIN | 1 | 2 | 6 | 13 | 1.5 | 9.5 | 8 |
| 1997 | SFO | 5 | 12 | 3 | 1 | 8.5 | 2 | -6.5 |
| 1997 | PIT | 7 | 6 | 11 | 6 | 6.5 | 8.5 | 2 |
| 1997 | GNB | 2 | 4 | 5 | 7 | 3 | 6 | 3 |
| 1997 | DEN | 1 | 1 | 6 | 5 | 1 | 5.5 | 4.5 |
| 1996 | CAR | 7 | 23 | 2 | 10 | 15 | 6 | -9 |
| 1996 | GNB | 1 | 5 | 1 | 1 | 3 | 1 | -2 |
| 1996 | JAX | 14 | 2 | 19 | 15 | 8 | 17 | 9 |
| 1996 | NWE | 2 | 7 | 14 | 19 | 4.5 | 16.5 | 12 |
| 1995 | IND | 17 | 22 | 5 | 7 | 19.5 | 6 | -13.5 |
| 1995 | PIT | 5 | 6 | 9 | 3 | 5.5 | 6 | 0.5 |
| 1995 | DAL | 3 | 5 | 3 | 9 | 4 | 6 | 2 |
| 1995 | GNB | 6 | 7 | 4 | 14 | 6.5 | 9 | 2.5 |
| 1994 | PIT | 16 | 13 | 2 | 2 | 14.5 | 2 | -12.5 |
| 1994 | DAL | 2 | 8 | 3 | 1 | 5 | 2 | -3 |
| 1994 | SDG | 5 | 11 | 9 | 14 | 8 | 11.5 | 3.5 |
| 1994 | SFO | 1 | 2 | 6 | 8 | 1.5 | 7 | 5.5 |
| 1993 | KAN | 8 | 16 | 14 | 11 | 12 | 12.5 | 0.5 |
| 1993 | DAL | 2 | 4 | 2 | 10 | 3 | 6 | 3 |
| 1993 | BUF | 7 | 6 | 5 | 27 | 6.5 | 16 | 9.5 |
| 1993 | SFO | 1 | 1 | 16 | 15 | 1 | 15.5 | 14.5 |
| 1992 | DAL | 2 | 4 | 5 | 1 | 3 | 3 | 0 |
| 1992 | MIA | 8 | 5 | 11 | 10 | 6.5 | 10.5 | 4 |
| 1992 | SFO | 1 | 1 | 3 | 15 | 1 | 9 | 8 |
| 1992 | BUF | 3 | 2 | 14 | 12 | 2.5 | 13 | 10.5 |
| 1991 | DEN | 12 | 12 | 3 | 5 | 12 | 4 | -8 |
| 1991 | DET | 9 | 17 | 11 | 15 | 13 | 13 | 0 |
| 1991 | WAS | 1 | 4 | 2 | 3 | 2.5 | 2.5 | 0 |
| 1991 | BUF | 2 | 1 | 19 | 27 | 1.5 | 23 | 21.5 |
| 1990 | NYG | 15 | 17 | 1 | 2 | 16 | 1.5 | -14.5 |
| 1990 | RAI | 13 | 19 | 7 | 4 | 16 | 5.5 | -10.5 |
| 1990 | SFO | 8 | 2 | 2 | 3 | 5 | 2.5 | -2.5 |
| 1990 | BUF | 1 | 6 | 6 | 8 | 3.5 | 7 | 3.5 |
| 1989 | DEN | 8 | 15 | 1 | 3 | 11.5 | 2 | -9.5 |
| 1989 | CLE | 14 | 16 | 4 | 7 | 15 | 5.5 | -9.5 |
| 1989 | SFO | 1 | 1 | 3 | 4 | 1 | 3.5 | 2.5 |
| 1989 | RAM | 2 | 4 | 17 | 21 | 3 | 19 | 16 |
| 1988 | CHI | 18 | 11 | 1 | 2 | 14.5 | 1.5 | -13 |
| 1988 | BUF | 14 | 12 | 3 | 4 | 13 | 3.5 | -9.5 |
| 1988 | SFO | 7 | 2 | 8 | 3 | 4.5 | 5.5 | 1 |
| 1988 | CIN | 1 | 1 | 16 | 15 | 1 | 15.5 | 14.5 |
| 1987 | CLE | 3 | 9 | 2 | 3 | 6 | 2.5 | -3.5 |
| 1987 | MIN | 13 | 15 | 16 | 10 | 14 | 13 | -1 |
| 1987 | DEN | 4 | 2 | 7 | 9 | 3 | 8 | 5 |
| 1987 | WAS | 4 | 3 | 6 | 18 | 3.5 | 12 | 8.5 |
| 1986 | NYG | 8 | 10 | 2 | 2 | 9 | 2 | -7 |
| 1986 | DEN | 6 | 15 | 15 | 9 | 10.5 | 12 | 1.5 |
| 1986 | CLE | 5 | 9 | 11 | 19 | 7 | 15 | 8 |
| 1986 | WAS | 9 | 5 | 9 | 21 | 7 | 15 | 8 |
| 1985 | RAM | 15 | 26 | 4 | 5 | 20.5 | 4.5 | -16 |
| 1985 | CHI | 2 | 7 | 1 | 1 | 4.5 | 1 | -3.5 |
| 1985 | NWE | 10 | 9 | 6 | 7 | 9.5 | 6.5 | -3 |
| 1985 | MIA | 4 | 6 | 12 | 23 | 5 | 17.5 | 12.5 |
| 1984 | CHI | 16 | 7 | 3 | 1 | 11.5 | 2 | -9.5 |
| 1984 | PIT | 8 | 8 | 11 | 5 | 8 | 8 | 0 |
| 1984 | SFO | 2 | 2 | 1 | 10 | 2 | 5.5 | 3.5 |
| 1984 | MIA | 1 | 1 | 7 | 19 | 1 | 13 | 12 |
| 1983 | SFO | 4 | 4 | 4 | 10 | 4 | 7 | 3 |
| 1983 | RAI | 3 | 7 | 13 | 4 | 5 | 8.5 | 3.5 |
| 1983 | WAS | 1 | 3 | 11 | 12 | 2 | 11.5 | 9.5 |
| 1983 | SEA | 6 | 19 | 24 | 27 | 12.5 | 25.5 | 13 |
| 1982 | MIA | 10 | 19 | 2 | 1 | 14.5 | 1.5 | -13 |
| 1982 | WAS | 12 | 7 | 1 | 4 | 9.5 | 2.5 | -7 |
| 1982 | DAL | 5 | 5 | 3 | 11 | 5 | 7 | 2 |
| 1982 | NYJ | 3 | 4 | 10 | 6 | 3.5 | 8 | 4.5 |
| 1981 | SFO | 7 | 13 | 2 | 2 | 10 | 2 | -8 |
| 1981 | DAL | 6 | 5 | 7 | 20 | 5.5 | 13.5 | 8 |
| 1981 | CIN | 3 | 2 | 12 | 12 | 2.5 | 12 | 9.5 |
| 1981 | SDG | 1 | 1 | 26 | 27 | 1 | 26.5 | 25.5 |
| 1980 | PHI | 6 | 8 | 1 | 2 | 7 | 1.5 | -5.5 |
| 1980 | OAK | 7 | 16 | 10 | 11 | 11.5 | 10.5 | -1 |
| 1980 | SDG | 4 | 1 | 18 | 6 | 2.5 | 12 | 9.5 |
| 1980 | DAL | 1 | 9 | 13 | 17 | 5 | 15 | 10 |
| 1979 | TAM | 21 | 14 | 1 | 1 | 17.5 | 1 | -16.5 |
| 1979 | RAM | 15 | 13 | 11 | 7 | 14 | 9 | -5 |
| 1979 | HOU | 8 | 22 | 16 | 13 | 15 | 14.5 | -0.5 |
| 1979 | PIT | 1 | 1 | 5 | 2 | 1 | 3.5 | 2.5 |
| 1978 | RAM | 9 | 6 | 4 | 1 | 7.5 | 2.5 | -5 |
| 1978 | PIT | 5 | 8 | 1 | 3 | 6.5 | 2 | -4.5 |
| 1978 | DAL | 1 | 2 | 3 | 2 | 1.5 | 2.5 | 1 |
| 1978 | HOU | 14 | 16 | 16 | 17 | 15 | 16.5 | 1.5 |
| 1977 | DEN | 10 | 17 | 3 | 9 | 13.5 | 6 | -7.5 |
| 1977 | MIN | 16 | 14 | 13 | 11 | 15 | 12 | -3 |
| 1977 | DAL | 2 | 1 | 8 | 1 | 1.5 | 4.5 | 3 |
| 1977 | OAK | 1 | 2 | 14 | 15 | 1.5 | 14.5 | 13 |
| 1976 | PIT | 5 | 9 | 1 | 1 | 7 | 1 | -6 |
| 1976 | MIN | 9 | 6 | 2 | 6 | 7.5 | 4 | -3.5 |
| 1976 | RAM | 3 | 5 | 3 | 4 | 4 | 3.5 | -0.5 |
| 1976 | OAK | 4 | 2 | 12 | 18 | 3 | 15 | 12 |
| 1975 | RAM | 11 | 9 | 1 | 2 | 10 | 1.5 | -8.5 |
| 1975 | PIT | 5 | 7 | 2 | 4 | 6 | 3 | -3 |
| 1975 | OAK | 4 | 4 | 7 | 3 | 4 | 5 | 1 |
| 1975 | DAL | 8 | 3 | 9 | 5 | 5.5 | 7 | 1.5 |
| 1974 | RAM | 13 | 9 | 1 | 3 | 11 | 2 | -9 |
| 1974 | PIT | 6 | 8 | 2 | 1 | 7 | 1.5 | -5.5 |
| 1974 | MIN | 5 | 3 | 3 | 10 | 4 | 6.5 | 2.5 |
| 1974 | OAK | 1 | 2 | 9 | 16 | 1.5 | 12.5 | 11 |
| 1973 | MIA | 5 | 9 | 1 | 3 | 7 | 2 | -5 |
| 1973 | OAK | 10 | 3 | 3 | 2 | 6.5 | 2.5 | -4 |
| 1973 | MIN | 9 | 7 | 2 | 12 | 8 | 7 | -1 |
| 1973 | DAL | 2 | 4 | 7 | 5 | 3 | 6 | 3 |
| 1972 | WAS | 7 | 11 | 3 | 4 | 9 | 3.5 | -5.5 |
| 1972 | PIT | 5 | 13 | 2 | 8 | 9 | 5 | -4 |
| 1972 | DAL | 10 | 6 | 6 | 6 | 8 | 6 | -2 |
| 1972 | MIA | 1 | 1 | 1 | 1 | 1 | 1 | 0 |
| 1971 | BAL | 5 | 12 | 2 | 1 | 8.5 | 1.5 | -7 |
| 1971 | MIA | 4 | 5 | 3 | 5 | 4.5 | 4 | -0.5 |
| 1971 | SFO | 9 | 3 | 6 | 6 | 6 | 6 | 0 |
| 1971 | DAL | 1 | 1 | 7 | 3 | 1 | 5 | 4 |
| 1970 | DAL | 10 | 4 | 4 | 4 | 7 | 4 | -3 |
| 1970 | BAL | 6 | 8 | 7 | 9 | 7 | 8 | 1 |
| 1970 | SFO | 1 | 2 | 14 | 13 | 1.5 | 13.5 | 12 |
| 1970 | OAK | 9 | 1 | 19 | 19 | 5 | 19 | 14 |
As always, please leave your thoughts in the comments.