
Two years ago, I wrote that 2018 gave us The Most Offensive-Powered Final Four Ever. Well, Tom Brady and Patrick Mahomes are back, this time joined by the Packers and Aaron Rodgers and the Bills and Josh Allen (as opposed to the Saints and Drew Brees and the Rams and Sean McVay–bot in ’18). In 2018, the top four teams in scoring made it to the final four: it doesn’t get any more clear cut than that.
This year, the top three scoring teams — Green Bay, Buffalo, and Tampa Bay, in order — are in the final four. They are joined by the Chiefs, who ranked 3rd in the AFC (behind Tennessee) and 6th in the NFL in scoring (also behind New Orleans). Saying that Kansas City has the worst offense of any playoff team left is a bit like saying that Batman is the superhero with the weakest powers; you may have a bunch of evidence, but nobody is going to take your claim very seriously. It is also worthwhile to point that that the Chiefs ranked 2nd in the NFL in scoring after 16 weeks, before benching Patrick Mahomes and several other starters in a meaningless week 17 game and falling to 6th in the rankings.
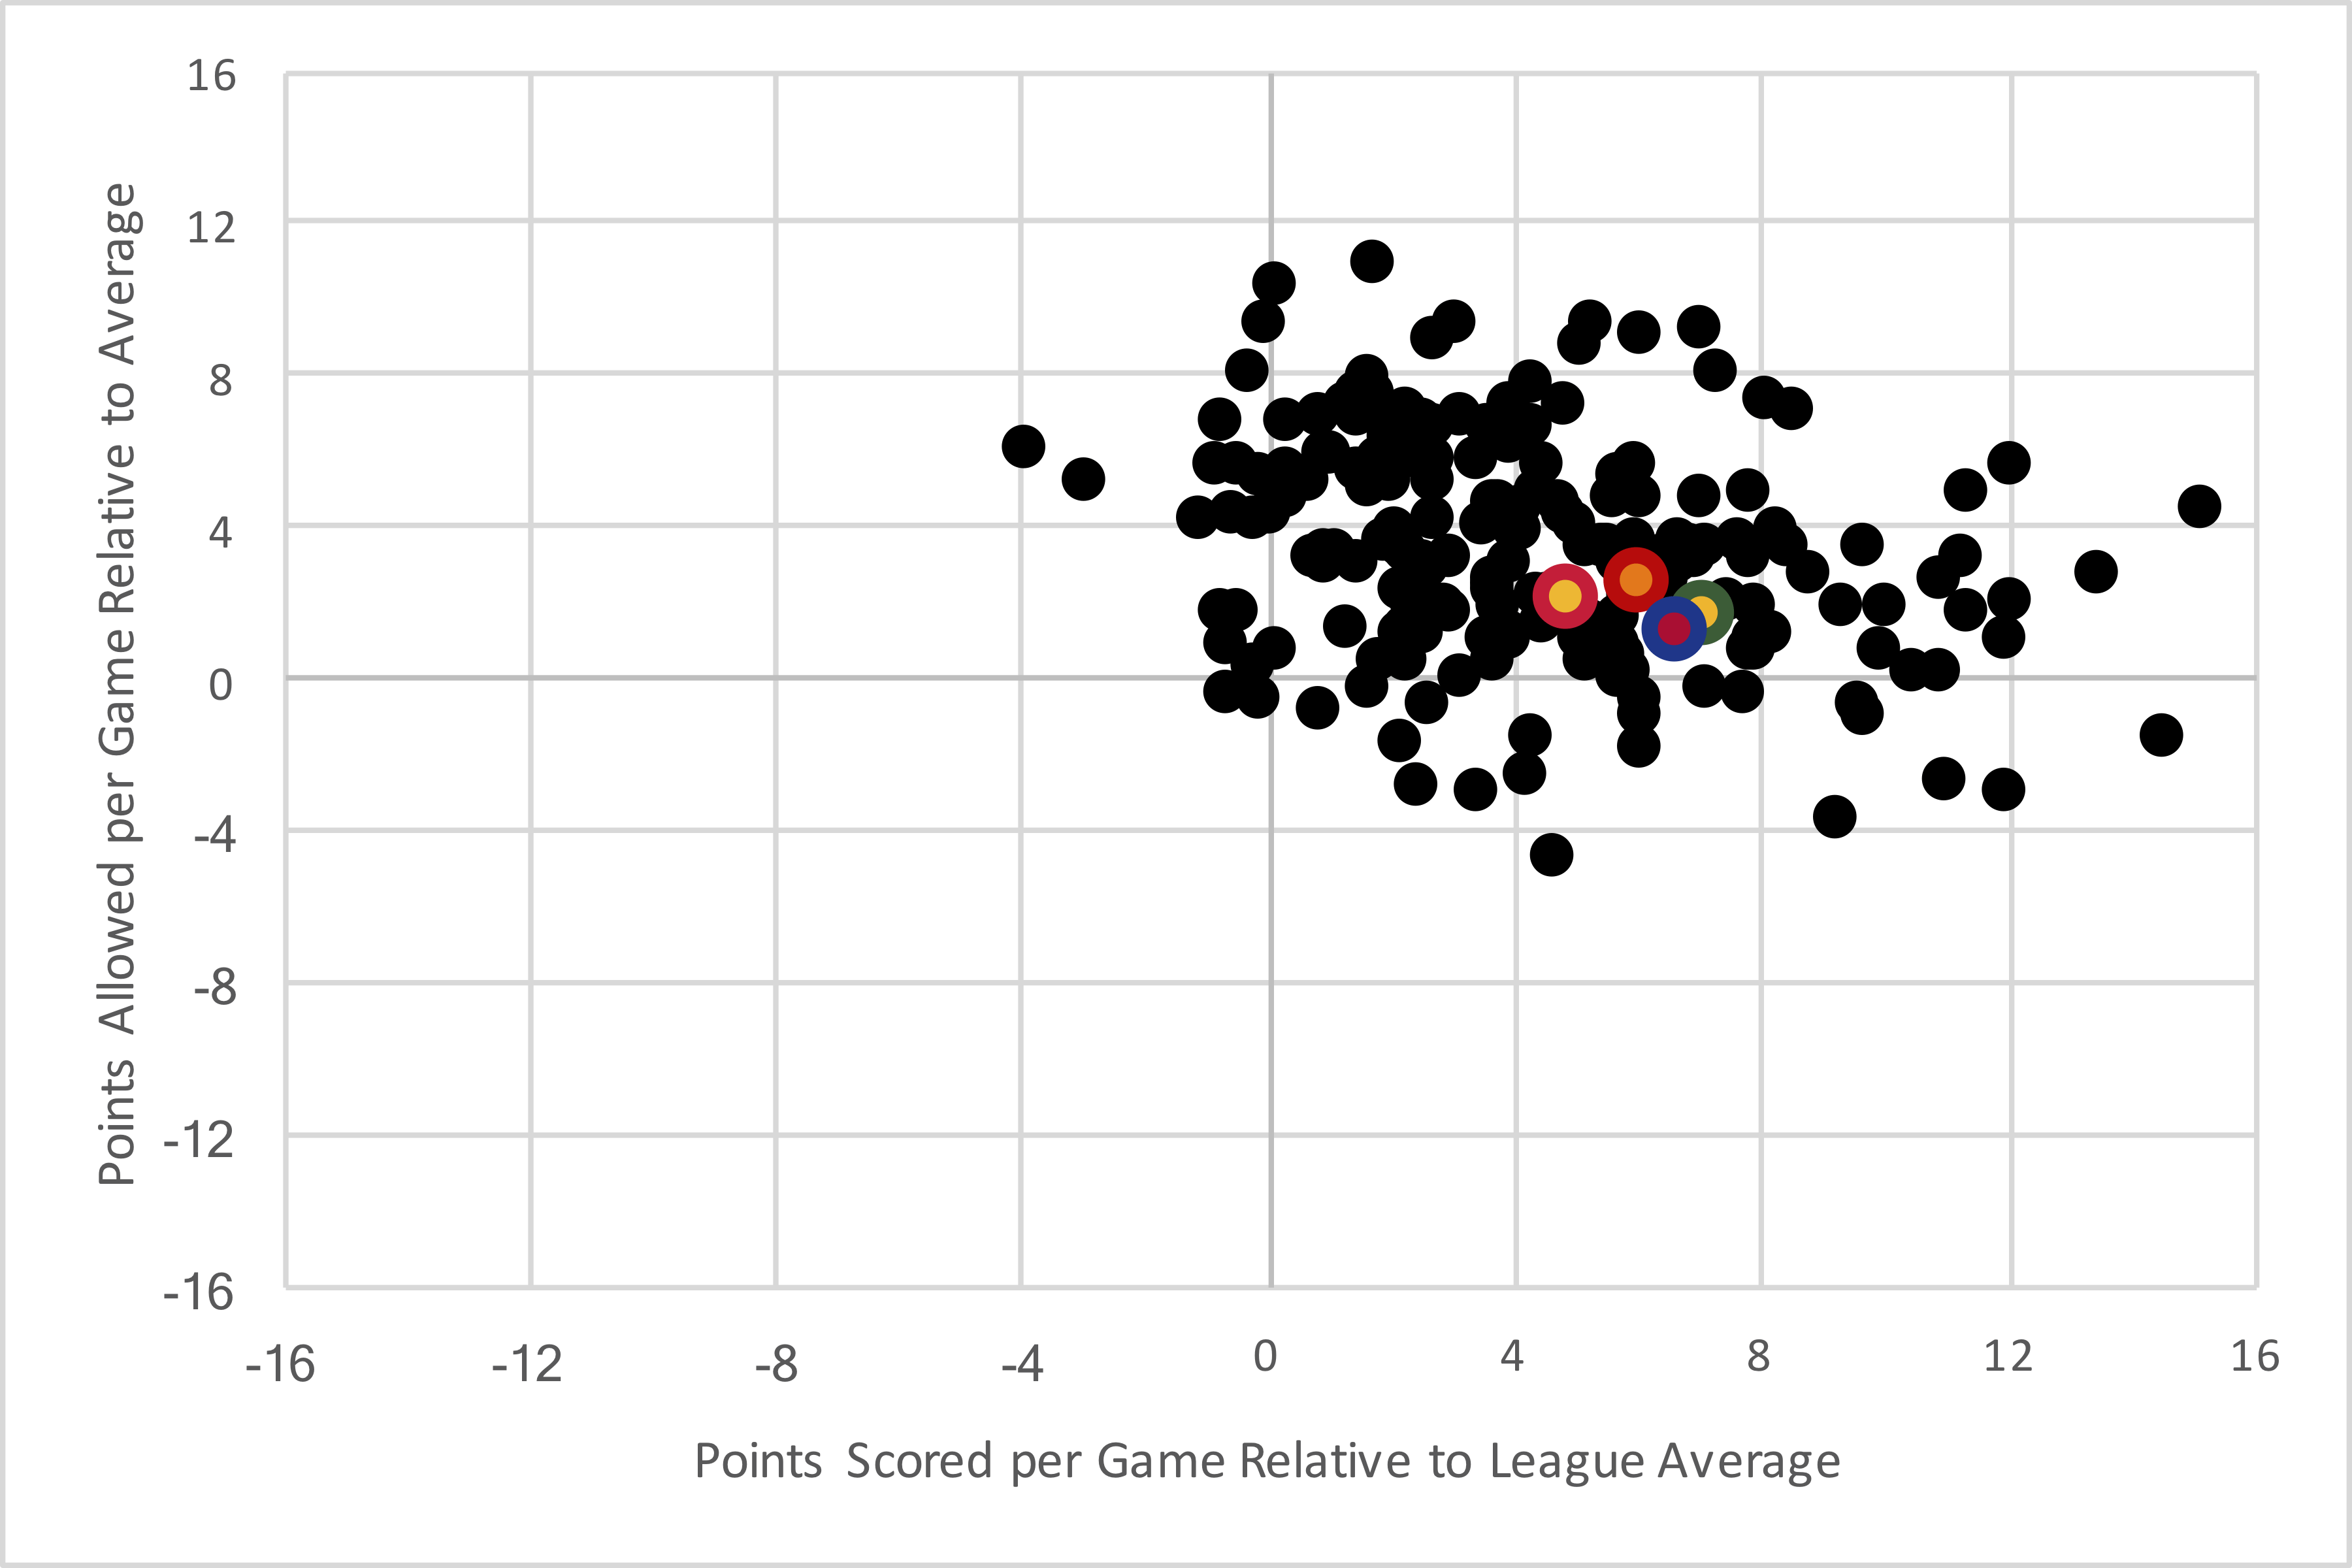
And while this year may not have the final four according to the ranks, it is certainly up there as one of the highest-powered final fours of all time. In 2020, NFL teams averaged 24.8 points per game; the Packers led the league by averaging 31.8 points per game, or 7.0 points per game better than average. There have been 204 teams to make it to the conference championship game since 1970, and I calculated how many points per game each team scored relative to league average in each season. I also did the same for points allowed. The graph below shows all 204 teams, with their points scored per game relative to league average on the X-Axis, and the points allowed metric on the Y-Axis. In other words:
Top right = good offense, good defense
Top left = bad offense, good defense
Bottom left = bad offense, bad defense
Bottom right = good offense, bad defense
As you would expect, most of the teams that make it to the conference championship game fall in the upper right quadrant. I have color-coded the 2020 teams in the graph below.
Let’s zoom in a bit, since most of the graph is focused in one section.
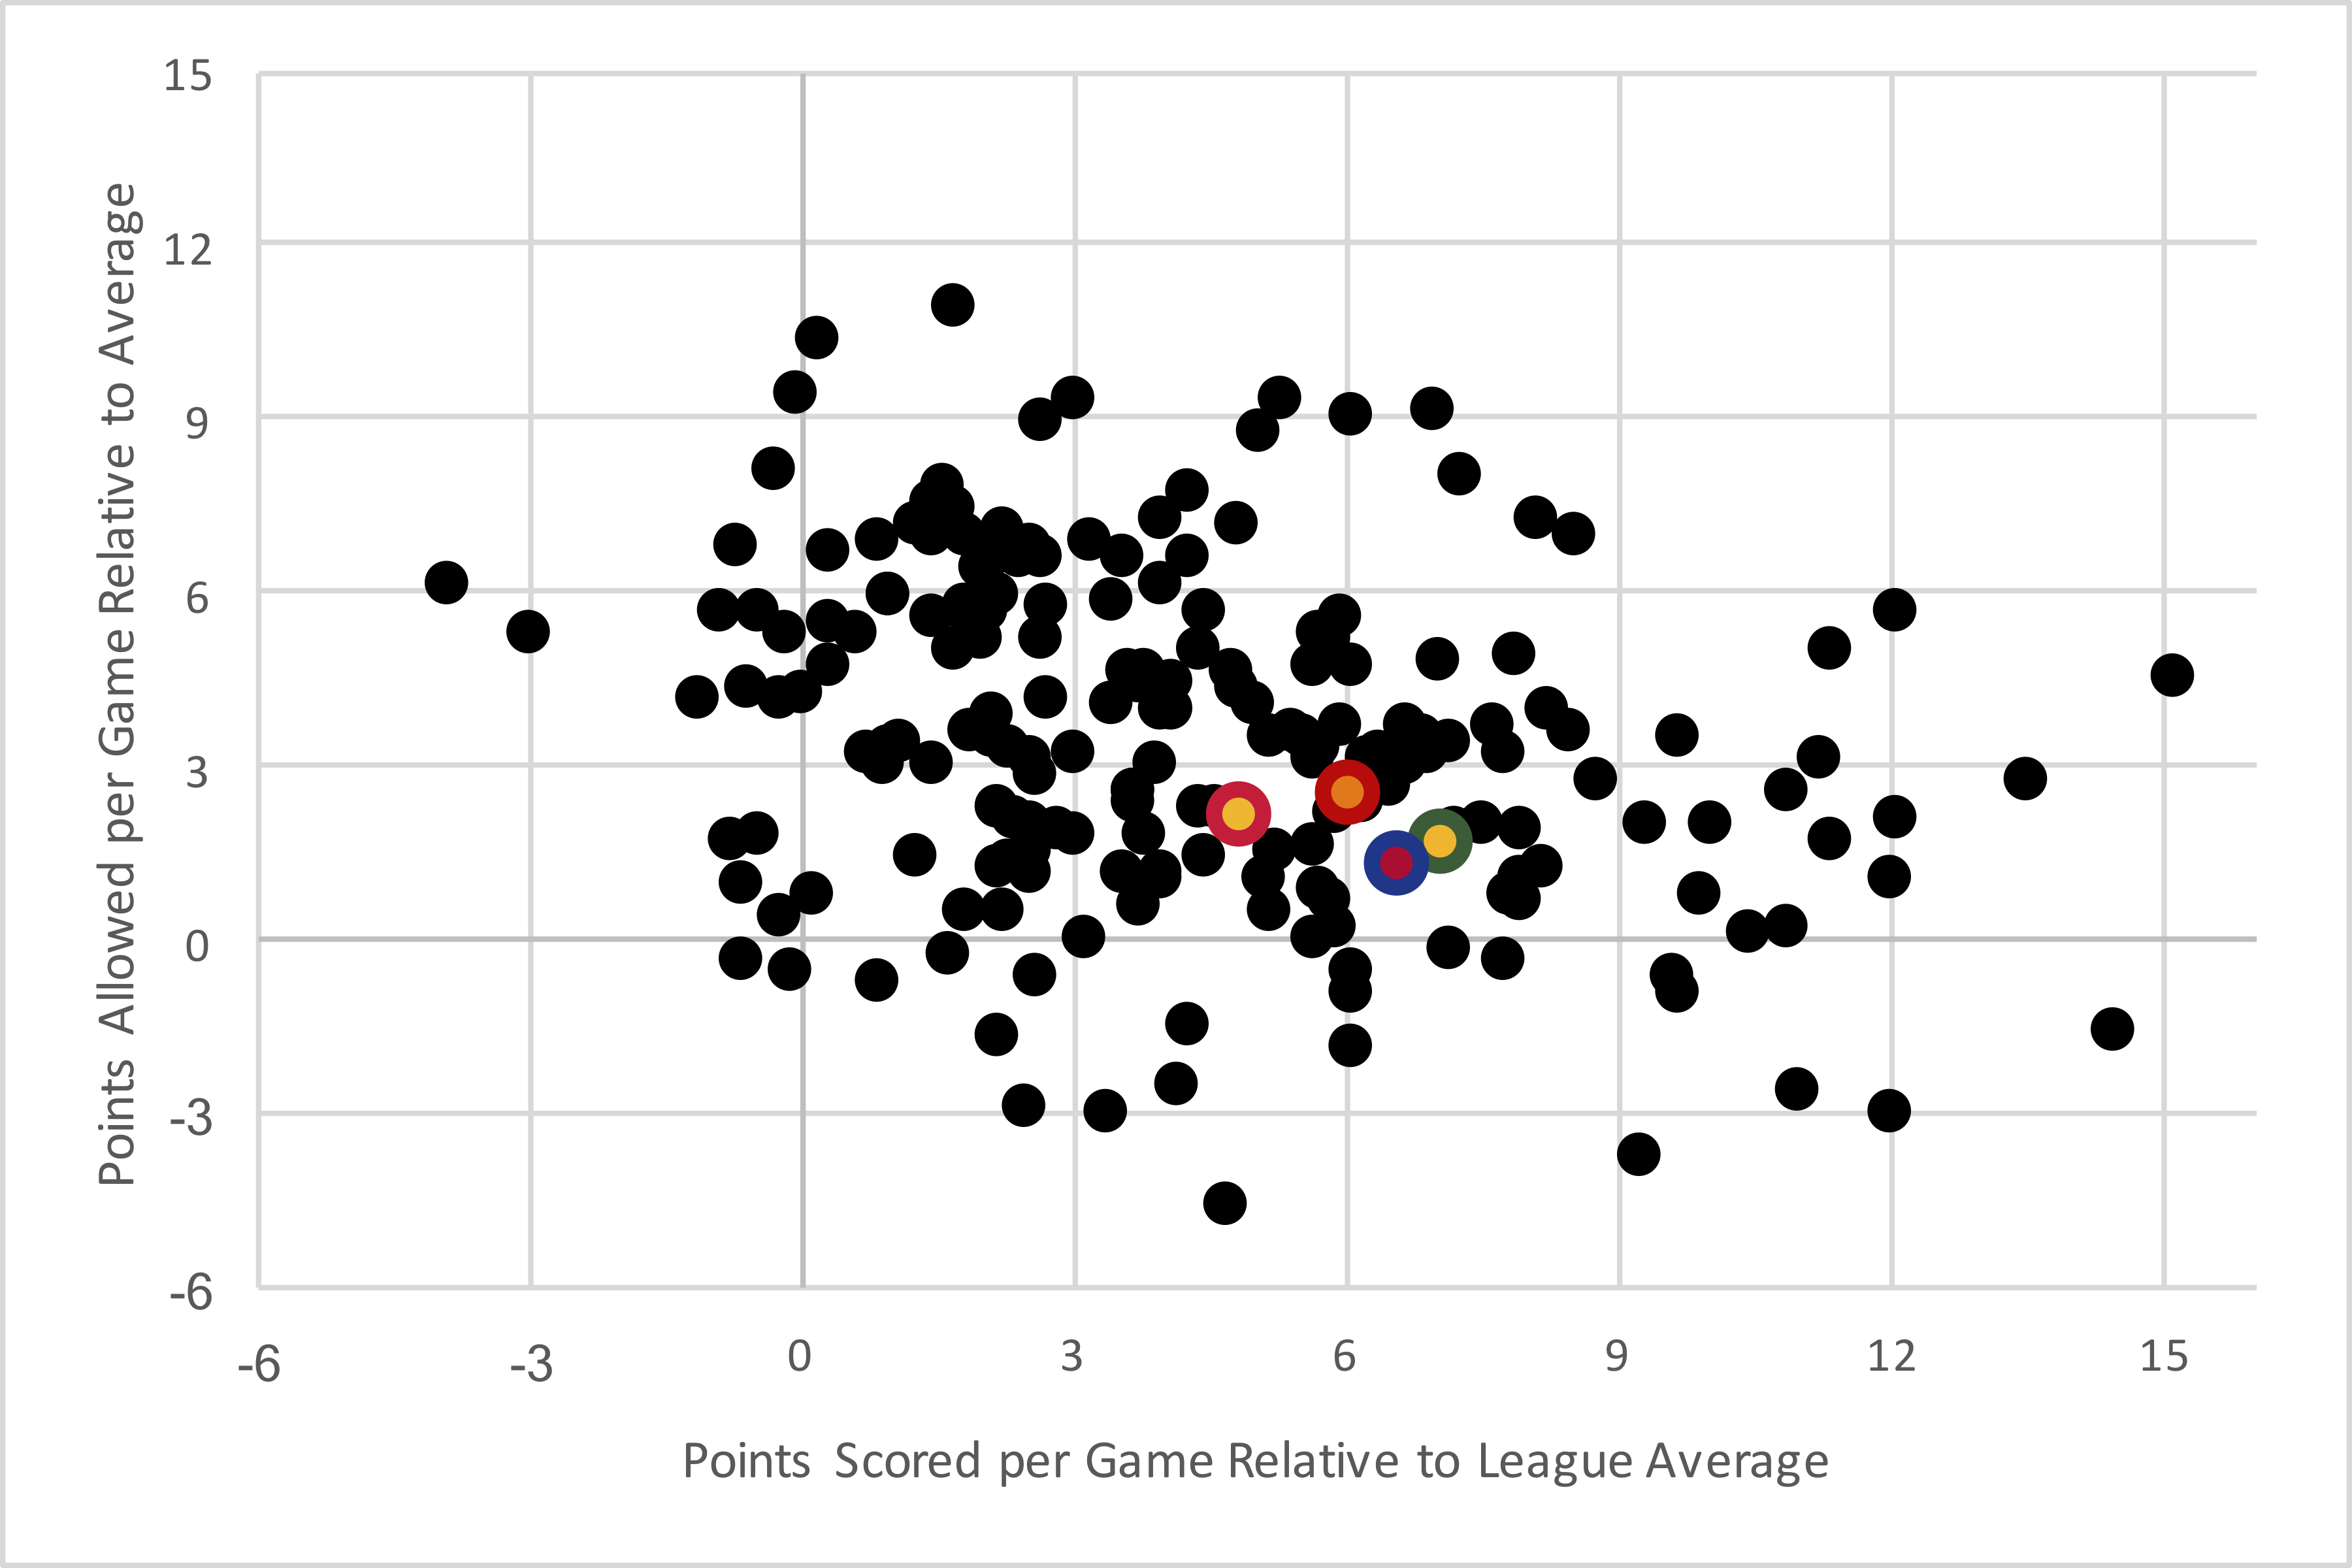
Upon a closer look, I don’t think the real takeaway is how great these four offenses are, even if (1) all four offenses are actually great and (2) even after adjusting for era, they are all top notch offenses. I just think it’s a little more nuanced than that, because you usually have the top scoring teams make it pretty far. There have been 204 teams to make the AFC or NFC Championship Game, from 1970 to 2020. Now, if we line them all up — from the ’07 Patriots (15.1 points per game above average) to the ’99 Bucs (-3.9 points per game below average) — the 2020 teams rank 42nd, 50th, 60th, and 85th in that group. So the 2020 final four doesn’t have a historically remarkable offense by these standards; what makes it unique is that all four teams have really good offenses. In fact, this is the only final four with all four teams in the top 85. The 1998 final four — which, believe it or not, did not feature Tom Brady — comes up just a hair behind, with its fourth team ranking 86th in the group. This year and 1998 are the only two seasons where all final four teams were at least 4.5 points per game better than average; so while Green Bay’s +7.0 PG margin is not historically notable, the fact that the fourth best offense is still nearly five points per game better than league average is notable.
On the other hand, when we look at the defenses, we get a different story. Perhaps that’s the other really interesting about 2020: none of the final four teams rank in the top 120 of the 204 teams to make it to this round! In fact, this is the first final four ever where none of the defenses finished at least 3 points per game better than average (2018 was the closest, but the ’18 Patriots just snuck in there). Usually there is at least one dominant defense that makes it to the conference championship game; And while none of these teams have an awful defense, it’s clear that this year, the final four teams are very offense-heavy. [1]In terms of DVOA, the Bucs (5th) look to be the best, followed by Buffalo (12th), Green Bay (17th), and Kansas City (22nd). The Ravens, Steelers, Rams, and Football team had the top two defenses in each conference; usually one of “those types of teams” makes it this far, but not this season. For those that aren’t interested in era adjustments, the stats are even more clear: this is the first time in NFL history that all of the final four teams allowed over 350 points! Tampa Bay allowed 355 points during the regular season; in every other year since 1970, at least two of the final four teams allowed under that number.
So yes, 2020 is a pretty notable year when it comes to the final four teams: none of them have anything less than an exceptional offense, and none of them have an upper tier defense.
Finally, let’s close with a data dump. The table below shows all 204 teams to make it to the conference championship game. Here’s how to read it, using the In 2020, Tampa Bay averaged 6.0 points per game more than league average, which ranks 60th out of the 204 teams. The 2020 Final 4 teams averaged 6.1 more points per game than average. If you sort the table by that column, you’ll see that 2020 is the fifth most scoring-heavy quartet, behind 1998, 2018, a very unevenly distributed 2007, and 1983.
Back to the Tampa Bay row: the Bucs allowed 2.6 points per game better than average, which ranks only 123rd out of the 204 teams. The final 4 teams were just 2.0 points per game better than average at preventing scoring, which is the 6th-worst.
| Team | Year | Pts/G vs. Avg | Pts Rk | Final 4 Avg | Pts A/G vs. Avg | PA Rk | Final 4 Avg |
|---|---|---|---|---|---|---|---|
| TAM | 2020 | 6.0 | 60 | 6.1 | 2.6 | 123 | 2.0 |
| KAN | 2020 | 4.8 | 85 | 6.1 | 2.2 | 133 | 2.0 |
| GNB | 2020 | 7.0 | 42 | 6.1 | 1.7 | 148 | 2.0 |
| BUF | 2020 | 6.5 | 50 | 6.1 | 1.4 | 156 | 2.0 |
| KAN | 2019 | 5.4 | 75 | 3.9 | 3.6 | 93 | 3.1 |
| SFO | 2019 | 7.1 | 39 | 3.9 | 3.4 | 100 | 3.1 |
| GNB | 2019 | 0.7 | 180 | 3.9 | 3.3 | 106 | 3.1 |
| TEN | 2019 | 2.3 | 140 | 3.9 | 2.1 | 134 | 3.1 |
| NWE | 2018 | 3.9 | 105 | 8.4 | 3.0 | 116 | 0.2 |
| NOR | 2018 | 8.2 | 26 | 8.4 | 1.3 | 157 | 0.2 |
| LAR | 2018 | 9.6 | 19 | 8.4 | -0.7 | 190 | 0.2 |
| KAN | 2018 | 12.0 | 7 | 8.4 | -3.0 | 201 | 0.2 |
| MIN | 2017 | 2.2 | 147 | 5.1 | 6.0 | 39 | 4.4 |
| JAX | 2017 | 4.3 | 91 | 5.1 | 5.0 | 63 | 4.4 |
| PHI | 2017 | 6.8 | 46 | 5.1 | 3.3 | 105 | 4.4 |
| NWE | 2017 | 6.9 | 45 | 5.1 | 3.2 | 108 | 4.4 |
| NWE | 2016 | 4.8 | 84 | 5.5 | 7.2 | 19 | 1.4 |
| PIT | 2016 | 2.2 | 146 | 5.5 | 2.3 | 129 | 1.4 |
| GNB | 2016 | 4.2 | 95 | 5.5 | -1.5 | 194 | 1.4 |
| ATL | 2016 | 11.0 | 11 | 5.5 | -2.6 | 199 | 1.4 |
| DEN | 2015 | -0.6 | 196 | 5.5 | 4.3 | 77 | 3.6 |
| CAR | 2015 | 8.4 | 24 | 5.5 | 3.6 | 93 | 3.6 |
| ARI | 2015 | 7.8 | 33 | 5.5 | 3.3 | 106 | 3.6 |
| NWE | 2015 | 6.3 | 53 | 5.5 | 3.1 | 112 | 3.6 |
| SEA | 2014 | 2.0 | 152 | 5.6 | 6.7 | 30 | 2.5 |
| NWE | 2014 | 6.7 | 48 | 5.6 | 3.0 | 117 | 2.5 |
| GNB | 2014 | 7.8 | 32 | 5.6 | 0.8 | 168 | 2.5 |
| IND | 2014 | 6.0 | 56 | 5.6 | -0.5 | 187 | 2.5 |
| SEA | 2013 | 2.7 | 128 | 5.9 | 9.0 | 8 | 4.0 |
| SFO | 2013 | 2.0 | 155 | 5.9 | 6.4 | 36 | 4.0 |
| NWE | 2013 | 4.3 | 92 | 5.9 | 2.3 | 130 | 4.0 |
| DEN | 2013 | 14.5 | 2 | 5.9 | -1.5 | 195 | 4.0 |
| SFO | 2012 | 2.1 | 151 | 4.9 | 5.7 | 46 | 3.3 |
| ATL | 2012 | 3.4 | 117 | 4.9 | 4.1 | 83 | 3.3 |
| NWE | 2012 | 12.1 | 5 | 4.9 | 2.1 | 135 | 3.3 |
| BAL | 2012 | 2.1 | 148 | 4.9 | 1.3 | 158 | 3.3 |
| SFO | 2011 | 1.6 | 166 | 3.8 | 7.9 | 12 | 2.9 |
| BAL | 2011 | 1.4 | 167 | 3.8 | 5.6 | 52 | 2.9 |
| NWE | 2011 | 9.9 | 16 | 3.8 | 0.8 | 169 | 2.9 |
| NYG | 2011 | 2.4 | 138 | 3.8 | -2.8 | 200 | 2.9 |
| PIT | 2010 | 1.4 | 170 | 0.8 | 7.5 | 14 | 5.4 |
| GNB | 2010 | 2.2 | 143 | 0.8 | 7.0 | 20 | 5.4 |
| CHI | 2010 | -1.2 | 202 | 0.8 | 4.2 | 82 | 5.4 |
| NYJ | 2010 | 0.9 | 177 | 0.8 | 3.0 | 115 | 5.4 |
| NYJ | 2009 | 0.3 | 183 | 5.8 | 6.7 | 29 | 2.8 |
| IND | 2009 | 4.5 | 88 | 5.8 | 2.3 | 131 | 2.8 |
| MIN | 2009 | 7.9 | 28 | 5.8 | 2.0 | 140 | 2.8 |
| NOR | 2009 | 10.4 | 14 | 5.8 | 0.2 | 180 | 2.8 |
| PIT | 2008 | -0.3 | 193 | 2.6 | 8.1 | 10 | 3.6 |
| BAL | 2008 | 2.0 | 153 | 2.6 | 6.8 | 28 | 3.6 |
| PHI | 2008 | 4.0 | 99 | 2.6 | 4.0 | 86 | 3.6 |
| ARI | 2008 | 4.7 | 87 | 2.6 | -4.6 | 204 | 3.6 |
| NWE | 2007 | 15.1 | 1 | 6.6 | 4.6 | 72 | 2.9 |
| SDG | 2007 | 4.1 | 98 | 6.6 | 3.9 | 87 | 2.9 |
| GNB | 2007 | 5.5 | 74 | 6.6 | 3.5 | 98 | 2.9 |
| NYG | 2007 | 1.6 | 165 | 6.6 | -0.3 | 184 | 2.9 |
| NWE | 2006 | 3.4 | 118 | 5.2 | 5.8 | 42 | 2.3 |
| CHI | 2006 | 6.0 | 57 | 5.2 | 4.7 | 68 | 2.3 |
| NOR | 2006 | 5.2 | 79 | 5.2 | 0.5 | 175 | 2.3 |
| IND | 2006 | 6.0 | 57 | 5.2 | -1.8 | 197 | 2.3 |
| DEN | 2005 | 4.1 | 97 | 4.8 | 4.5 | 73 | 4.3 |
| PIT | 2005 | 3.7 | 109 | 4.8 | 4.5 | 73 | 4.3 |
| CAR | 2005 | 3.8 | 106 | 4.8 | 4.4 | 75 | 4.3 |
| SEA | 2005 | 7.6 | 35 | 4.8 | 3.7 | 91 | 4.3 |
| PIT | 2004 | 1.8 | 161 | 2.5 | 5.8 | 43 | 4.2 |
| NWE | 2004 | 5.8 | 65 | 2.5 | 5.2 | 58 | 4.2 |
| PHI | 2004 | 2.6 | 129 | 2.5 | 5.2 | 58 | 4.2 |
| ATL | 2004 | -0.2 | 191 | 2.5 | 0.4 | 177 | 4.2 |
| NWE | 2003 | 0.9 | 176 | 2.5 | 6.0 | 40 | 2.6 |
| PHI | 2003 | 2.5 | 132 | 2.5 | 2.9 | 119 | 2.6 |
| CAR | 2003 | -0.5 | 195 | 2.5 | 1.8 | 145 | 2.6 |
| IND | 2003 | 7.1 | 40 | 2.5 | -0.2 | 183 | 2.6 |
| TAM | 2002 | 0.0 | 188 | 3.0 | 9.4 | 3 | 5.0 |
| PHI | 2002 | 4.3 | 93 | 3.0 | 6.6 | 32 | 5.0 |
| OAK | 2002 | 6.5 | 51 | 3.0 | 2.7 | 122 | 5.0 |
| TEN | 2002 | 1.3 | 171 | 3.0 | 1.4 | 154 | 5.0 |
| PHI | 2001 | 1.2 | 172 | 4.3 | 7.2 | 18 | 5.1 |
| PIT | 2001 | 1.8 | 160 | 4.3 | 7.0 | 22 | 5.1 |
| NWE | 2001 | 3.0 | 123 | 4.3 | 3.2 | 110 | 5.1 |
| STL | 2001 | 11.2 | 10 | 4.3 | 3.1 | 111 | 5.1 |
| BAL | 2000 | 0.1 | 185 | 3.3 | 10.4 | 2 | 3.8 |
| NYG | 2000 | -0.2 | 190 | 3.3 | 5.3 | 55 | 3.8 |
| OAK | 2000 | 9.3 | 20 | 3.3 | 2.0 | 138 | 3.8 |
| MIN | 2000 | 4.1 | 96 | 3.3 | -2.5 | 198 | 3.8 |
| JAX | 1999 | 3.9 | 102 | 3.9 | 7.3 | 17 | 4.9 |
| TAM | 1999 | -3.9 | 204 | 3.9 | 6.1 | 38 | 4.9 |
| STL | 1999 | 12.1 | 4 | 3.9 | 5.7 | 47 | 4.9 |
| TEN | 1999 | 3.7 | 110 | 3.9 | 0.6 | 173 | 4.9 |
| NYJ | 1998 | 4.7 | 86 | 8.6 | 4.7 | 71 | 3.2 |
| ATL | 1998 | 6.3 | 52 | 8.6 | 3.2 | 108 | 3.2 |
| MIN | 1998 | 13.5 | 3 | 8.6 | 2.8 | 121 | 3.2 |
| DEN | 1998 | 10.0 | 15 | 8.6 | 2.0 | 139 | 3.2 |
| SFO | 1997 | 2.7 | 126 | 4.9 | 4.2 | 81 | 2.9 |
| GNB | 1997 | 5.6 | 72 | 4.9 | 3.1 | 113 | 2.9 |
| DEN | 1997 | 8.8 | 22 | 4.9 | 2.8 | 120 | 2.9 |
| PIT | 1997 | 2.5 | 136 | 4.9 | 1.6 | 151 | 2.9 |
| GNB | 1996 | 8.1 | 27 | 4.0 | 7.3 | 16 | 3.6 |
| CAR | 1996 | 2.5 | 135 | 4.0 | 6.8 | 27 | 3.6 |
| NWE | 1996 | 5.7 | 68 | 4.0 | 0.9 | 167 | 3.6 |
| JAX | 1996 | -0.1 | 189 | 4.0 | -0.5 | 188 | 3.6 |
| DAL | 1995 | 5.7 | 67 | 3.2 | 3.3 | 104 | 2.0 |
| GNB | 1995 | 3.8 | 107 | 3.2 | 1.9 | 143 | 2.0 |
| IND | 1995 | -0.8 | 200 | 3.2 | 1.7 | 147 | 2.0 |
| PIT | 1995 | 4.0 | 101 | 3.2 | 1.1 | 163 | 2.0 |
| PIT | 1994 | -0.5 | 194 | 5.0 | 5.6 | 49 | 3.3 |
| DAL | 1994 | 5.6 | 73 | 5.0 | 4.8 | 66 | 3.3 |
| SFO | 1994 | 11.3 | 9 | 5.0 | 1.8 | 146 | 3.3 |
| SDG | 1994 | 3.6 | 115 | 5.0 | 1.1 | 161 | 3.3 |
| DAL | 1993 | 4.8 | 83 | 4.8 | 4.4 | 76 | 2.2 |
| BUF | 1993 | 1.9 | 157 | 4.8 | 3.6 | 92 | 2.2 |
| KAN | 1993 | 1.8 | 159 | 4.8 | 0.5 | 176 | 2.2 |
| SFO | 1993 | 10.9 | 12 | 4.8 | 0.3 | 178 | 2.2 |
| SFO | 1992 | 8.2 | 25 | 5.7 | 4.0 | 85 | 2.4 |
| DAL | 1992 | 6.8 | 47 | 5.7 | 3.5 | 95 | 2.4 |
| MIA | 1992 | 2.5 | 134 | 5.7 | 1.2 | 159 | 2.4 |
| BUF | 1992 | 5.1 | 80 | 5.7 | 1.0 | 165 | 2.4 |
| WAS | 1991 | 11.3 | 8 | 5.8 | 5.0 | 62 | 2.2 |
| DEN | 1991 | 0.0 | 187 | 5.8 | 4.3 | 78 | 2.2 |
| DET | 1991 | 2.2 | 144 | 5.8 | 0.5 | 174 | 2.2 |
| BUF | 1991 | 9.6 | 17 | 5.8 | -0.9 | 192 | 2.2 |
| NYG | 1990 | 0.8 | 178 | 2.6 | 6.9 | 24 | 4.8 |
| SFO | 1990 | 1.9 | 156 | 2.6 | 5.2 | 60 | 4.8 |
| BUF | 1990 | 6.6 | 49 | 2.6 | 3.7 | 90 | 4.8 |
| RAI | 1990 | 0.9 | 175 | 2.6 | 3.4 | 102 | 4.8 |
| DEN | 1989 | 2.0 | 154 | 3.8 | 6.5 | 35 | 3.8 |
| SFO | 1989 | 7.0 | 43 | 3.8 | 4.8 | 65 | 3.8 |
| CLE | 1989 | 0.3 | 184 | 3.8 | 4.7 | 67 | 3.8 |
| RAM | 1989 | 6.0 | 59 | 3.8 | -0.9 | 193 | 3.8 |
| CHI | 1988 | -0.8 | 199 | 2.5 | 6.8 | 26 | 3.5 |
| BUF | 1988 | 0.3 | 182 | 2.5 | 5.4 | 53 | 3.5 |
| SFO | 1988 | 2.8 | 125 | 2.5 | 1.9 | 142 | 3.5 |
| CIN | 1988 | 7.7 | 34 | 2.5 | -0.3 | 186 | 3.5 |
| CLE | 1987 | 4.4 | 90 | 3.1 | 5.7 | 48 | 2.5 |
| WAS | 1987 | 3.7 | 112 | 3.1 | 2.6 | 124 | 2.5 |
| DEN | 1987 | 3.7 | 112 | 3.1 | 2.4 | 127 | 2.5 |
| MIN | 1987 | 0.8 | 179 | 3.1 | -0.7 | 191 | 2.5 |
| NYG | 1986 | 2.7 | 127 | 3.0 | 5.8 | 44 | 2.3 |
| WAS | 1986 | 2.5 | 137 | 3.0 | 2.0 | 137 | 2.3 |
| CLE | 1986 | 3.9 | 103 | 3.0 | 1.1 | 160 | 2.3 |
| DEN | 1986 | 3.1 | 121 | 3.0 | 0.1 | 181 | 2.3 |
| CHI | 1985 | 7.0 | 44 | 3.3 | 9.2 | 6 | 4.6 |
| RAM | 1985 | -0.3 | 192 | 3.3 | 4.2 | 80 | 4.6 |
| NWE | 1985 | 1.1 | 173 | 3.3 | 3.4 | 101 | 4.6 |
| MIA | 1985 | 5.2 | 77 | 3.3 | 1.5 | 152 | 4.6 |
| SFO | 1984 | 8.5 | 23 | 5.4 | 7.0 | 21 | 4.3 |
| CHI | 1984 | -0.9 | 201 | 5.4 | 5.7 | 45 | 4.3 |
| MIA | 1984 | 10.9 | 13 | 5.4 | 2.6 | 125 | 4.3 |
| PIT | 1984 | 3.0 | 124 | 5.4 | 1.8 | 144 | 4.3 |
| SFO | 1983 | 5.2 | 78 | 6.6 | 3.5 | 96 | 0.6 |
| WAS | 1983 | 12.0 | 6 | 6.6 | 1.1 | 162 | 0.6 |
| RAI | 1983 | 5.8 | 66 | 6.6 | 0.7 | 172 | 0.6 |
| SEA | 1983 | 3.4 | 119 | 6.6 | -3.0 | 202 | 0.6 |
| WAS | 1982 | 1.0 | 174 | 3.7 | 5.9 | 41 | 4.3 |
| MIA | 1982 | 1.8 | 158 | 3.7 | 5.6 | 50 | 4.3 |
| DAL | 1982 | 5.0 | 82 | 3.7 | 4.0 | 84 | 4.3 |
| NYJ | 1982 | 7.1 | 41 | 3.7 | 1.7 | 149 | 4.3 |
| SFO | 1981 | 1.6 | 164 | 4.7 | 5.0 | 61 | 1.6 |
| DAL | 1981 | 2.3 | 141 | 4.7 | 3.4 | 103 | 1.6 |
| CIN | 1981 | 5.6 | 70 | 4.7 | 1.7 | 150 | 1.6 |
| SDG | 1981 | 9.2 | 21 | 4.7 | -3.7 | 203 | 1.6 |
| PHI | 1980 | 3.5 | 116 | 4.8 | 6.6 | 31 | 2.3 |
| OAK | 1980 | 2.3 | 141 | 4.8 | 1.4 | 155 | 2.3 |
| DAL | 1980 | 7.9 | 30 | 4.8 | 1.0 | 164 | 2.3 |
| SDG | 1980 | 5.6 | 70 | 4.8 | 0.0 | 182 | 2.3 |
| TAM | 1979 | -3.0 | 203 | 1.4 | 5.3 | 57 | 2.3 |
| PIT | 1979 | 5.9 | 61 | 1.4 | 3.7 | 89 | 2.3 |
| RAM | 1979 | 0.1 | 186 | 1.4 | 0.8 | 170 | 2.3 |
| HOU | 1979 | 2.6 | 131 | 1.4 | -0.6 | 189 | 2.3 |
| PIT | 1978 | 3.9 | 103 | 2.6 | 6.1 | 37 | 3.6 |
| DAL | 1978 | 5.7 | 69 | 2.6 | 5.3 | 54 | 3.6 |
| RAM | 1978 | 1.4 | 168 | 2.6 | 3.0 | 118 | 3.6 |
| HOU | 1978 | -0.6 | 197 | 2.6 | -0.3 | 185 | 3.6 |
| DEN | 1977 | 2.4 | 139 | 4.3 | 6.6 | 33 | 2.6 |
| DAL | 1977 | 7.5 | 36 | 4.3 | 2.0 | 136 | 2.6 |
| MIN | 1977 | -0.7 | 198 | 4.3 | 1.0 | 166 | 2.6 |
| OAK | 1977 | 7.9 | 29 | 4.3 | 0.7 | 171 | 2.6 |
| PIT | 1976 | 5.3 | 76 | 4.9 | 9.3 | 5 | 5.9 |
| MIN | 1976 | 2.6 | 130 | 4.9 | 6.6 | 34 | 5.9 |
| RAM | 1976 | 5.9 | 62 | 4.9 | 5.6 | 51 | 5.9 |
| OAK | 1976 | 5.8 | 64 | 4.9 | 2.2 | 132 | 5.9 |
| RAM | 1975 | 1.7 | 162 | 4.6 | 10.9 | 1 | 5.9 |
| PIT | 1975 | 6.1 | 55 | 4.6 | 9.0 | 7 | 5.9 |
| OAK | 1975 | 6.2 | 54 | 4.6 | 2.4 | 128 | 5.9 |
| DAL | 1975 | 4.4 | 89 | 4.6 | 1.4 | 153 | 5.9 |
| RAM | 1974 | 0.6 | 181 | 3.8 | 5.3 | 56 | 4.0 |
| PIT | 1974 | 3.6 | 114 | 3.8 | 4.7 | 69 | 4.0 |
| MIN | 1974 | 4.0 | 100 | 3.8 | 4.3 | 79 | 4.0 |
| OAK | 1974 | 7.2 | 38 | 3.8 | 1.9 | 141 | 4.0 |
| MIA | 1973 | 5.0 | 81 | 4.0 | 8.7 | 9 | 7.0 |
| MIN | 1973 | 1.7 | 163 | 4.0 | 7.5 | 15 | 7.0 |
| OAK | 1973 | 1.4 | 169 | 4.0 | 7.0 | 23 | 7.0 |
| DAL | 1973 | 7.8 | 31 | 4.0 | 5.0 | 64 | 7.0 |
| MIA | 1972 | 7.2 | 37 | 4.4 | 8.0 | 11 | 5.9 |
| PIT | 1972 | 4.2 | 94 | 4.4 | 7.8 | 13 | 5.9 |
| WAS | 1972 | 3.7 | 108 | 4.4 | 4.7 | 70 | 5.9 |
| DAL | 1972 | 2.5 | 133 | 4.4 | 3.1 | 114 | 5.9 |
| BAL | 1971 | 3.0 | 122 | 4.5 | 9.4 | 4 | 5.9 |
| MIA | 1971 | 3.1 | 120 | 4.5 | 6.9 | 25 | 5.9 |
| SFO | 1971 | 2.1 | 150 | 4.5 | 3.9 | 88 | 5.9 |
| DAL | 1971 | 9.6 | 18 | 4.5 | 3.5 | 97 | 5.9 |
| DAL | 1970 | 2.1 | 149 | 3.5 | 3.5 | 99 | 1.1 |
| BAL | 1970 | 3.7 | 111 | 3.5 | 2.5 | 126 | 1.1 |
| SFO | 1970 | 5.9 | 63 | 3.5 | 0.2 | 179 | 1.1 |
| OAK | 1970 | 2.2 | 145 | 3.5 | -1.7 | 196 | 1.1 |
As always, please leave your thoughts in the comments.