by Chase Stuart
on October 22, 2019
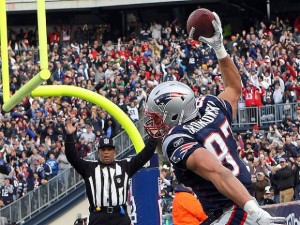
We are never going to see this level of statistical dominance by a pass defense again.
That’s a pretty bold statement from a pretty conservative blog focused on football history. But 1 passing TD allowed and 18 interceptions in a 7-game stretch?
That will never happen again, and frankly, we may not ever see anything all that close to it happen again. In 2018, the NFL finally exceeded a 2-to-1 ratio of passing touchdowns to interceptions, and the long-term trend is clear: more touchdown passes, fewer interceptions. This season, the 31 pass defenses in the NFL outside of Foxboro have allowed 319 passing touchdowns and forced 155 interceptions, a 2.06-to-1.00 ratio. But the Patriots have forced opposing passers into a 1-to-18 ratio. Include New England’s pass defense, and the NFL’s TD/INT ratio drops to 1.85-to-1.00.
That. Is. Absurd.
Yes, the quarterbacks have been bad. Really bad in some cases (Luke Falk, Josh Rosen), but it also includes games from Ben Roethlisberger, Sam Darnold (coming off a dominant performance), and occasionally competent passers like Case Keenum, Josh Allen, Daniel Jones, and Ryan Fitzpatrick. But it doesn’t matter: if you would have asked me could the best defense in the NFL produce a 1-to-18 ratio against the worst quarterbacks in the NFL for a 7-game span, I would have said no.
This is obviously unsustainable but it is so far to the right tail of comprehensible that you just have to look at the stat line in awe. And know that something like this will never happen again. New England’s defense has posted a passer rating of 35.6; if you throw an incomplete pass on every plat, that’s a 39.6 passer rating! New England is allowing less than 1.0 ANY/A over 7 games! If a running back had 1,000 yards on his first 100 carries of the season, that would be unsustainable, too, but it wouldn’t make it any less remarkable. It might make it more remarkable, because this transcends any notion of what we would think possible.
The graph below shows the TD% (on the X-Axis) and INT% (on the Y-Axis) for each pass defense this year. To make “up and to the right” the good part of the graph, I have plotted the TD% in reverse order. As you can see, the Patriots pass defense stands alone. [continue reading…]
Tagged as:
Patriots
{ }
by Chase Stuart
on February 16, 2019
Let’s flash back to the end of November 1993. The Patriots were 1-10 in their first season under Bill Parcells. The Dolphins had just defeated the Cowboys on Thanksgiving in the Leon Lett game to get to 9-2. And these records were consistent with the level of success each franchise had achieved. At that point in time, New England’s franchise record was an underwhelming 217-269-9, which translates to a 0.447 winning percentage. Miami, meanwhile, was one of the best franchises in league history, with a 253-154-4 record, a 0.620 winning percentage.
But things have been very different since then. Miami lost their final 5 games of the regular season, while the Patriots ended the year on a 4-game winning streak. And, you know, lots of good things for happened for New England since then, too.
As crazy as this might be for younger fans to believe, the Dolphins *still* had a better franchise record than the Patriots entering the 2018 season. Miami was 445-351-4, a 0.5588 winning percentage, while New England was at 489-386-9, a 0.5583 winning percentage.
On the morning of October 21, 2018, the Dolphins and Patriots were both 4-2, slightly upping Miami’s franchise winning percentage to 0.5596 and New England’s to 0.5590. That afternoon, Miami would lose to the Lions while New England would beat the Bears. While this was not a big story at the time, it was a momentous moment for the two franchises: the Dolphins were now 449-354-4, giving them a 0.5589 winning percentage, while the Patriots were 494-388-9, a 0.5595 winning percentage.
It means, after all these years, the Patriots finally had a better franchise record than the Dolphins. And, of course, New England didn’t let up. As of the end of the 2018 season, the Dolphins have a franchise record of 452-360-4 (0.556), while New England is 500-391-9 (0.561). [continue reading…]
Tagged as:
Dolphins,
Patriots
{ }
by Chase Stuart
on February 5, 2019
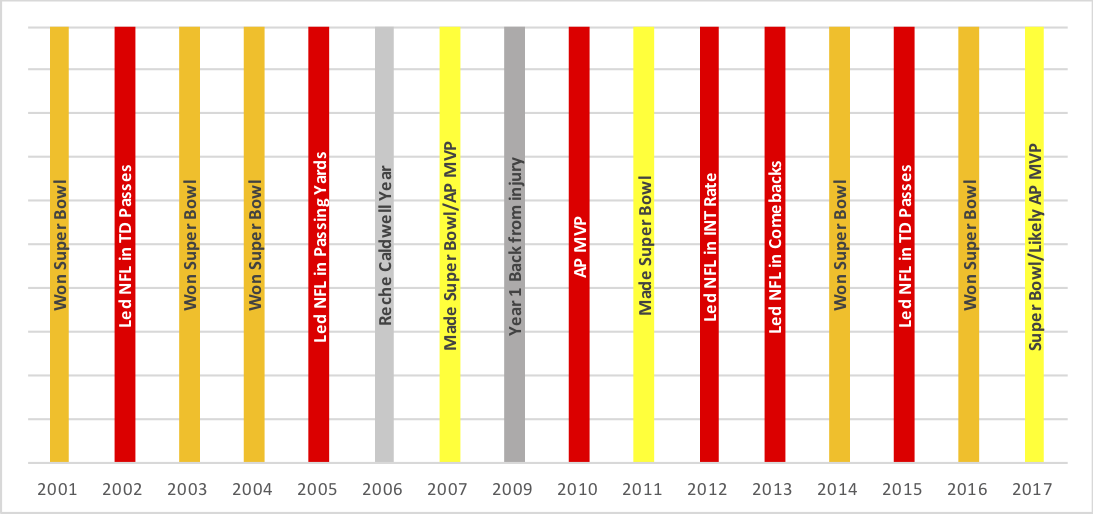
Tom Brady has had a remarkable career, and it doesn’t appear that he’s done adding to his legacy. But for now, I’d like to analyze Brady’s passing performance for each season of his Hall of Fame career.
Every season is different, and some stats do a decent job of describing a player in some years, but fail in others. Passer rating, total yards, touchdowns, and interceptions sometimes work, but can also paint very misleading pictures. But if you want to use one stat consistently, I always suggest using Adjusted Net Yards per Attempt, which is the best basic metric to measure a passer’s performance. ANY/A is simply yards per attempt with a 45-yard penalty for interceptions, a 20-yard bonus for touchdown passes, and appropriate inclusions for sacks and yardage lost on sacks. And if you want to measure ANY/A in different seasons, it’s best to compare a player’s ANY/A average to league average, to get his Relative ANY/A in each season.
I went ahead and calculated Brady’s RANY/A for each season of his career. For example, in 2007, playing with Randy Moss and Wes Welker, Brady averaged 8.88 Adjusted Net Yards per Attempt, the best of his career. The league average ANY/A that year was 5.52, giving Brady a Relative ANY/A of +3.36. Meanwhile, in 2002, a still green Brady averaged just 5.54 ANY/A when the league average ANY/A was 5.35. That gives Brady a RANY/A of +0.19, the worst of his career — which, by the way, was still above league average. Yes, Brady has been a starter for 17 seasons (all analysis today discards his ’00 and ’08 seasons, when he combined to throw 14 passes) and has had above-average passing stats in each year. Remarkable.
The graph below shows Brady’s Relative ANY/A, plotted on the Y-Axis from -4.0 to 4.0, in each season of his career. The first thing that stands out to me is how all of the data is plotted in the top half of the graph: that’s because every season is above average. The X-Axis shows season, with a gap around his injured ’08 campaign. Finally, I have plotted the graph in Patriots red and blue, but placed gold circles around his six Super Bowl-winning seasons: ’01, ’03, ’04, ’14, ’16, and ’18. [continue reading…]
Tagged as:
Patriots,
Tom Brady
{ }
by Chase Stuart
on January 29, 2019
Since the Houston Texans entered the league in 2002, the Patriots have been the best team in the NFL. By, well, a lot. You won’t be too surprised to see that New England scored the most points from ’02 to ’18, followed by the Saints, Packers, Chargers, and Colts. The other three AFC East teams ranked in the bottom 10 in points scored during this time:
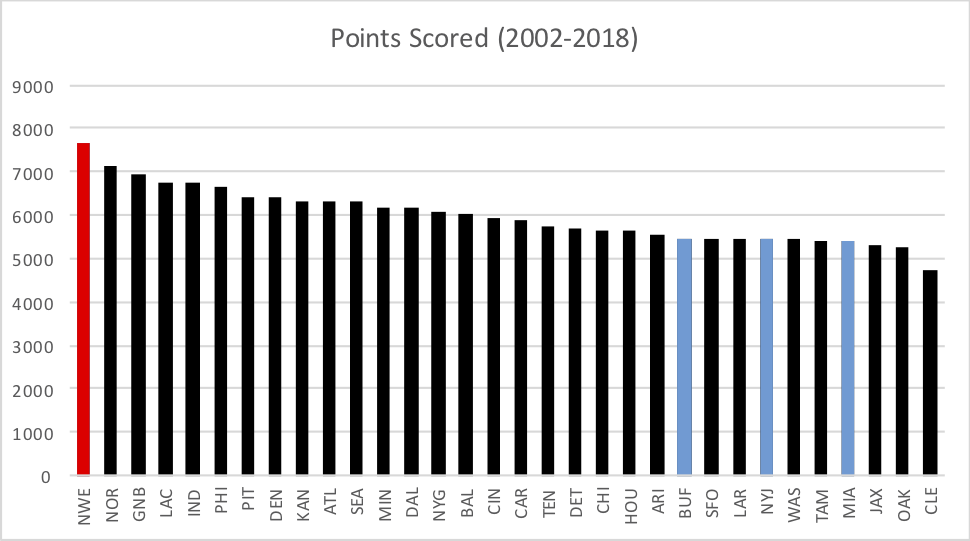 [continue reading…]
Tagged as:
Patriots
{ }
by Chase Stuart
on January 26, 2019
Yesterday, I looked at the evolving Patriots offensive line under Tom Brady in the 9 years that New England has made the Super Bowl. Today, I want to look at the team’s receiving game.
The 2001-2004 Patriots passing attack was based around six players: Troy Brown, David Patten, Deion Branch, and David Givens at wide receiver, Daniel Graham at tight end, and the always dependable Kevin Faulk as the pass-catching back. Brown was the superstar in ’01, while Graham/Givens/Branch weren’t around that year but were big parts of the ’03 and ’04 teams.
The 2007 team was a bit of an outlier, in part because New England didn’t make the Super Bowl in the two years before or the three years after. Randy Moss, Donte’ Stallworth, Jabar Gaffney, and Ben Watson only appeared in one Super Bowl for New England: Super Bowl XII. The two notable players on the ’07 Patriots and other Super Bowl teams were Kevin Faulk (who was in New England forever, and was still the team’s top receiving back in ’07) and Wes Welker, who was a star on both the ’07 and ’11 teams. [continue reading…]
Tagged as:
Patriots,
Tom Brady
{ }
by Chase Stuart
on January 25, 2019
Next Sunday, in the final game of the 2018 season, Tom Brady will be getting ready to play in his 9th Super Bowl, a number that is hard to comprehend. What’s also impressive is that various offensive linemen who have blocked for the Patriots Super Bowl teams. In Super Bowl LIII, from left to right, Trent Brown, Joe Thuney, David Andrews, Shaq Mason, and Marcus Cannon will be protecting him.
None of those offensive linemen were in the lineup four years ago when the Patriots faced the Seahawks to conclude the 2014 season.
And none of those offensive linemen were in the lineup for the 2007 Patriots team that went 16-0.
And only one of those offensive linemen — left tackle Matt Light — were on the field the first time the Patriots played the Rams in the Super Bowl. [continue reading…]
Tagged as:
Patriots,
Tom Brady
{ }
by Chase Stuart
on January 17, 2019
Let’s avoid the obvious: Yes, we know, Tom Brady and Bill Belichick are how the Patriots got here, with ‘here’ being their 8th (!!!!!!!!) consecutive AFC Championship Game appearance.
In 2014, the Patriots won the Super Bowl. A few months later, the Patriots drafted Malcom Brown with the 32nd pick, and then hit a pair of home runs in the 4th round with DE Trey Flowers and guard Shaq Mason. In fact, Flowers and Mason are two of the four players drafted in the 4th round or later of the 2015 Draft to have 24 points of career AV through four seasons (Minnesota’s Stefon Diggs and Tampa Bay’s Kwon Alexander are the other two).
Those three players are regular starters for the Patriots, and 3 of the 15 players to have more than 6 points of AV for the 2018 Patriots. Of those 15 players, 10 came through the draft, but the 2015 Class is the only draft class with more than one of those players. Four of the 15 players came from other teams, but a fifth is center David Andrews, who was an undrafted free agent signing by New England in 2015. Andrews has been the best undrafted player from 2015, which means ignoring players that went in the first three rounds, the Patriots got 3 of the best 5 players in the 2015 draft class. That’s pretty darn good.
New England players had 225 points of AV this year, and the two years where the team added the players responsible for most of that AV came in 2015 (40 points) and 2018 (41 points). Take a look: [continue reading…]
Tagged as:
Patriots
{ }
by Chase Stuart
on January 14, 2019
Two years ago, I wrote about how the Patriots under Tom Brady were on a remarkable streak. At the time, the Patriots had been favored in 33 consecutive games where Brady was the starting quarterback (during his suspension during DeflateGate, New England was a 9-point underdog against the Cardinals in a game Jimmy Garoppolo started, and a pick’em in a game against the Texans that Jacoby Brissett started; New England won both games).
Since I wrote that article, the Patriots were favored in all 19 games in 2017, and in all 17 games so far during the 2018 season. That brings the total up to an absurd 69 consecutive games that the Patriots have been favored in when Brady is the starting quarterback. And 70 games ago was Super Bowl XLIX, when the Patriots and Seahawks game was a pick’em. That means you have to go back to a game against the Packers in November 2014 to find the last time Brady took the field in a game the Patriots were underdogs.
The graph below shows every Patriots regular (in blue) and playoff (in red) game since 2010. The non-Brady games at the start of the 2015 season are shown in black circles. Since point spreads are typically displayed like “Patriots -7”, the Y-Axis shows the point spread but in reverse order (so the Patriots mostly occupy the top half of the graph). The X-Axis shows the year. [continue reading…]
Tagged as:
Patriots,
Tom Brady,
Vegas
{ }
by Chase Stuart
on January 28, 2018

The lone holdover on the last two dynasties in the NFL.
From 2001 to 2004, the Patriots won three out of four Super Bowls, which was widely considered to form a dynasty. Sure, New England missed the playoffs in ’02, but the Patriots matched the ’90s Cowboys by winning three Super Bowls in just four seasons.
Well, the Patriots have been so good since then that it’s sometimes hard to realize that the Patriots are on the verge of forming another dynasty. After all, with a win in Super Bowl LII, New England will join the ’01-’04 Patriots and the ’92-’95 Cowboys as the only teams to win three Super Bowls in four years.
Which, you know, is pretty remarkable.
Also remarkable? Just four players in this run — QB Tom Brady, safeties Devin McCourty and Patrick Chung, and tackle Nate Solder — played in at least 40% of Patriots regular season snaps in 2014, 2016, and 2017. The table below shows the percentage of offensive or defensive snaps by each player on New England in 2014, 2016, and 2017. [continue reading…]
Tagged as:
Patriots,
Super Bowl LII,
Tom Brady
{ }
by Chase Stuart
on January 21, 2018
The matchup for Super Bowl LII is set. The 13-3 New England Patriots will be facing the 13-3 Philadelphia Eagles in Minneapolis, Minnesota in two weeks.
- This is a matchup of the two #1 seeds, which is starting to become a thing again. The 1993 Bills/Cowboys was the last matchup of #1 seeds in the Super Bowl for a long time, until the 2009 Colts/Saints game. From ’94 to ’12, that was the only matchup of #1 seeds in the Super Bowl, but since then, it happened in 2013 (Seahawks over Broncos), 2014 (Patriots over Seahawks), 2015 (Broncos over Panthers) and now 2017.
- For the 8th time, Tom Brady, Bill Belichick, and the New England Patriots are going to the Super Bowl. Remarkably, Brady has made the Super Bowl in half of his 16 seasons as the Patriots starting quarterback. He will, of course, extend his own record by playing in his eighth Super Bowl: no player has made seven, while Mike Lodish and Don Beebe each made six (Lodish played in all six; Beebe played in three).
Brady has made the Super Bowl in half of his seasons as a starter; the other seasons haven’t been so bad, either:
 [continue reading…]
Tagged as:
Eagles,
Patriots,
Super Bowl,
Super Bowl LII
{ }
by Chase Stuart
on January 14, 2018

Belichick checks to see if it’s AFCCG time yet
There’s no denying that New England is the greatest regular season team in modern NFL history. From 2001 to 2017, the Patriots have had a 0.768 winning percentage in the regular season; that’s over 10% higher than the second-best team, the Steelers at 0.660.
That’s also the best winning percentage over any 17-year period in history, better than the 1946-1962 Browns (an AAFC-aided 0.756), the 1933-1949 Bears (0.749), and the 1966-1983 Raiders (0.743).
Oh, and the last 8 years? The Patriots have won 80% of their games, the best of any NFL team in any 8-year stretch (the AAFC-aided Browns posted a 0.865 winning percentage from 1946-1953). More incredibly, the Patriots are now going to their 7th-straight AFC Championship Game.
Since losing to Mark Sanchez and the Jets in the Division Round of the playoffs to end the 2010 season, the Patriots have: [continue reading…]
Tagged as:
Bill Belichick,
Patriots,
Tom Brady
{ }
by Chase Stuart
on December 31, 2017
Tom Brady made a name for himself — and won a few Super Bowls — by orchestrating a horizontal passing game for the Patriots in the early ’00s. But after acquiring Randy Moss, Brady and the Patriots offense changed completely, as he could be seen heaving footballs down the field on a regular basis.
Post-Moss, Brady reverted to a passing game that featured a lot of intermediate passes, but Brady and the Patriots look very different in 2017. And the numbers bear that out. Brady’s average pass this season, whether being completed or not, has traveled 9.09 yards in the air. That’s really high for Brady — in fact, it’s the highest for Brady since 2006, the first year that data is available (it ranks 6th among all passers in 2017). And he’s averaging 6.96 air yards per pass on throws that are completed, which also ranks 6th in 2017 and is the 2nd (behind only 2007) best number of Brady’s career. In other words, Brady is once again throwing downfield a lot. Take a look at the graph below, which shows in blue the average air yards per pass and in red the average air yards per completed pass for Brady for each year since 2006. The 2017 version of Brady is a lot different than the versions of Brady we’ve seen in recent years with a healthy Julian Edelman, who of course was lost for the season with an ACL tear in the preseason: [continue reading…]
Tagged as:
Patriots,
Rob Gronkowski,
Tom Brady
{ }
by Chase Stuart
on November 8, 2017
Today’s guest post comes from Miles Wray, a long-time reader of the site. He’s written an interesting post on special teams today, but you may know him as the host of the daily NBA podcast The 82 Review. You can also find him on Twitter @mileswray. What follows are Miles’ words: as always, we thank our guest writers for their contributions.
Bill Belichick Found Another Way to Bleed Yards From Opponents

Gostkowski, probably not kicking a touchback
Anytime the New England Patriots are at the top — or the bottom — of a league-wide leaderboard, no matter how insignificant that leaderboard is, it’s worth taking notice. The odds are that
Bill Belichick and Ernie Adams are thinking a few steps ahead of every other team in the league, and are leveraging yet another corner of the game to their advantage.
Since the Patriots offense remains incredibly explosive, it’s pretty reasonable that they would be near the top of the league in the total number of kickoffs returned (i.e., opponent kickoff returns). New England has 47 kickoffs this year, or nearly double the number of a struggling offense like the Cleveland Browns (26). But how about this: the Patriots are dramatically ahead of everybody else in the league in the percentage of their kickoffs that are returned.
Since kickoffs were moved from the 30- to the 35-yard-line in 2011, it’s more common than ever to see a kickoff boomed out the back of the endzone. These plays have become so routine it’s basically part of the commercial break now. But not for the Patriots. The Patriots seem to be inviting their opponent to return their kicks.
I went through the kickoff statistics for each team in the league, and discarded any onside kicks, any short kicks in the last 10 seconds of the first half (which are often intentionally squibbed), and any kicks where the just-scored/kicking-off team had been penalized, moving the kickoff to the 30-, 25-, or 20-yard line. The remaining “clean” kickoffs give the best indication of a team’s intentional special teams strategy over time.
This season, most teams have about a third of their kickoffs returned. Only three teams have had over half of their kickoffs returned; the Patriots are alone at over 60%: [continue reading…]
Tagged as:
Guest Posts,
Kickers,
Patriots,
Special Teams
{ }
by Chase Stuart
on February 12, 2017
In 22 team games in the 2016 playoffs, just four times did a rusher crack the 100-yard mark — or even exceed 75 rushing yards. In the Patriots three wins, their leading rusher never cracked 50 yards, and James White was three yards away in the Super Bowl from giving New England three different leading rushers in three games.
White’s Super Bowl heroics aside — you know, he scored a record 20 points and caught a record 14 passes — New England certainly didn’t get much production from the ground game in the playoffs. Even as a team, the Patriots averaged only 86.3 yards per game in the postseason. Among the 51 Super Bowl champions, that slots in just between two other Patriots teams, giving New England three of the four Super Bowl champions that failed to crack the 90 rushing yards mark in the playoffs. But one team averaged just 37 rushing yards per game in the postseason. Can you guess? Scroll to the bottom of the table to see. [continue reading…]
Tagged as:
Patriots,
Playoffs
{ }
by Chase Stuart
on January 26, 2017
Before last year’s Super Bowl, I wrote that Carolina led the NFL in points scored in a unique way. What made the Panthers scoring success so unusual? Most notably were these two facts:
- Carolina ranked only 11th in yards, the worst-ever ranking for the top-scoring team; and
- Carolina ranked only 9th in NY/A, the worst-ever ranking for the top-scoring team.
With the Patriots, you may be surprised to learn that while New England finished 1st in points allowed, the defense ranked just 16th in DVOA. There are a few explanations here:
- The Patriots faced by far the easiest schedule of any defense in the NFL. New England’s SOS was -7.1%, while Tennessee was 31st at -4.2%, and the Bills were 30th at -3.0%. The Patriots would be tied for 8th in DVOA if that metric was not adjusted for strength of schedule, which is why the defense falls to 16th with those adjustments.
- New England had just 11 turnovers, tied with the Falcons for fewest in the league. Combined with a generally good offense, and the average opponent’s drive against New England started inside the 25-yard line, the best in the league. That means the Patriots defense had a lot of turf behind them, making life much easier for the defense.
- Opposing kickers missed 8 of 29 attempts, including three from within 45 yards. In addition, the Patriots were 8th in red zone defense and 3rd in goal-to-go defense, which helps the points allowed numbers.
New England’s defense was hardly bad by traditional numbers: the Patriots ranked 8th in total yards allowed, 6th in Net Yards per pass Attempt allowed, and 3rd and 4th in yards per carry allowed and rush defense DVOA. That’s a good defense, but again, is boosted by the very easy schedule. [continue reading…]
Tagged as:
Matt Ryan,
Patriots,
Super Bowl,
Super Bowl LI
{ }
by Chase Stuart
on January 25, 2017
Can the Falcons beat the Patriots in Super Bowl LI in a shootout? On some level, the answer is of course. Atlanta was the highest-scoring team in the regular season, and the Falcons offense has been historically great. And yet, the early returns from the media on how Atlanta can beat New England tend to focus on whether the Falcons defense and pass rush can dominate the game.
That’s not surprising given the post mortem written following the Patriots two Super Bowl losses, and there is no doubt that “getting the better of Brady” has been the m.o. for most teams that have knocked New England out of the playoffs. So can Atlanta win a 35-31 style game against the Patriots?
In general, the conventional wisdom is true regarding how to beat New England: the Patriots are 19-1 when scoring over 21 points in playoff games since 2001, with the only loss coming in the classic 2006 AFC Championship Game against the Colts. But there are other exceptions. There have been 12 games in the Tom Brady era that I would classify as a shootout, which means:
- Both teams combine for 60+ points;
- The game is decided by 15 or fewer points; and
- Both teams combined for 600+ passing yards (which, surprisingly, eliminates the ’06 AFCCG)
The first of those games was Super Bowl XXXVIII against the Panthers; that game, of course, was in fact decided by the last team to have the ball, which was New England. The Patriots are “only” 8-4 in these games, though, which means there may in fact be a blueprint for the Falcons to follow. Let’s look at those losses and see if they meet the spirit of the question:
- 2009, SNF at Indianapolis: This was the “4th and 2” game, and it wouldn’t surprise anyone if the Patriots (or Falcons) employed a similarly aggressive tactic in this year’s Super Bowl. The Patriots led the 9-0 Colts 31-14 early in the 4th quarter, when Peyton Manning kicked it into overdrive. He led Indianapolis on a 5-play, 79-yard drive for a touchdown; after a Patriots punt, a Manning deep pass was intercepted. New England responded with a FG to extend the lead to 34-21, but Manning responded with another 79-yard touchdown drive. New England tried to run out the clock, but faced a 4th-and-2 with 2:08 to go at the Patriots own 28. The idea of giving Manning two minutes while trying to prevent a 6-point lead didn’t sound very good — and it wouldn’t against 2016 Matt Ryan, either — so the Patriots went for it but fell a yard short. Manning responded with a quick touchdown, and Indianapolis won, 35-34.
- 2011, week 3, at Buffalo: Yes, the “If Ryan Fitzpatrick can do it” game. Both Brady and Fitzpatrick cleared 350 passing yards, and Buffalo recorded four interceptions, one of which was a pick six. Buffalo had a 95-yard touchdown drive in the 4th quarter, and hit a field goal as time expired for a 34-31 win.
- 2012, SNF at Baltimore: Another primetime game on the road against a hated rival. This was a back-and-forth game that saw Brady and Joe Flacco combine for over 700 yard through the air. With 7:29 left in the game, Baltimore had the ball at their own 8, down by 9 points. The Ravens drove 92 yards for the score, forced a punt, and then hit the game-winning field goal as time expired to steal a 31-30 win.
- 2012, SNF vs. San Francisco: Yet another primetime game, and this one was a crazy one. The 49ers jumped out to a 31-3 lead, with Randy Moss, Delanie Walker, and Michael Crabtree all pulling in touchdowns. The Patriots then stormed back with four touchdowns to make it 31-31 in the 4th quarter, before Kaepernick hit Crabtree for another touchdown. The 49ers iced it with a field goal late, and a last-minute field goal by New England made the final score 41-34.
There are also these 12 regular season games that, for one reason or another, don’t fit the above criteria, but involved New England losing and the opponent scoring over 30 points:
Do any of those games (or the ones described in more detail above) stick out to you as the right blueprint for Atlanta? Would you say Atlanta has better odds of winning in a shootout, or in a low-scoring game?
Tagged as:
Patriots,
Super Bowl,
Super Bowl LI
{ }
by Chase Stuart
on January 28, 2016
It wasn’t shocking that Patriots running back James White played a big role in the AFC Championship Game. In my preview article at the Washington Post, I wrote that the Broncos were well-equipped to pressure Brady, which could lead to a lot of passes to his safety valve. Of course, I was thinking of a different safety valve:
But the difference-maker may wind up being Julian Edelman, who is Brady’s security blanket against the pressure. Without a pass-catching running back like a Shane Vereen (now with the Giants) or Dion Lewis (36 receptions in six games before tearing his ACL), Brady looks to Edelman as his hot receiver to understand how to get open quickly against the blitz.
As it turns out, White was only able to convert 5 of his 16 targets into receptions, for a paltry 45 yards. It’s fair to wonder if a Vereen or Lewis would have been more productive, including on deep throws (where Tom Brady went 0/5 on passes intended for White). To be fair, some of those “targets” were Targets In Name Only: they were throwaways as Brady was under pressure. But still, it turned out to be a wildly inefficient game. Pro-Football-Reference.com has target data going back to 1992, and White gained the fewest receiving yards in playoff history among the 51 players with 15+ targets in a game. [continue reading…]
Tagged as:
James White,
Patriots
{ }
by Chase Stuart
on February 8, 2015
The Patriots won Super Bowl XLIX, and whatever your thoughts on the end of the game, there’s no doubt that New England was one of the top teams in the NFL in 2014. But it’s not quite so easy to identify why, at least when looking at the traditional per-play metrics. New England ranked 17th in Net Yards per Pass Attempt and 16th in Net Yards per Pass Attempt allowed, hardly the stuff of Super Bowl champions. The Patriots didn’t stand out as particularly excellent as a rushing offense or a rushing defense, either.
But those passing statistics belie the fact that the Patriots did, in fact, have a great offense this year. Part of the issue was the slow start and a meaningless week 17 game. Beginning in week 5, and excluding the week 17 game, New England scored 487 points, a 34.8 points per game average. That matches what the team did in 2012, when the Patriots had a historically lethal offense. And it’s not too far off from even the heights reached by the ’07 team.
The Patriots passing attack ranked 5th in TD rate, 3rd in INT rate, and 4th in sack rate; as a result, they jump from 17th to 6th when moving from NY/A to ANY/A. But the Patriots were even better at pure scoring. That’s been a trend for the team: during the Tom Brady era, New England has fared better in points scored than it has in ANY/A, and fared better in ANY/A than the team has in NY/A. And New England has generally been improving in all three statistics, too.
There is one area where the 2014 Patriots stand out as special. New England had just 13 turnovers all season: 9 Brady interceptions, three Brady fumbles, and one Brandon LaFell fumble. That is tied for the third best ever, although that sounds better than it is. The record for turnovers per game is 10 turnovers per 16 games, a feat accomplished by the 2010 Patriots and then the 2011 49ers. In 2014, the Packers also committed just 13 turnovers, and the Seahawks had just 14. As you might suspect, yes, this does mean that turnover rates have declined significantly in recent history. Take a look at the following graph, which depicts turnovers per 16 games for the average NFL team since 1970. The purple line shows all turnovers; the blue and red lines are for interceptions and fumbles lost, respectively. [continue reading…]
Tagged as:
Fumbles,
Interceptions,
Patriots
{ }
by Chase Stuart
on February 7, 2015
Since 2001, New England had made the playoffs twelve times, reaching the Super Bowl, incredibly, in half of those seasons. The Patriots have won the Super bowl four times over this fourteen-year span, which made me wonder: how many Super Bowls *should* the Patriots have won?
This could be measured in a few ways. We could look at say, the team’s pre-season odds of winning it all each year. I don’t have that historical data, but we can be sure that New England significantly overachieved by that measure. We could also look at the team’s Super Bowl chances at the start of each post-season. For example, at the end of the regular season, Bovada had the Patriots at 3/1 to win the Super Bowl. That would imply a 25% chance of winning it all, although after adjusting for the vigorish, the Patriots’ true odds would have been 21.8%. I don’t have historical data of this sort, although I am sure one could use a combination of SRS and home-field advantage to come up with something similar. Hey, if you have ideas, present them in the comments.
Instead, I used the same methodology I used a couple of weeks ago to determine the randomness of each post-season. Remember, a point spread can be converted into an expected winning percentage using the following formula in Excel (if you put the point spread in cell L2): [continue reading…]
Tagged as:
Bill Belichick,
Patriots,
Tom Brady
{ }
by Chase Stuart
on January 27, 2015
This week at the New York Times, a look at the Patriots trick formations, and how New England has creatively worked around the NFL’s rules on eligible pass receivers.
In the divisional round of the N.F.L. playoffs, the New England Patriots dived deep into their playbook for a series of trick plays. What the Patriots did surprised even rule book aficionados, to say nothing of the team’s opponent, the Baltimore Ravens. It was also entirely legal, and the result of Coach Bill Belichick’s limitless ingenuity and deep understanding of the N.F.L. rules.
The N.F.L. publishes a rule book each year titled the “Official Playing Rules of the National Football League.” Rule 7, Section 5 of the 2013 edition covers eligibility. It is that section that contains one of the most basic elements of N.F.L. play, a rule so commonly adhered to that it goes unnoticed by most observers: There must be at least seven players on the line of scrimmage at the snap of each play.
Of those seven players, only the two outside players are eligible to catch a pass on a play; the inside five players on the line of scrimmage are, by definition, ineligible. But not only are the two outside players the only ones on the line of scrimmage eligible to catch a pass, those players must be eligible receivers.
You can read the full article here.
Tagged as:
Bill Belichick,
NYT,
Patriots,
Rules
{ }
by Andrew Healy
on August 13, 2014
Gronk can catch, block, and spike. But can he do all that without getting injured?
In the 2011 AFC Championship Game against the Ravens, Bernard Pollard happened to Rob Gronkowski. And the Patriots offense ground to a halt for the rest of the game before being held to just 17 points in the Super Bowl. In 2012, it was a freak injury on an extra point and then a reinjury in the divisional playoffs against the Texans. After that, the Patriots offense put up only 14 against the Ravens in the 2012 AFC Championship Game. Last year against the Browns, he took one of those horrible hits that make you cringe and want to keep him away from running seam routes in any regular season game. And the Pats put up 16 points against a mediocre and banged-up Broncos defense in the AFC Championship game.
The Gronkowski injuries provide a tantalizing set of what-ifs. The Patriots have been within two games of a title the last three years. A healthy Gronkowski could have made the difference in any of those years. The Football Outsiders’ Almanac shows that the Pats’ offense was actually pretty good late in the season without Gronk, but they were terrible early in the year―they actually had a negative DVOA without him. Over the last two regular seasons, the Pats have averaged 34 PPG with Gronkowski, but six points fewer in New England’s 14 Gronk-less games.
And as much as I believe in stats, I’m not sure we really need them to tell us that Gronkowski is one of the most important non-quarterbacks in football. If he’s healthy through the playoffs, the Patriots seem likely to be neck-and-neck with the Broncos. With a defense that may be one of the best in football, I’d argue that the Pats should be a little better than the Broncos, even. Regardless, the Pats offense has been uniformly excellent with a healthy Gronkowski since 2010. Taking just the games where Gronk played, the Pats have ranked 1st, 3rd, 1st, and 2nd in offensive DVOA over the last four years.
That means one of the most important questions in the NFL in 2014 is whether we’ll see a healthy Gronkowski through the end of the season and into the playoffs. At this point, I think the reflexive answer is to assume that the answer is “no.” It certainly doesn’t feel like he’s going to be healthy. But previous examples of players getting hurt can provide some insight into Gronkowski’s actual chances.
Recovery for Injured Young-and-Excellent Players
In his second year, Gronkowski had an Approximate Value (AV) of 14. He then played only parts of the next two seasons due to injury. Considering players who started their careers since 1970, there have been 34 who had an AV season of at least 13 in their first two years and who then did not start at least 25% of the games in the following two years. This is a reasonable list of young-and-excellent players who then missed significant time in years 3 & 4. Most of these players missed time due to injuries, although some of those cases were a bit debatable. Regardless, the conclusions are pretty much the same if we drop some of those cases. [continue reading…]
Tagged as:
Andrew Healy,
Patriots,
Rob Gronkowski
{ }
by Chase Stuart
on June 20, 2014
During the 2013 offseason, I wrote 32 articles under the RPO 2013 tag. In my Predictions in Review series, I review those preview articles with the benefit of hindsight. Previously, I reviewed the AFC West, the NFC West, the AFC South, the NFC South, the AFC North, and the NFC North. Today, the AFC East.
Buffalo Bills website complains about team’s schedule, June 24, 2013
Last summer, the Buffalo Bills website argued that the NFL schedule makers did Buffalo a big injustice by giving the team six games against teams coming off extra rest. That was the most in the league: no other team had five such games, and as it turned out, the two other teams that had 4 games against teams with extra rest were the two most disappointing teams in the NFL (Houston and Atlanta). Meanwhile, the Chiefs, 49ers, and Patriots were the only teams in 2013 not to face an opponent coming off extra rest, and all three wound up making the playoffs.
So yeah, the Bills had a legitimate gripe. But what actually happened?
- The Jets played the Patriots on Thursday night in week two, and then hosted the Bills ten days later in week three. The Jets won, 27-20.
- The Jets then got to play the Bills in week 11 after New York’s week ten bye. That wasn’t so helpful for Gang Green: the Bills crushed the Jets at home, 37-14.
- Another division opponent, Miami, got to play Buffalo after the Dolphins’ bye week. But the Bills went into Miami in week 7 and won, 23-21.
- While the Bills were beating Miami, the Saints enjoyed a bye. In week 8, Buffalo went to New Orleans and was slaughtered, 35-17.
- In week 12, the Bills were off, but the team’s week 13 opponent, Atlanta, was playing on Thursday night. So Buffalo’s game off the bye came against a team with 10 days rest. In Toronto, the Bills collapsed at the end, ultimately losing in overtime, 34-31.
- In week 14, the Jaguars played on Thursday night and won their third game in a row; in week 15, Buffalo edged the Jaguars, 27-20.
[continue reading…]
Tagged as:
Bills,
Dolphins,
Jets,
Patriots,
Predictions In Review 2013
{ }
by Chase Stuart
on January 18, 2014

These two men look important.
Someone needs to say it. I know, I know, it’s
Manning/Brady XV. But someone needs to remind people that
Peyton Manning threw 30 more touchdown passes than
Tom Brady in 2013. He threw for over 1,000 more yards. He threw one less interception. He was sacked 22 fewer times. And did I mention that he threw 30 more touchdowns? If you’re not into stats,
Brian Burke has Manning providing 5.83 extra wins this year, compared to 3.82 for Brady. At some point, the analysis should move beyond “a game between two of the greatest quarterbacks ever” and recognize these things, right?
Let’s cut off the Patriots fans before they can begin typing in Boston accents: the fact that Manning’s 2013 numbers dwarf Brady’s 2013 numbers does not mean Manning’s career >>> Brady’s career. And it doesn’t even mean (although it strongly implies) that Manning was a better quarterback in 2013 than Brady was. There’s no doubt that Denver’s supporting cast, at least on offense, is much better than New England’s. Manning has Brady’s favorite target from last year, Wes Welker, along with Demaryius Thomas, Eric Decker, and Julius Thomas. Brady has dealt with a very inexperienced set of receivers following massive turnover. The Patriots have had to replace Welker, Rob Gronkowski, Aaron Hernandez, and Danny Woodhead with Julian Edelman, 12 games worth of Danny Amendola, 8 games of Shane Vereen (although he’ll be around on Sunday), 7 games of Gronkowski (he won’t be around on Sunday), and Aaron Dobson and Kenbrell Thompkins. Each quarterback is down a star tackle (Ryan Clady, Sebastian Vollmer) but has an All-Pro caliber guard (Louis Vasquez, Logan Mankins).
But whatever the reason for the discrepancy, one conclusion is inescapable: this is not a meeting of equal passing attacks. On one hand, you have one of the greatest passing offenses ever. On the other, you have an above-average passing offense. And that’s the real story. The Broncos averaged 10 more points per game than New England, while Manning (as representative of the Denver passing attack) averaged 2.75 more adjusted net yards per attempt than Brady (as representative of the Patriots passing attack). [continue reading…]
Tagged as:
Broncos,
Patriots,
Peyton Manning,
Tom Brady
{ }
by Chase Stuart
on January 16, 2014
It’s not much of a stretch to say that the Patriots, Broncos, 49ers, and Seahawks, and are four of the best organizations in the NFL. Over the last two years, these four teams are the only to win 23 games in the regular season or 26 games if you include the playoffs. In the salary cap era, being an excellent team means managing the salary cap well. And, broadly speaking, managing the cap well means finding good values for cheap and making sure the players you spend a premium on deliver commensurate production.
So is that true for New England, Denver, San Francisco, and Seattle? The invaluable Jason Fitzgerald of Over the Cap has salary cap data for each team in the league, which can answer half the problem. But how do we measure production? I decided to use the ratings from Pro Football Focus, since the website provides a rating of every player on every team (although I excluded special teamers from my analysis today).
One note about PFF data, which comes from Nathan Jahnke, a writer at the website. As he explained to me, PFF’s ratings are not necessarily designed for comparisons across positions. For each position, zero is average, but the magnitude a player’s rating can get to is somewhat dependent on the position they play. For example, PFF has never had a safety over a grade of +30, while five 3-4 DEs hit that mark in 2013. For my purposes today, this is not a big concern — it just means view the graphs with an understand that these are not designed to be the perfect way to compare a player. But in general, I think they work well. (And, of course, don’t think that just because Brandon Mebane has a higher rating than Russell Wilson that it means PFF thinks Mebane is a more valuable player.)
To avoid people using my graphs to scrub data and steal the hard work put in by by Over The Cap and Pro Football Focus in assembling the salary cap data and player grades , I have decided not to label either axis with salary information or player ratings. Just know that the X-axis (that’s the horizontal one) is for salary, and players on the left are cheap and players on the right are expensive. The vertical or Y-axis shows the PFF grades from worst (on the bottom) to best on top). Note: to compare across teams, I have used the exact same dimensions for both axes across all four graphs. [continue reading…]
Tagged as:
49ers,
Broncos,
Patriots,
Salary Cap,
Seahawks
{ }
by Chase Stuart
on January 13, 2014
By all accounts, this was an underwhelming quartet of games played on The Best Weekend in Football. Last year, the division round gave us an incredible Russell Wilson comeback where the Seahawks scored three fourth quarter touchdowns before falling short against the Falcons and the Peyton Manning–Joe Flacco–Rahim Moore classic. Seattle won this year but in boring fashion, and Broncos fans undoubtedly prefer this year’s rendition of Neutral-Zone-Infraction to last year’s heartbreak. In 2011, the 9-7 Giants pulled off the rarest of upsets: outclassing the 15-1 Packers and winning a game as huge underdogs while managing to look like the better team in the process. The day before, Alex Smith lead the 49ers in a home upset over the Saints in one of the more exciting playoff games of our generation. In 2009 and 2010, the brash Jets won road games as heavy underdogs in convincing fashion against the Chargers and Patriots. This was the halcyon era of the Mark Sanchez–Rex Ryan Jets, also known as years 3 and 2 Before The Buttfumble. In 2008, the Ravens (over the Titans), Eagles (Giants), and Cardinals (Panthers) all won as road underdogs. The year before, the Giants shocked the Cowboys before that was our Tony Romo-adjusted expectation, and the Chargers won as 11-point underdogs in Indianapolis preventing a Tom Brady–Peyton Manning upset (no such road bump this year).
In some ways, the results this weekend were a good thing. Perhaps we will remember this as the year the division round of the playoffs felt like eating a salad – a bit unsatisfying at the time, but better for us in the long term. No one would complain about seeing more Andrew Luck — actually, maybe some of us would — but getting an AFC Championship Game of Manning and Brady just feels right. We have become so accustomed to seeing fluky teams like the Chargers make runs that we’ve forgotten that it can be very good when the results match our intuition. Back in April I said that the Patriots and Broncos were on a collision course for the AFC Championship Game, although my reasoning wasn’t exactly spot on (“the key to their success is keeping Rob Gronkowski, Aaron Hernandez, and Danny Amendola healthy, although the Patriots will be fine as long as two of them are on the field.”)
But it’s not as if I had some special insight: as noted by Will Brinson, the 49ers, Seahawks, Patriots, and Broncos were the four teams with the best preseason odds. No one would complain about seeing more from the Saints and Panthers, but I don’t think many would argue with the idea that the 49ers and Seahawks are the two most talented teams in the league. A few years from now, there won’t be much we remember from the division round. But I have a feeling it set up two conference championship games that will be very memorable. [continue reading…]
Tagged as:
49ers,
Broncos,
Chargers,
Chuck Pagano,
Colts,
Panthers,
Patriots,
Ron Rivera,
Saints,
Seahawks
{ }
by Chase Stuart
on January 10, 2014
When it comes Patriots/Colts, it’s easy to want to focus on Tom Brady vs. Andrew Luck. Or to marvel at the sheer number of star players these teams have lost in the last 12 months. If you played college in the state of Florida, you’re probably not going to be playing in this game: T.Y. Hilton is the last star standing with Vince Wilfork, Aaron Hernandez, Brandon Spikes, and Reggie Wayne gone. The Patriots also have placed Rob Gronkowski, Sebastian Vollmer, Jerod Mayo, Tommy Kelly and Adrian Wilson on injured reserve, while Devin McCourty and Alfonzo Dennard are both questionable. Also, of course, Brady is probable with a shoulder.
The Colts just put defensive starters Gregory Toler and Fili Moala on injured reserve, adding to a list that already included Wayne, Ahmad Bradshaw, Vick Ballard, Dwayne Allen, Donald Thomas, Montori Hughes, and Pat Angerer. LaRon Landry and Darrius Heyward-Bey are both questionable, and the latter’s injury caused the team to sign ex-Patriot Deion Branch.
All the injuries and changing parts make this a pretty tough game to analyze. So I’m not going to, at least not from the usual perspective. Instead, I want to take a 30,000 foot view of the game. According to Football Outsiders, the Patriots were the most consistent team in the league this season, while the Colts were the fourth least consistent team. Rivers McCown was kind enough to send me the single-game DVOA grades for both teams this season, and I’ve placed those numbers in the graph below with the Colts in light blue and the Patriots in red. The graph displays each team’s single-game DVOA score for each game this season, depicted from worst (left) to best (right). For Indianapolis, the graph spans the full chart, from the worst game (against St. Louis) to the best (against Denver). As you can see, the portion of the graph occupied by New England is much narrower, stretching from Cincinnati to Pittsburgh. [continue reading…]
Tagged as:
Andrew Luck,
Colts,
Normal Distribution,
Patriots,
Tom Brady
{ }
by Chase Stuart
on July 29, 2013
Every year at Footballguys.com, I publish an article called Rearview QB, which adjusts quarterback (and defense) fantasy numbers for strength of schedule. I’ve also done the same thing using ANY/A instead of fantasy points, and today I revive that concept for the 2012 season.
Let’s start with the basics. Adjusted Net Yards per Attempt is defined as (Passing Yards + 20 * Passing Touchdowns – 45 * Interceptions – Sack Yards Lost) divided by (Pass Attempts plus Sacks). ANY/A is my favorite explanatory passing statistic — it is very good at telling you the amount of value provided (or not provided) by a passer in a given game, season, or career.
Let’s start with some basic information. The league average ANY/A in 2012 was 5.93. Peyton Manning averaged 7.89 ANY/A last year, the highest rate in the league among the 39 passers with at least 75 attempts. Since the Broncos star had 583 pass attempts and 21 sacks in 2012, that means he was producing 1.96 ANY/A over league average on 604 dropbacks. That means Manning is credited with 1,185 Adjusted Net Yards above average, a metric I simply call “VALUE” in the table below. Manning led the league in that category, with Tom Brady, Drew Brees, Aaron Rodgers, and Matt Ryan rounding out the top five. Remember, the ANY/A and VALUE results aren’t supposed to surprise you, so it makes sense that the best quarterbacks finish near the top in this category every year.
[continue reading…]
Tagged as:
Patriots,
Rearview QB,
RPO 2013,
Tom Brady
{ }
by Chase Stuart
on June 27, 2013
On September 13, 2008, Doug Drinen wrote this post, which I reproduce in full below.
I’m hearing and reading a lot of crazy stuff this week.
So I just want to document my predictions that (a) the Patriots will win at least 11 games this year, (b) the Patriots will clinch the East before week 17, and (c) Matt Cassel will be a top-12 fantasy quarterback from here out.
That is all.

You think I'm going to lose my top 5 receivers next year? Hahaha. Ok.
With the combination arrest/release of
Aaron Hernandez stacked upon
five surgeries in seven months for
Rob Gronkowski and the departure of
Wes Welker to Denver, it’s fair to say that many are wondering about the fate of the New England passing game. In addition to those three,
Tom Brady is without
Brandon Lloyd (free agent) and
Danny Woodhead (San Diego), the
fourth and fifth leading receivers on the 2012 Patriots. As Jason Lisk pointed out, that puts Brady in
historically bad territory when it comes to roster turnover.
So today’s post doubles as a temperature check and a contest entry. Please predict the following for Tom Brady in 2013, based on the assumption that he is responsible for 99.4% of all Patriots pass attempts by quarterbacks for the second year in a row. To the extent he is not, I will pro-rate his numbers for purposes of judging the contest. To enter, simply copy and paste this table below in the comments and fill out each line.
Your name:
Brady’s number of pass attempts:
Brady’s number of passing yards:
Brady’s number of passing touchdowns:
Brady’s number of interceptions:
Brady’s number of sacks:
Brady’s number of sack yards lost:
Commentary:
[continue reading…]
Tagged as:
Aaron Hernandez,
Contests,
Patriots,
Rob Gronkowski,
Tom Brady
{ }
by Chase Stuart
on January 19, 2013

Will Lewis go out on top?
According to the SRS, this is
as lopsided as championship games get. The Patriots are 12.8 points better than average while the Ravens have an SRS of just +2.9; therefore, you’d put New England as 13-point favorites at home (in reality, they are 8-point favorites). I’ve been a Ravens skeptic for a couple of months now, and never thought they were one of the best teams in the league.
In my week 11 power rankings, when Baltimore was 8-2, I wrote: “According to Football Outsiders, Baltimore has the best special teams since 1991 through 10 weeks. Schatz tweeted that Baltimore’s the 16th best team based on just offense and defense.”
A few days later the Ravens defeated the Chargers in the famous 4th-and-29 game, which certainly didn’t change my outlook on Baltimore. Then the Ravens tanked down the stretch, seemingly fulfilling their reputation as an average team. And let’s not forget: had Ben Roethlisberger stayed healthy, it’s possible the Ravens don’t even make the playoffs. Without the 13-10 ugly win over Byron Leftwich and the Steelers, both Baltimore and Pittsburgh would have finished 9-7 with the Steelers holding the tiebreaker. To be fair, the Ravens did not compete in a meaningless week 17 game, but the point is that the Ravens were barely above-average team during the season that got a few breaks along the way.
[continue reading…]
Tagged as:
Joe Flacco,
Patriots,
Playoffs,
Ravens,
Ray Lewis,
Tom Brady,
Torrey Smith
{ }
by Chase Stuart
on January 13, 2013
Yesterday, I previewed Saturday’s games with um, mixed results (skip the Denver-Baltimore preview and just read the San Francisco-Green Bay breakdown twice). Let’s take another crack at it by examining Sunday’s matchups.
Seattle Seahawks (11-5) (+1) at Atlanta Falcons (13-3), Sunday, 1:00PM ET

Did you know Marshawn Lynch eats Skittles?
Once again, Atlanta is tasked with facing a
dominant wildcard team. Is this the year
Matt Ryan finally
silences his critics?
Atlanta is only a one-point favorite, just the seventh time a home team has been given such little respect this late in the season since 2000. Home teams are 3-3 when underdogs or small favorites over that span in the divisional conference championship rounds, although one of those losses came by the Falcons in 2010 against the Packers when Atlanta was a 1.5-point favorite. But let’s focus on these two teams, because the stats might surprise you.
Russell Wilson edges Matt Ryan in Y/A (7.9 to 7.7), AY/A (8.1 to 7.7), and passer rating (100.0 to 99.1), despite having a significantly worse set of receivers. Ryan does have the edge in NY/A (7.0 to 6.8) but the two are deadlocked in ANY/A at 7.0. Both quarterbacks led four 4th quarter comebacks this year, and Wilson led 5 game-winning drives while Ryan led six. Considering one quarterback has Roddy White, Julio Jones, and Tony Gonzalez, and the other is a 5’10 rookie, I consider this pretty remarkable.
[continue reading…]
Tagged as:
Arian Foster,
Falcons,
J.J. Watt,
Matt Ryan,
Matt Schaub,
Patriots,
Playoffs,
Russell Wilson,
Seahawks,
Texans,
Tom Brady
{ }