The New York Giants have a very top-heavy salary cap structure. The team’s top five 2019 salary cap hits belong to Eli Manning, Nate Solder, Janoris Jenkins, Alec Ogletree, and Kevin Zeitler, and total a whopping $76.7 million. Meanwhile, the Giants players with the 6th through 51st largest cap hits total just $71.5 million. That’s absurdly top-heavy (and comes after moving on from Damon Harrison, Olivier Vernon and Odell Beckham over the last few months). The Giants organization has really embraced a “star and duds” approach.
Consider the Buffalo Bills, whose top-5 largest 2019 cap hits belong to Star Lotulelei, Mitch Morse, Jerry Hughes, LeSean McCoy, and Trent Murphy and total $50.6M. The rest of the top 51 salary cap hits on the roster total $107.5M. The Bills do not have a single player with a 2019 salary cap hit of $11.8M or greater; meanwhile, every other team in the NFL has at least two such players.
The Giants and Bills are at the extreme ends of salary cap/roster construction. One way to measure how concentrated (or not concentrated) a team’s salary cap is by using the Concentration Index, described here. In short, we do the following steps:
1) Calculate the 2019 salary cap hit of the top 51 players on each team’s roster. Thanks to Over The Cap, I was able to collect this information.
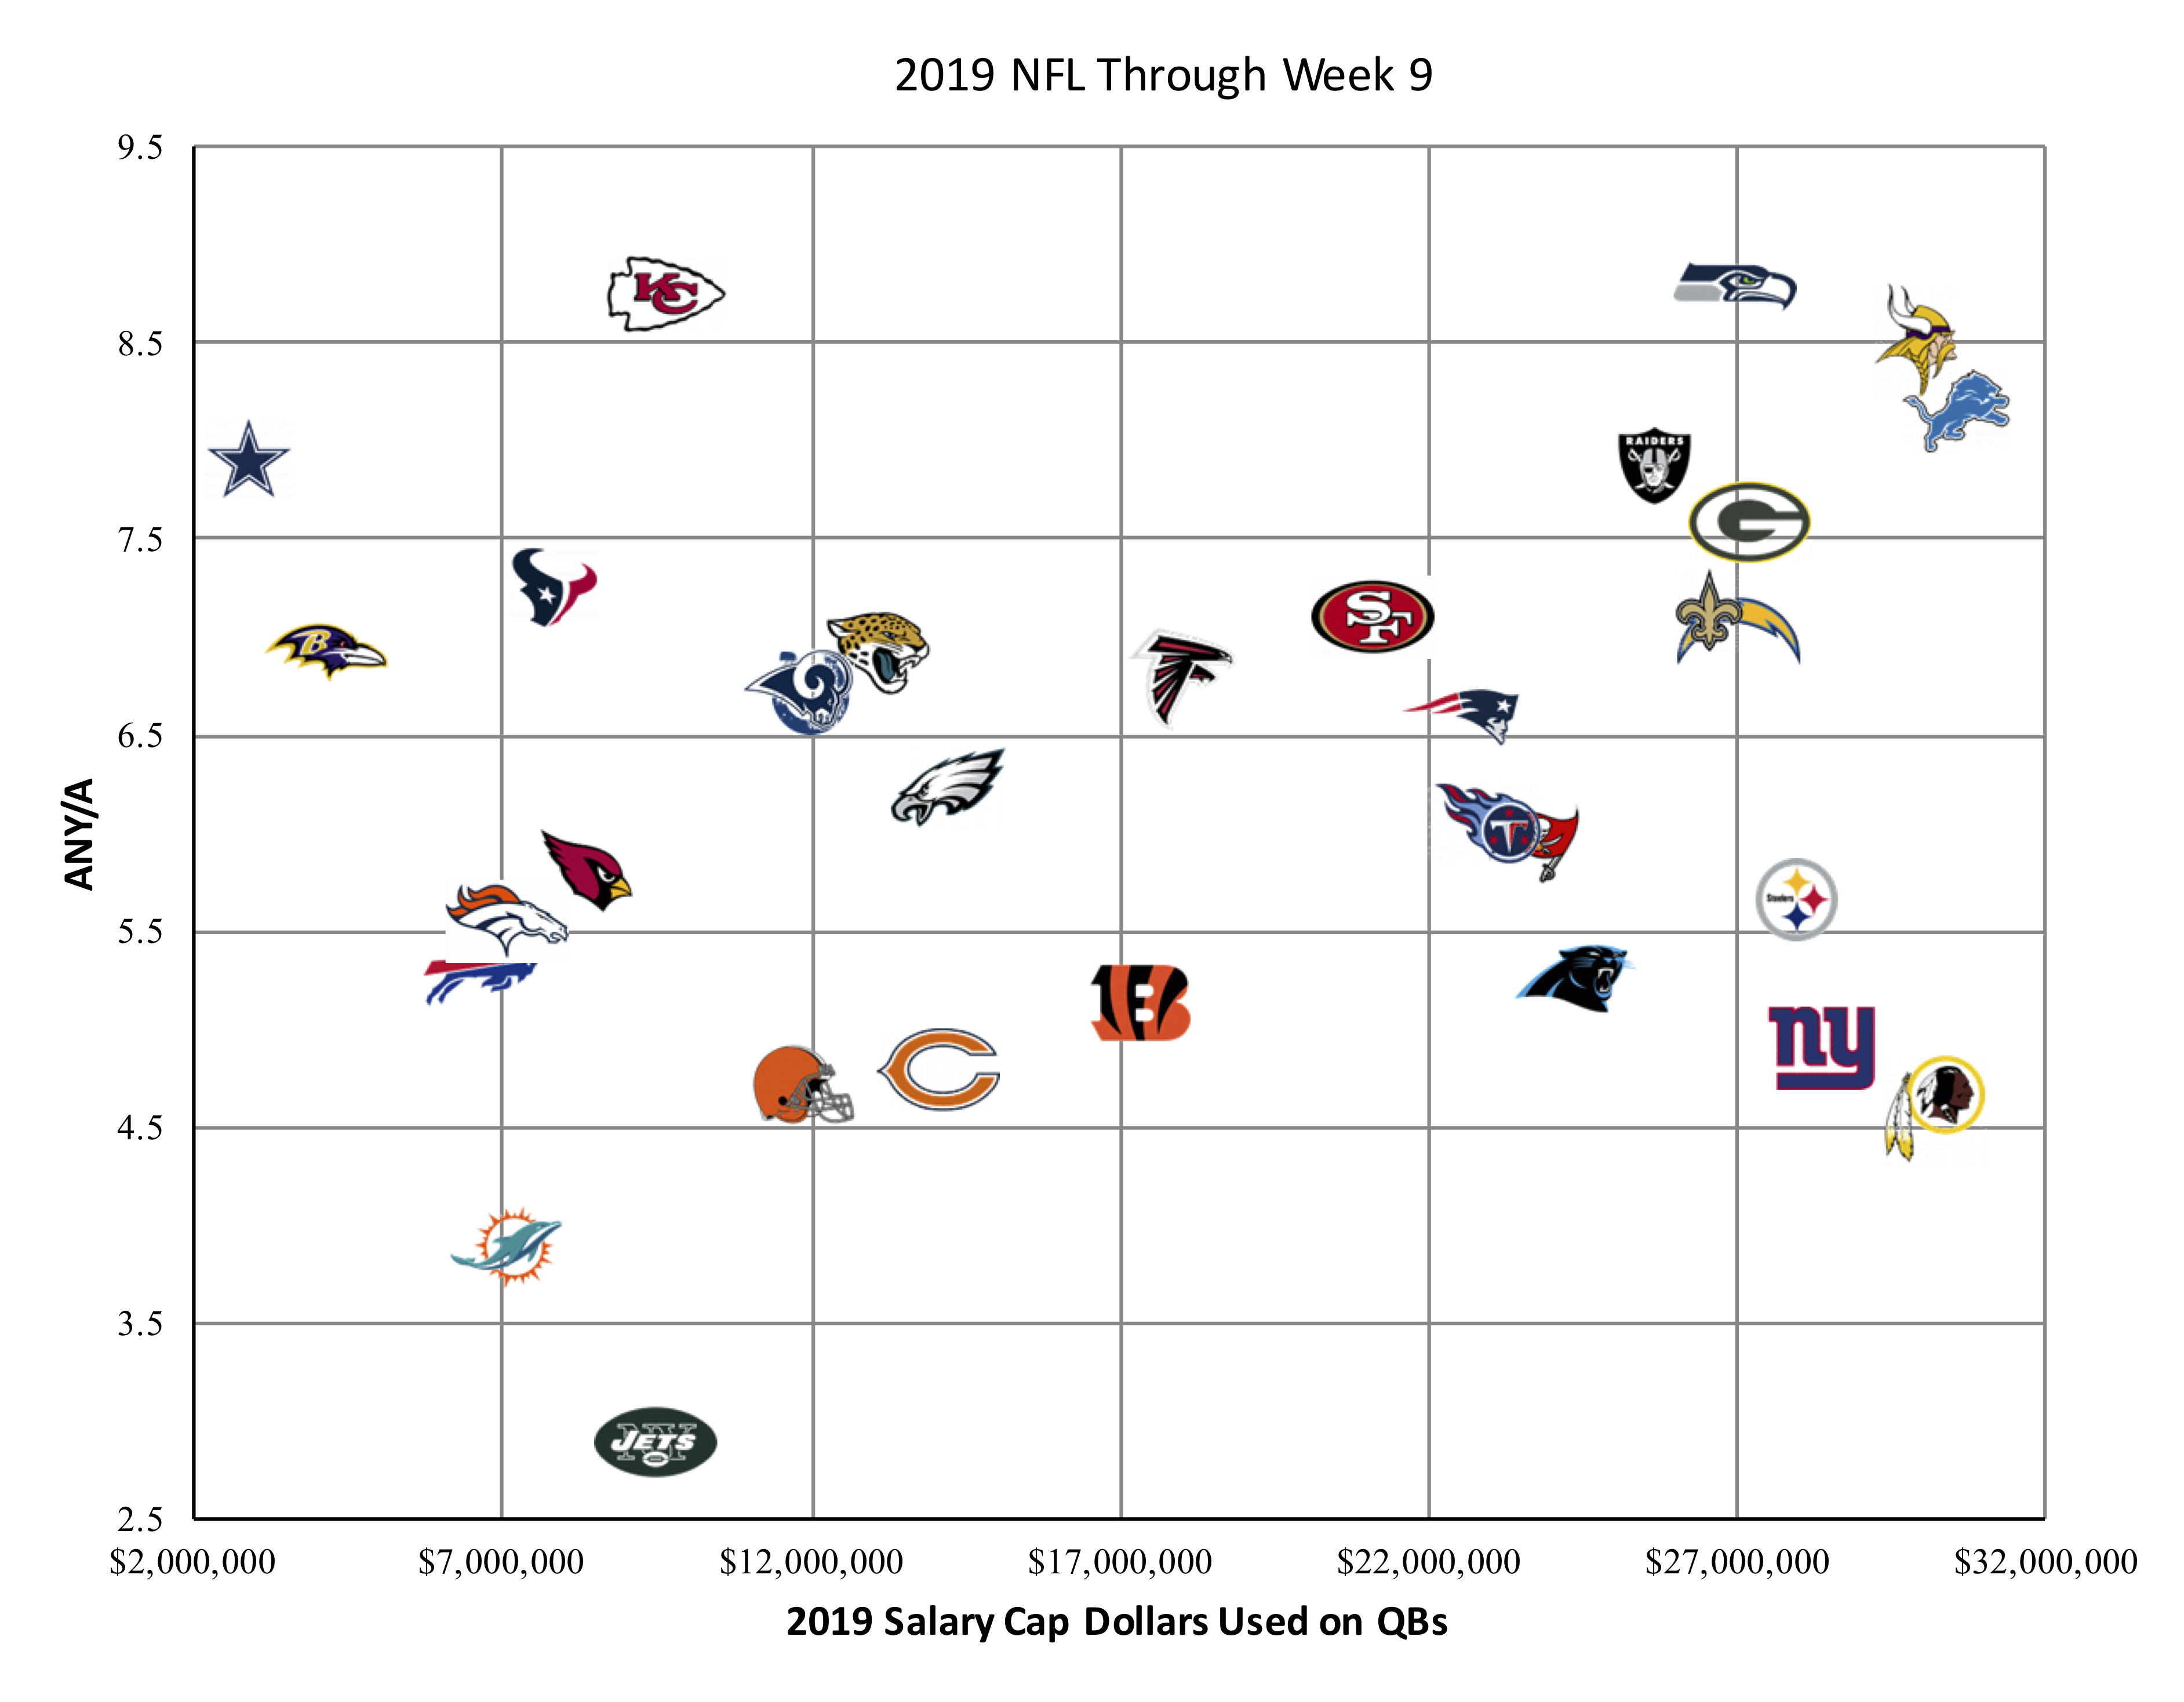
2) For each player on each team, calculate the percentage of team salary cap dollars spent on that player. For example, Kirk Cousins of the Vikings has a 2019 cap hit of $29M, and the Vikings top 51 players have a cap hit of $184M. Therefore, Cousins is taking up 15.8% of Minnesota’s 2019 cap spend.
3) Square the result for each player (so Cousins’s 15.8% becomes 2.5%), and then sum those results for each player on each team to get team grades.
By squaring the results, you give more weight to players taking up a larger percentage of their team’s pie. Matthew Stafford ($29.5M cap charge) has both the highest 2019 Cap charge in the league and since the Lions top 51 players only have cap hits totaling $160M, has the highest percentage of team cap charge at 18.4%. When you square that result, you get 3.4%. Meanwhile, for Buffalo, Lotulelei’s $11.5M charge represents 7.3% of Buffalo’s top 51 largest cap hits, and then drops to just 0.5% when you square the result.
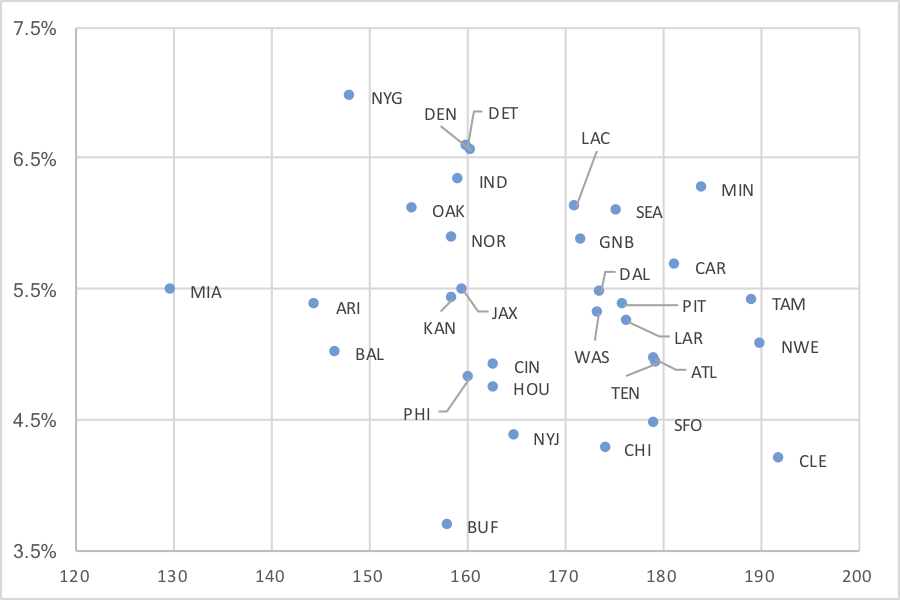
When you sum those squared results for each team, the Giants stand out as the team with the largest concentration of salary cap dollars in the fewest players, at 7.0%. Meanwhile, the Bills have dispersed their salary cap dollars in the widest manner, at just 3.7%.
Another interesting team is Cleveland. The Browns are similar to Buffalo, and have spread their salary cap dollars around: their concentration index is just 4.2%, the second lowest in the league. But Cleveland also has spent the most 2019 salary cap dollars on its top 51 players, at a whopping $192M! Think about what that means: the Browns are paying a ton of money to their players in the aggregate, but spreading it around a lot. That must mean that Cleveland is paying a lot of people good money, and well, that’s exactly what’s happening. The Browns are paying 14 players at least $6.6M in 2019 cap dollars. No other team has more than 11 such players.
The graph below shows the results of today’s post. The X-Axis shows the 2019 salary cap dollars each team has spent on its top 51 players (no dead money is included). The Y-Axis shows the concentration index for each team for these 51 players. As you can see, the Giants (highly concentrated) are at the top of the chart, the Bills are at the bottom, the Browns are at the far right (lots of $$ spent), and the Dolphins (little $$ spent) are at the far left.
 [continue reading…]