≡ Menu

Throughout NFL history, having a strong running offense and a dominant pass defense has been a recipe for success. But the 2022 Eagles are currently doing something that hasn’t been done in 40 or 45 years, depending on your view of the 1982 strike season. Through 13 games, the Eagles have one of the top running games in the NFL. Powered by quarterback Jalen Hurts and running back Miles Sanders, Philadelphia is tied for 2nd in the NFL in rushing yards and leads the NFL in rushing first downs. The Eagles are also averaging 4.87 yards per carry, good enough for 5th best. Meanwhile, Philadelphia’s pass defense has been phenomenal. Even ignoring the NFL-best 15 interceptions (and NFL-best 3.4% interception rate), Eagles opponents are averaging just 4.80 net yards per pass attempt, the top rate in the league.

Yes, that means the Eagles gain more yards per rush than their opponents average per pass. Which is pretty ridiculous!

It’s not unusual for teams to come pretty close here: the Buffalo Bills nearly pulled this one off last season with very similar numbers. Buffalo averaged 4.79 yards per carry and allowed 4.84 net yards per attempt in 2021. [continue reading…]

{ 6 comments }

The Final Score Is: 20-17

October 5th, 1924 was not the most exciting day in pro football history. The Cardinals defeated the Packers 3-0 in a game that was representative of things to come. Elsewhere, the Duluth Kelleys beat the Minneapolis Marines 3-0, the Akron Pros won in Rochester against the Jeffersons by a 3-0 score, and the Milwaukee Badgers hosted and defeated the Kansas City Blues by the score of — you guessed it — three to zero. It was the only time in NFL history that four games all finished with the same score on the same day. [continue reading…]

{ 0 comments }

Football in the Northeast is Back

The New England Patriots, New York Giants, New York Giants and Philadelphia Eagles are undeniably in the northeast. I think most would include the Buffalo Bills are as well, although they do play in western New York. The state of Pennsylvania is commonly included in the northeast, but I don’t think it’s reasonable to include Pittsburgh, on the western border, in as a team in the northeast. The Baltimore Ravens are only 100 miles away from Philadelphia, but they are also only 40 miles from Washington, D.C., and no sensible definition of “Northeast” should include the nation’s capital.

So I’m going to stick with the NE-NYG-NYJ-PHI-BUF pairing as the definition of Northeast football. And only two years ago, it looked really bad: [continue reading…]

{ 1 comment }

Third Down Performance: How Much Is A 3rd Down Worth?

From 2002 to 2021, NFL teams converted 38.9% of all third down attempts. Third down performance is really meaningful when it comes to winning games, but it can also be pretty random from sample to sample. So as a result, third down performance has an outsized performance on who wins and loses that game, but is probably not all that predictable as to who will win the next game.

I thought it would be interesting to look at this in the context of the pre-game point spread. Let’s start with a few basic numbers, looking at this 20-year period.

  • Teams that were favored by 1 to 5.5 points won 58.7% of their games.
  • Teams that were favored by 6 to 8 points won 73.6% of their games.
  • Teams that were favored by more than 8 points won 83.4% of their games.

But let’s say you know that the favorite would lose the third down battle. How does that change things?

  • Teams that were favored by 1 to 5.5 points but were worse on third downs won only 43.4% of their games.
  • Teams that were favored by 6 to 8 points but were worse on third downs won only 54.2% of their games.
  • Teams that were favored by more than 8 points but were worse on third downs won 68.2% of their games.

Now, saying an underdog just needs to win the third down battle is not very helpful, and only a little more precise (and about as useless) as saying they just need to score more points. But it does help to provide some guardrails about the magnitude of third down performance. It can flip a big favorite into a coin flip, and a huge favorite suddenly has a real chance of losing.

Can we quantify exactly how important third down success is? I’m glad you asked. As we know, each team has a 38.9% chance of converting an average third down. Suppose each team has 15 third down attempts in the game. Let’s say one team coverts 10 of 15, while the other only converts five opportunities. The expected number of third down conversions for both teams is 5.8 (0.389 multiplied by 15), so one team converted 4.2 more first downs than expected, while the other converted 0.8 fewer than expected. The net difference, of course, is five conversions — let’s call that the net third downs added. [continue reading…]

{ 3 comments }

The Minnesota Vikings have played a lot of close games this season.  In fact, all but one of their games was decided by 8 or fewer points, and the average margin of victory — regardless of who won the game — has been just 5.15 points.

Results Table
Points
Rk Tm Year Date Time LTime Opp Week G# Day Result OT PF PA PD PC
1 MIN 2021 2021-09-26 4:25 2:25 SEA 3 3 Sun W 30-17 30 17 13 47
2 MIN 2021 2021-12-09 8:20 6:20 PIT 14 13 Thu W 36-28 36 28 8 64
3 MIN 2021 2021-11-14 4:05 1:05 @ LAC 10 9 Sun W 27-20 27 20 7 47
4 MIN 2021 2021-10-17 1:00 1:00 @ CAR 6 6 Sun W 34-28 OT 34 28 6 62
5 MIN 2021 2021-11-21 1:00 11:00 GNB 11 10 Sun W 34-31 34 31 3 65
6 MIN 2021 2021-10-10 1:00 11:00 DET 5 5 Sun W 19-17 19 17 2 36
7 MIN 2021 2021-09-19 4:05 2:05 @ ARI 2 2 Sun L 33-34 33 34 -1 67
8 MIN 2021 2021-12-05 1:00 1:00 @ DET 13 12 Sun L 27-29 27 29 -2 56
9 MIN 2021 2021-09-12 1:00 1:00 @ CIN 1 1 Sun L 24-27 OT 24 27 -3 51
10 MIN 2021 2021-11-07 1:00 1:00 @ BAL 9 8 Sun L 31-34 OT 31 34 -3 65
11 MIN 2021 2021-10-31 8:20 6:20 DAL 8 7 Sun L 16-20 16 20 -4 36
12 MIN 2021 2021-10-03 1:00 11:00 CLE 4 4 Sun L 7-14 7 14 -7 21
13 MIN 2021 2021-11-28 4:25 1:25 @ SFO 12 11 Sun L 26-34 26 34 -8 60

[continue reading…]

{ 0 comments }

The 2021 NFL Schedule

Every year, I publish a color-coded version of the NFL schedule the night it is released. Tonight is that night.

Download the Excel file here. [continue reading…]

{ 1 comment }

Once Again, A Team Overpays For The #3 Pick

It was just three years ago that the New York Jets decided they absolutely needed to trade into the top 3 of the 2018 NFL Draft. The decision was bad at the time and looks worse in hindsight: not only did New York whiff by drafting Sam Darnold, one of the biggest draft busts in recent history, but the Jets could have taken either Josh Allen or Lamar Jackson with the team’s original pick.

The package that New York sent to Indianapolis for the 3rd pick was massive: New York sent the 6th overall pick (Quenton Nelson), along with the 37th (Braden Smith) and 49th (Dallas Goedert) picks, plus a 2019 2nd round pick (34th overall, Rock Ya-Sin) for the rights to acquire whoever would be there at three. The Jets got “lucky” in that Darnold, for much of the pre-draft process considered the presumptive first overall pick, was even available to them at three. As I wrote at the time, the Jets chose the rights to the third quarterback [1]Which, after the Giants drafted Saquon Barkley, turned into the second available quarterback. available in the draft over getting Lamar Jackson plus four second round picks. It has worked out to such a poor degree that the Jets are one month away from using the #2 overall pick that the Darnold-led Jets very much earned on Darnold’s successor.

Well, the 49ers decided what was bad for the Jets would be good for them. Because San Francisco decided to acquire Miami’s 3rd overall pick in the 2021 NFL Draft — ostensibly the right to select the third quarterback in the draft after the Jaguars and Jets have their picks — for a similarly enormous haul. San Francisco sent the 12th overall selection, along with its 1st and 3rd round picks in 2022, and its first round pick in 2023 in exchange for that third overall selection.

Can we calculate just how much the 49ers overpaid for the rights to the third pick? Under my draft value chart, the 3rd pick is worth 27.6 points while the 12th pick is worth 18.8 points; of course, those are just average values, and the 49ers feel like the dropoff in quality between a quarterback available at 3 and a quarterback available at 12 is enormous.

Let’s assume that the 49ers two first round picks will be average; pick 16 is valued at 16.9 points. If we assume a 10% discount rate on future picks for each season, that puts those two picks at 15.2 and 13.5 points, respectively. The 49ers are also sending a 2022 3rd round pick which is a comp pick (in this case, compensation for the Jets hiring Robert Saleh as head coach); that pick should be right around pick 100, worth 5.3 points. Apply a 10% discount, and we get 4.8 points.

So the 49ers gave up draft picks worth 18.8, 15.2, 13.5, and 4.8 points, for a total of 52.3 points. That is, obviously, a significant package, equivalent to the first overall pick in the draft plus another top-15 pick. To move up from 12 to 3, the 49ers gave up more than the Jets did when they moved up from 6 to 3; the Jets overall sent more total value to draft Darnold than San Francisco did to draft QB3 this year, but overall, the teams are pretty similar: [continue reading…]

References

References
1 Which, after the Giants drafted Saquon Barkley, turned into the second available quarterback.
{ 0 comments }

The 2020 Atlanta Falcons starting offensive linemen were all former first round picks. Atlanta drafted right guard Chris Lindstrom and right tackle Kaleb McGary in the first round of the 2019 Draft, five years after using the 6th overall pick on Texas A&M left tackle Jake Matthews. In 2016, Atlanta signed center Alex Mack, the 21st pick in the 2009 Draft, away from the Browns to a monster deal; he’s been the center of the team’s offensive line ever since. And in the 2019 offseason, the left guard spot was pugged by James Carpenter, who had been a first round pick out of Alabama and then played four seasons each with the Seahawks and Jets.

It should go without saying that that is a lot of highly drafted offensive linemen for one team, even if Atlanta only drafted three of the players. [1]The Falcons also had five first round picks on offense outside of the offensive line: the Falcons drafted QB Matt Ryan, WR Julio Jones, and WR Calvin Ridley in the first round, too, and added former … Continue reading Let’s compare them to the Green Bay Packers, who had arguably the best offensive line in the NFL and trotted out the following starting five:

The Packers had one of the least heralded group of offensive linemen in the league — at least from a draft perspective (in other news, the entire left side of the line made the Pro Bowl). How does that compare to the rest of the NFL? [continue reading…]

References

References
1 The Falcons also had five first round picks on offense outside of the offensive line: the Falcons drafted QB Matt Ryan, WR Julio Jones, and WR Calvin Ridley in the first round, too, and added former first round picks at RB (Todd Gurley) and TE (Hayden Hurst) in the 2020 offseason. Slot receiver Russell Gage, a sixth round pick out of LSU, was the 11th starter, and presumably teased mercilessly in the huddle.
{ 0 comments }

Guest Post: Quarterback Performance vs. Playoff Wins

Adam Steele is back for another guest post. You can view all of Adam’s posts here. As always, we thank him for contributing.


With the 2020 NFL playoffs having just concluded, now seems like a great time to tackle a question I’ve had for years: How strongly does quarterback performance correlate with team success in the postseason?

First, we need to measure quarterback performance. I graded each playoff start on a 0-4 scale, with zero being terrible and four being dominant. I chose this because it matches the academic GPA scale we’re all familiar with. The grade is based on performance while adjusting for era, opponent, weather, and other contextual factors.

Now you may be wondering why I don’t just use stats to grade games. Well, for the tiny sample of a single game stats can be very misleading, especially given the opponent and weather extremes we tend to see in the playoffs. I also prefer a rough instrument for this study so parsing all games into five buckets is ideal.

I included all quarterbacks with six or more playoff starts, giving us a sample of 69 players and 745 graded games. We’ll look at individual quarterbacks later, but for now let’s evaluate the big picture: [continue reading…]

{ 0 comments }

In 2020, Derrick Henry had a monster season, rushing for 2,027 yards. In an era where the game continues to shift more to passing every year, Henry’s effort was truly remarkable. It’s also interesting that Buffalo WR Stefon Diggs led the NFL with 1,535 receiving yards.

That made 2020 a bit unusual: in recent seasons, the player with the most receiving yards tends to have a higher number than the player with the most rushing yards. That’s a reversal of how things used to be. The graph below shows the NFL’s rushing and receiving king in each season, and how many rushing or receiving yards they gained. For non-16 game seasons, the numbers were pro-rated to a 16-game era. [continue reading…]

{ 0 comments }

The 2017-2020 Saints Came Up Just Short

The Saints have been defined by Sean Payton and Drew Brees for 15 years. And because of that, we tend to think about the Saints as a team that won a Super Bowl — even if the New Orleans championship team was over a decade ago.

The current Saints team — with offensive stars like Alvin Kamara and Michael Thomas, and a host of talented defensive players (Demario DavisCameron Jordan, Marcus Williams and Marshon Lattimore, among others) — has not tasted championship success despite a remarkable amount of regular season success. In fact, they haven’t even made the Super Bowl. And with Brees now retiring, it looks like the curtain will close on what is easily the best four-year run in New Orleans regular season history.

Over the last four years, New Orleans has the most wins of any team (49), scored the second-most points behind Kansas City, and allowed the fifth fewest points.

Such great regular season success often results in a championship or two, and almost always results in a Super Bowl appearance. The Saints have a 0.766 winning percentage over the last four seasons, making them just the 4th franchise in the Super Bowl era to have such a high level of regular season success without making it to a Super Bowl.

The Dallas Cowboys from 1966 to 1969 had a similar streak of disappointing endings. In ’66, Dallas went 10-3-1 with the best offense in football; they lost to the Lombardi Packers in the NFL title game, the first time such game was the precursor to the Super Bowl. In ’67, Dallas went 9-5 but lost to the Packers in the Ice Bowl, again on the doorstep of the Super Bowl. In 1968, Dallas went 12-2, beating the Browns easily in the regular season but losing to them in the playoffs.

Don Meredith had led Dallas to a 27-9-1 mark from ’66 to ’68, but was embarrassed by Cleveland in the ’68 postseason, going 3 for 9 for 42 yards with three interceptions before being benched. At 31 years old, Meredith retired after the season. Enter Craig Morton, who led the ’69 Cowboys to an 11-2-1 mark in 1969… before the team again saw their season end at the hands of the Browns. Four seasons, a 0.768 winning percentage, and no Super Bowl appearances. The next year, Morton (with some help from Roger Staubach) and Dallas went 10-4 and finally reached it to the title game… before losing to the Colts. The year after, in 1971, Staubach helped Dallas finally reach the mountain top, winning Super Bowl VI.

The Oakland Raiders had a similar rough stretch from ’72 to ’75. In 1972, under Daryle Lamonica, the Raiders went 10-3-1 and ended the year on a 6-game winning streak. In the playoffs, it took the Immaculate Reception to defeat Oakland. In 1973, Ken Stabler became the starter, and while the Raiders would go 9-4-1 and avenge the playoff loss to Pittsburgh in the ’73 postseason, Oakland would still come up short against the defending Super Bowl champion Dolphins, who would repeat in ’73. In 1974 the Raiders went 12-2 and led the NFL in scoring; they would get their revenge against Miami in a memorable way in the playoffs, but once again were bested by the Steelers in the postseason. In 1975, Oakland had another great regular season that ended in a third straight loss in the AFC Championship Game, again to the Steelers. Over that 4-year run, the Raiders had a 0.768 winning percentage, but no Super Bowl appearances. Finally, in year five, Oakland would go 13-1, beat a depleted Steelers team in the playoffs, and then make — and win — their first Super Bowl.

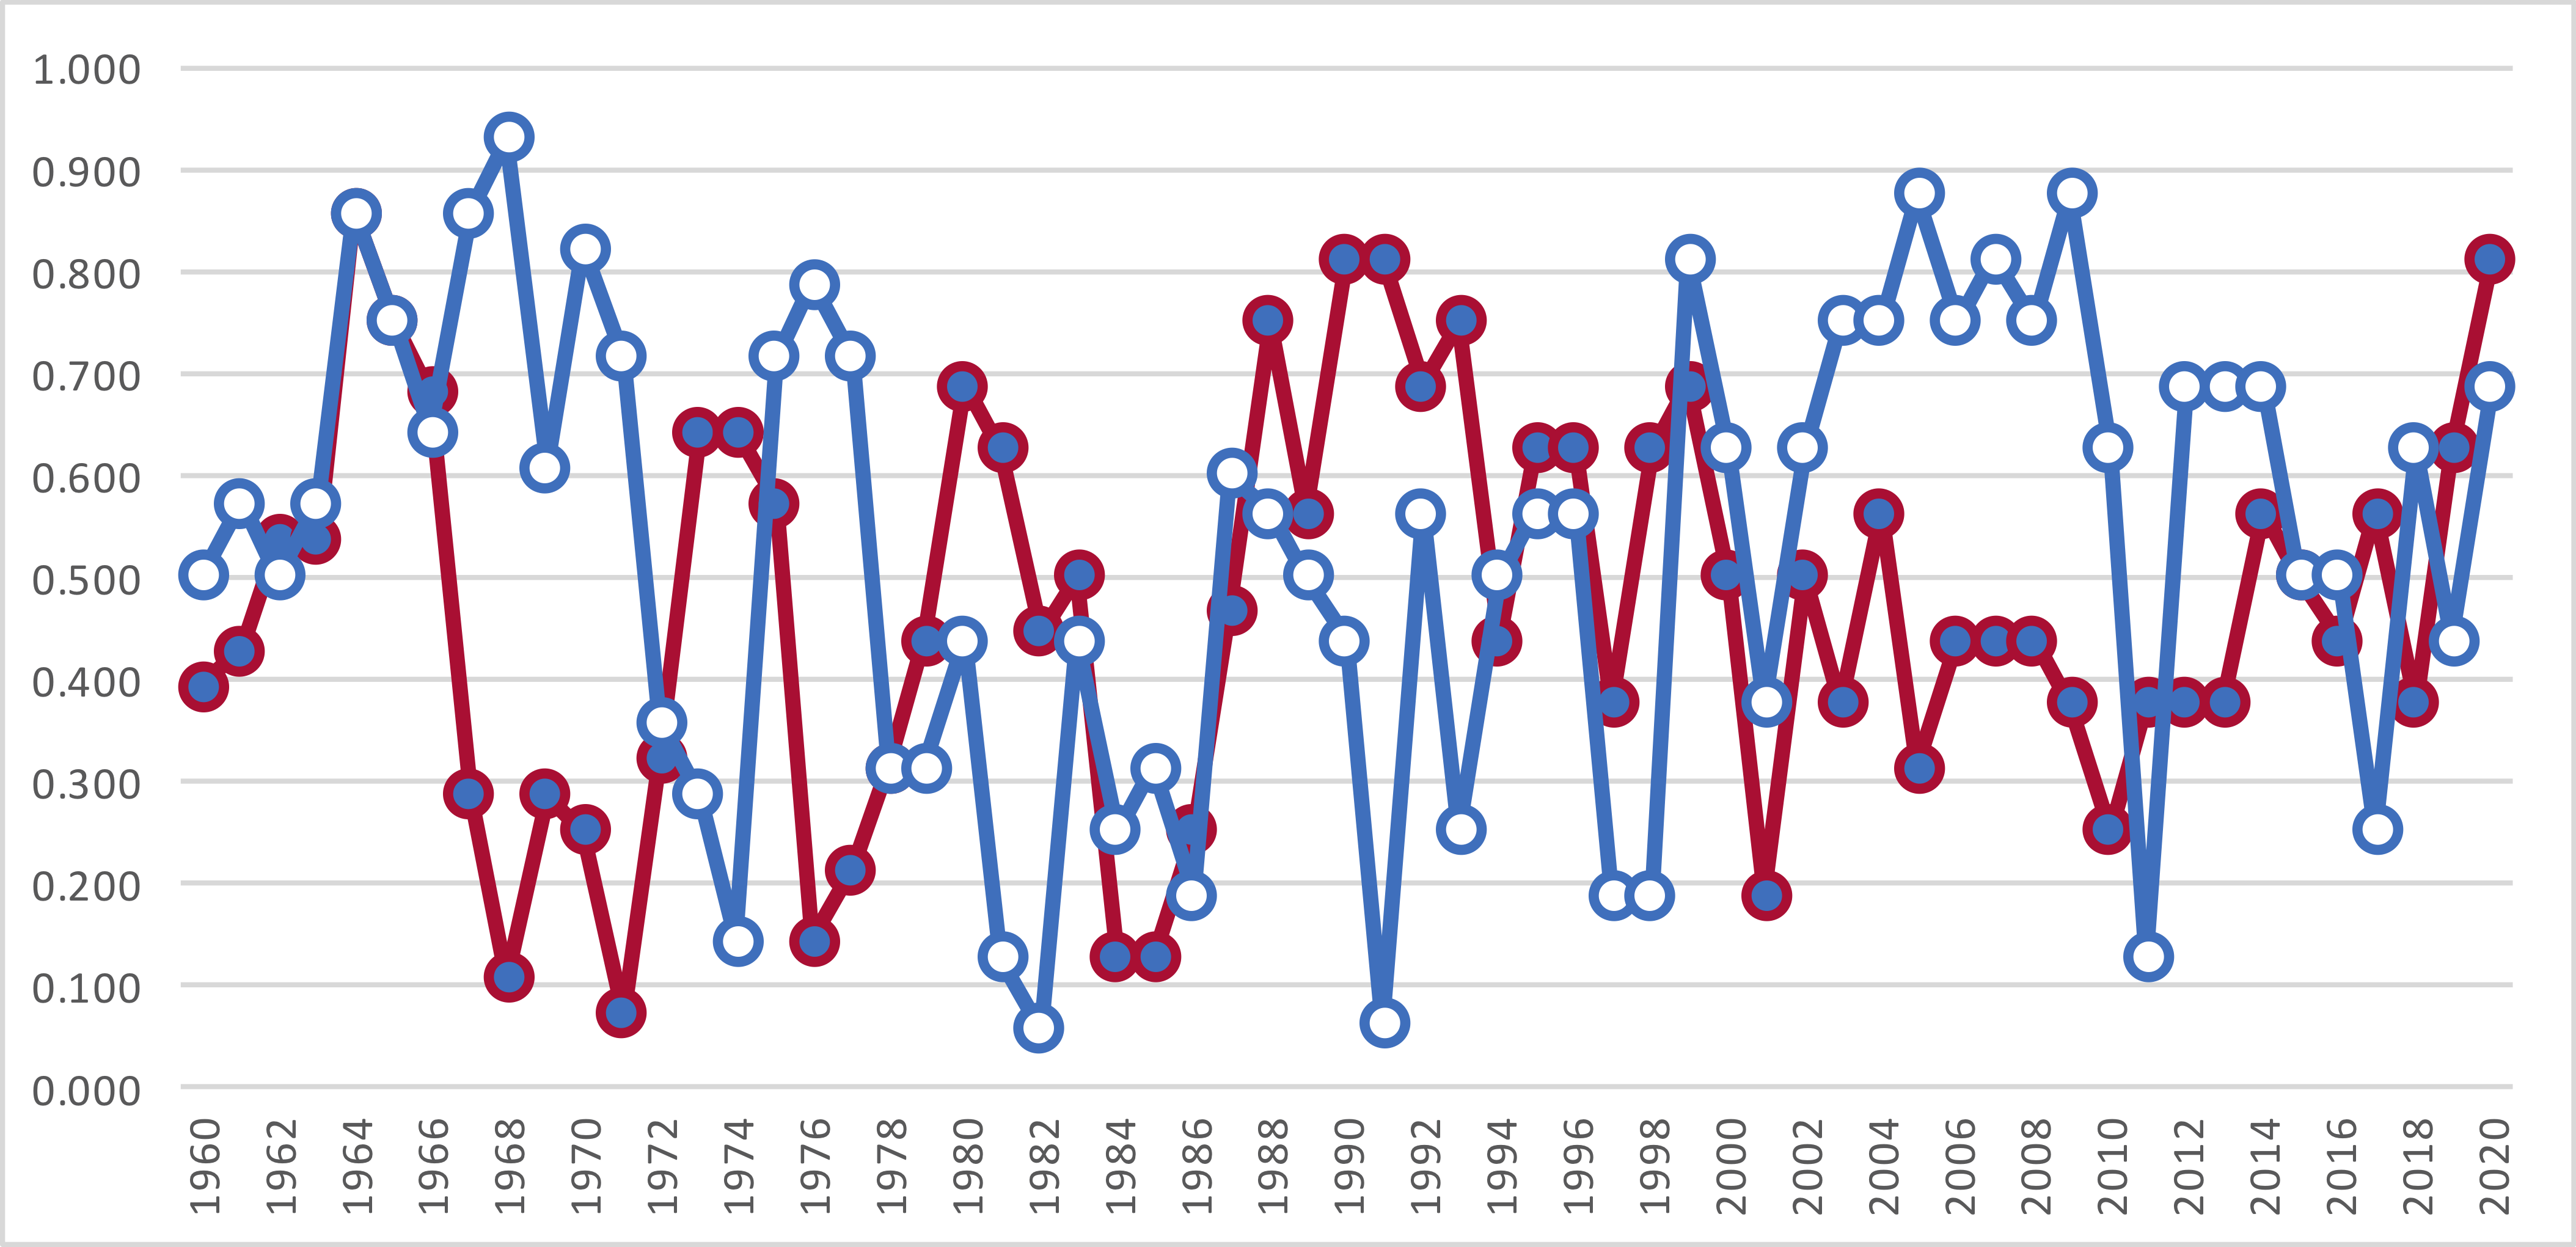
The last franchise to discuss had a much longer run of frustration and did not ever result in redemption. The Los Angeles Rams from ’73 to ’76 had a 0.795 winning percentage, while the ’75 to ’78 squads went won 76.7% of their games. The ’67 to ’70 Rams also qualify with a 0.768 winning percentage during that four year run. Guard Tom Mack was on the Rams from ’66 to ’78; Merlin Olsen was a Ram from ’62 to ’77, so let’s call these the Mack/Olsen Rams.

Let’s look at the Rams from ’66, when Roman Gabriel took over as the starting quarterback, through the end of the ’70s. There was a constant shuffling of coaches and quarterbacks during the Mack/Olsen era,

YearRecordQuarterbackCoachLast Game
19668-6Roman GabrielGeorge AllenMissed Playoffs
196711-1-2Roman GabrielGeorge AllenLost in Div Rd
196810-3-1Roman GabrielGeorge AllenMissed Playoffs
196911-3Roman GabrielGeorge AllenLost in Div Rd
19709-4-1Roman GabrielGeorge AllenMissed Playoffs
19718-5-1Roman GabrielTommy ProthroMissed Playoffs
19726-7-1Roman GabrielTommy ProthroMissed Playoffs
197312-2John HadlChuck KnoxLost in Div Rd
197410-4James HarrisChuck KnoxLost in NFCCG
197512-2Ron Jaworski/James Harris. [1]Harris was the main quarterback for most of the season, but a shoulder injury late in the season made Jaworski the playoff starter.Chuck KnoxLost in NFCCG
197610-3-1James HarrisChuck KnoxLost in NFCCG
197710-4Pat HadenChuck KnoxLost in Div Rd
197812-4Pat HadenRay MalavasiLost in NFCCG
19799-7Pat HadenRay MalavasiLost in Super Bowl

The ’75 to ’78 Rams won 77% of their games and lost in the NFC Championship Game three times. From ’67 to ’70, Los Angeles twice missed the playoffs despite strong seasons, and twice lost in the division round to the eventual NFC Champion. But the period from ’73 to ’76 takes the cake: L.A. went 44-11-1 in the regular season but never made it to the Super Bowl. Minnesota went 45-10 and made it to three Super Bowls during this window, with Dallas (who beat the Rams in the playoffs in ’75) earning the other NFC appearance.

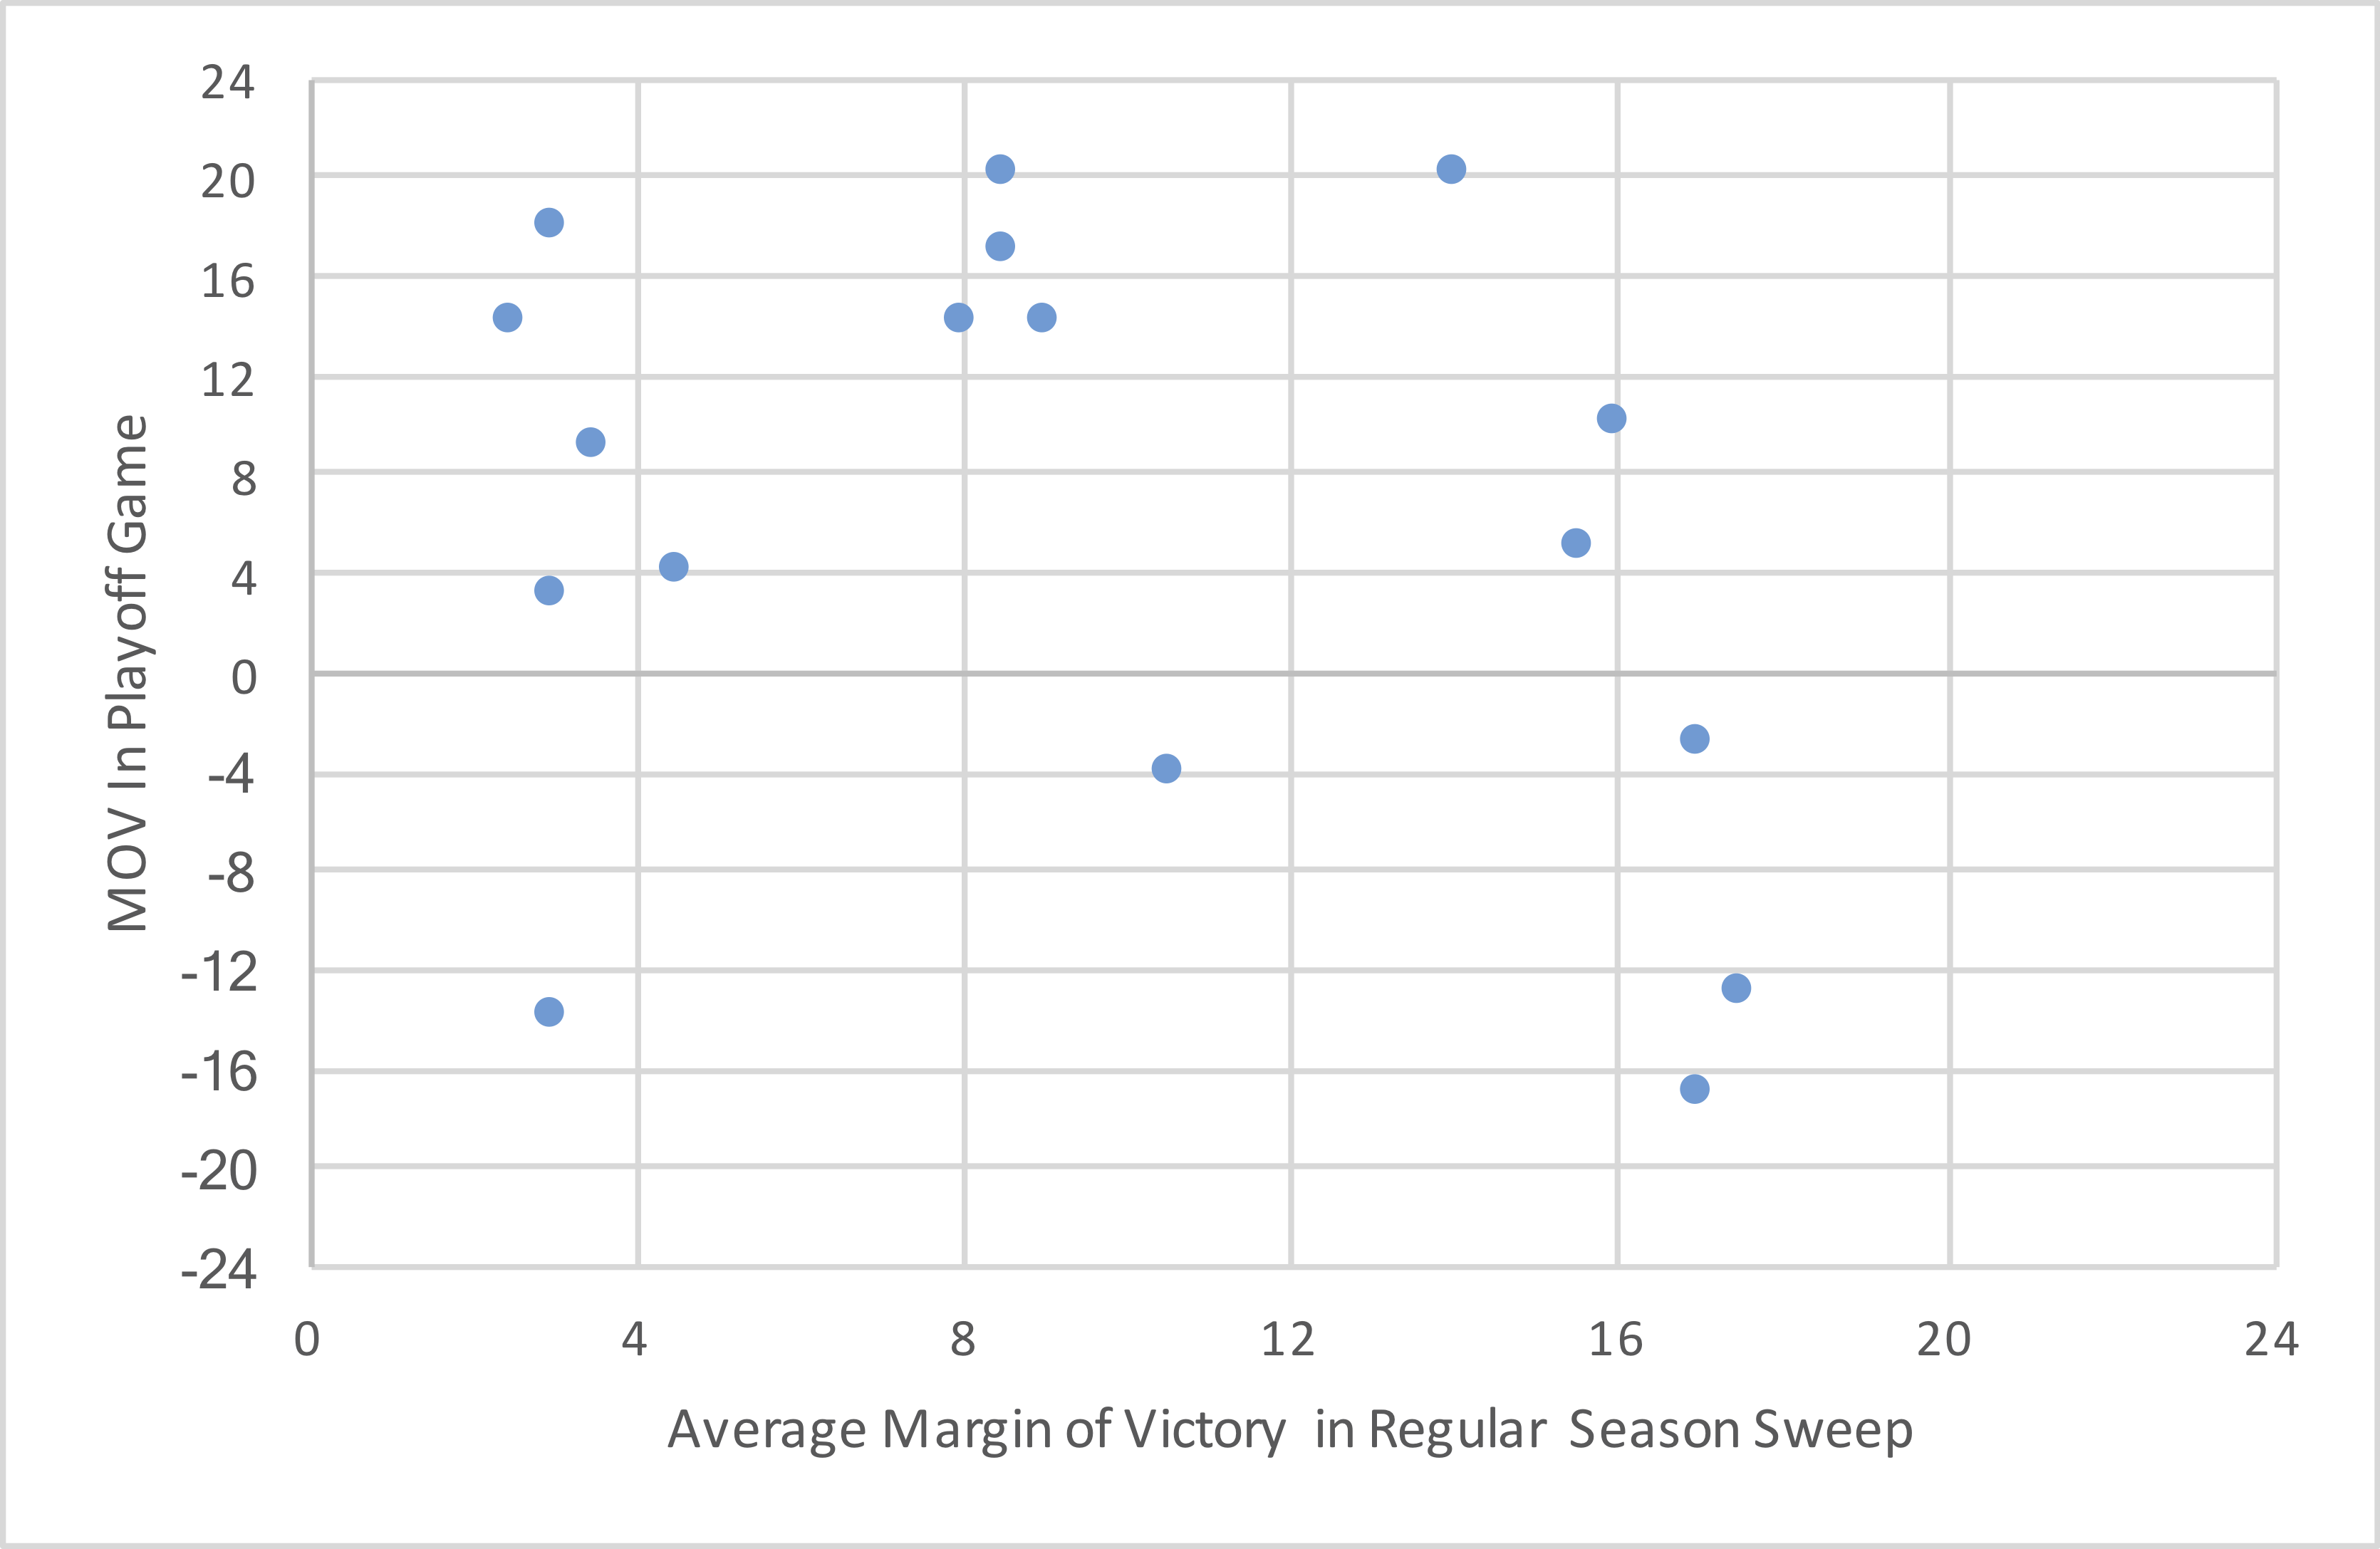
And then we have the Saints. New Orleans has won 11, 13, 13, and 12 games over the last four seasons. The 2017 season ended with the Minnesota Miracle; in 2018, the Saints earned the #1 seed but lost to the Rams in the NFC Championship Game, with a key defensive pass interference by Rams cornerback Nickell Robey-Coleman going uncalled. In 2019, New Orleans went 13-3 in the rare year where that landed them the three seed. That bad luck continued, with wildcard Minnesota once again upsetting the Saints and ending their season. And finally, in 2020, the Saints swept the Bucs in the regular season and earned the #2 seed in the NFC, but lost the third game against Tampa Bay in the Division Round.

References

References
1 Harris was the main quarterback for most of the season, but a shoulder injury late in the season made Jaworski the playoff starter.
{ 0 comments }

The 2018 Draft Class was hailed as one of the best of all time. Where do things stand after three years? At a high level, it looks like there are three winners and two losers — after all, three of those quarterbacks will be starting games this weekend in the division round of the playoffs, while the other two were huge busts for their drafting team. But let’s dig a little deeper:

  • Baker Mayfield was the first overall pick and has had an up-and-down run with Cleveland. Overall, he’s done enough to show that he deserves to keep the starting job, but he has not had a top-10 quarterback season since entering the league. Probably a bit below the expectations that come with the number one overall pick, but Cleveland fans are not unhappy.
  • Sam Darnold was the third overall draft pick, selected by the New York Jets. It has not gone well.
  • Josh Allen was the 7th overall pick and is probably the toughest player to evaluate. He was awful as a rookie, bad as a second-year player, and then played like a top-5 quarterback in 2020. He looks like a big win for Buffalo, and he adds a lot of value as a runner; that said, as a passer, he’s actually been below average over the course of his three seasons.
  • Josh Rosen has been the clear worst quarterback of the group, and his team moved on from him after just one year. Rosen has been worse than Darnold on a per play basis, but given that Arizona replaced him with Kyler Murray, you could argue that the Cardinals were hurt less by the Rosen pick than the Jets were with Darnold. Rosen has been a fast burn, like a Johnny Manziel, while Darnold more fits the Joey Harrington or Rick Mirer slow burn mold.
  • Lamar Jackson is the quarterback least capable of being evaluated solely as a passer, because he’s been the most dynamic runner in the NFL since he entered the league. Still, he’s been a very good passer through three seasons, and has clearly been the most productive quarterback through three years.

The graph below shows all quarterbacks drafted over a 50-year period, from 1969 to 2018. The Y-Axis shows how much passing value over average they produced — calculated by taking each quarterback’s Adjusted Net Yards per Attempt average relative to league average in each season, and multiplying that by the number of dropbacks. The X-Axis shows each player’s draft value, which is based on their draft selection. The more highly drafted players are on the left side of the chart, while the later picks are on the right side of the chart. For the 2018 1st round quarterbacks, I made their bubbles larger and color-coded them by team.

And here is the full dataset; the table is sortable and searchable.

YearQuarterbackTeamRdPickSupp?Year 1Year 2Year 3Total
1983Dan MarinoMIA127.73122717903792
2017Patrick MahomesKAN110.5155511142674
1998Peyton ManningIND11.-279103011901941
1984Boomer EsiasonCIN238.-13290210261796
1985Bernie KosarCLE115S46458681516
2012Russell WilsonSEA375.4575512871295
1999Daunte CulpepperMIN111.01051491100
2006Jay CutlerDEN111.643895711024
2000Chad PenningtonNYJ118.52-5903950
2016Jared GoffLAR11.-784912809938
2018Lamar JacksonBAL132.-61860118917
1998Brian GrieseDEN391.-5924911877
1971Ken AndersonCIN367.-67222713869
1983Ken O'BrienNYJ124.0-87954867
2008Matt RyanATL13.589-21297865
2017Deshaun WatsonHOU112.286311256853
2012Nick FolesPHI388.-2281142-64849
2004Ben RoethlisbergerPIT111.422636-212846
1979Joe MontanaSFO382.10189643842
1975Pat HadenRAM7176.0310524834
1986Jim EverettHOU13.0-68841773
2011Colin KaepernickSFO236.5378354738
2003Carson PalmerCIN11.0-3051010705
2012Andrew LuckIND11.-186115735663
2016Dak PrescottDAL4135.795-89-62645
1984Jay SchroederWAS383.0130499628
2004Philip RiversNYG14.8-80659588
2000Marc BulgerNOR6168.00525525
1969Greg CookCIN15.50700507
2011Cam NewtonCAR11.189373-92470
1969Edd HargettNOR16397.128166154449
2003Byron LeftwichJAX17.1552352419
2008Joe FlaccoBAL118.-189253345410
1993Elvis GrbacSFO8219.062345407
1994Gus FrerotteWAS7197.-97-34537406
1973Joe FergusonBUF357.-31020631341
1982Jim McMahonCHI15.42-111402333
2015Jameis WinstonTAM11.96-141377332
1990Neil O'DonnellPIT370.016270286
1986Mark RypienWAS6146.00276276
2016Carson WentzPHI12.-720715246241
1995Steve McNairHOU13.56311-132234
1978Matt CavanaughNWE250.05228234
2012Robert GriffinWAS12.648-192-239217
2005Derek AndersonBAL6213.0-205419214
2000Tom BradyNWE6199.-1089123203
2002Craig NallGNB5164.00189189
2015Marcus MariotaTEN12.-66438-191182
1975Steve GroganNWE5116.-16-93271162
1987Don MajkowskiGNB10255.73-214303162
1978Bill KenneyMIA12333.00149149
2004Jim SorgiIND6193.381030141
1985Doug FlutieRAM11285.04385128
1978Doug WilliamsTAM117.75-191235119
1999Aaron BrooksGNB4131.0242-126116
2014Jimmy GaroppoloNWE262.-30-19157107
1992Jeff BlakeNYJ6166.-66016195
1992T.J. RubleyRAM9228.089089
1992Craig EricksonTAM486.-25-28339688
1984Blair KielTAM11281.008585
2013Ryan NassibNYG4110.065763
1974Danny WhiteDAL353.006363
2001A.J. FeeleyPHI5155.65-3062
1987Steve BeuerleinRAI4110.0-5210452
1993Alex Van PeltPIT8216.004949
1975David HummOAK5128.451046
2001Michael VickATL11.-119262-10141
1983Gary KubiakDEN8197.21-365741
1980Turk SchonertCHI9242.052-1241
1979Steve DilsMIN497.0112-7934
1984Dean MayMIA5138.280028
1991Bill MusgraveDAL4106.270027
1990Cary ConklinWAS486.002626
1978Dennis SproulGNB8200.240024
2001Sage RosenfelsWAS4109.0-163923
2014Logan ThomasARI4120.230023
2007Troy SmithBAL5174.2272-7222
1994Jay WalkerNWE7198.002121
1970Bill CapplemanMIN251.200020
1993Billy Joe HobertRAI358.002020
2013Landry JonesPIT4115.001919
1972Neil GraffMIN16414.001616
2018Baker MayfieldCLE11.231-49828216
1989Jeff FrancisRAI6140.015015
1998Matt HasselbeckGNB6187.0-51813
1995Rob JohnsonJAX499.-7708912
1999Michael BishopNWE7227.0808
2003Kliff KingsburyNWE6201.0066
1986Doug GaynorCIN499.5005
1975Neal JeffreySDG17423.0303
1981Bob GaglianoKAN12319.0202
1990Troy TaylorNYJ484.3-102
2006Brad SmithNYJ4103.0-671
1992Ty DetmerGNB9230.0000
2014A.J. McCarronCIN5164.0000
1969Onree JacksonBOS5110.0000
1969Larry GoodBAL9232.0000
1969Sonny WadePHI10236.0000
1969Brian DowlingMIN11277.0000
1969Tim CarrRAM12307.0000
1969Bob BeldenDAL12308.0000
1969Ed RoseboroughSTL14357.0000
1969Buster O'BrienDEN17425.0000
1970Bobby CutburthCHI6133.0000
1970Rusty ClarkSFO6138.0000
1970Mike CilekCLE6151.0000
1970Gordon SladeBAL7174.0000
1970Mike HolmgrenSTL8201.0000
1970Larry ArnoldRAM12308.0000
1970Bobby StewartDEN16401.0000
1971Karl DouglasBAL378.0000
1971Joe TheismannMIA499.0000
1971Frank HarrisDET6150.0000
1971Buddy LeeCHI7167.0000
1971Charlie RichardsRAM11280.0000
1971Tim Von DulmSTL12303.0000
1971Steve GoepelDAL12311.0000
1971Busty UnderwoodBUF13316.0000
1971Craig BlackfordDEN13321.0000
1971Chuck HixsonKAN13328.0000
1971Bill BynumWAS14349.0000
1971Ron MaciejowskiCHI15376.0000
1972Jim FasselCHI7167.0000
1972Van BrownsonBAL8204.0000
1972Craig CurryMIA8207.0000
1972Mike FranksSTL10250.0000
1972Don BunceWAS12307.0000
1972James HamiltonCIN13314.0000
1972Eric GuthrieSFO14356.0000
1972Rusty LachausseeNOR15372.0000
1972Brian LinstromBUF16391.0000
1972Gary WichardBAL16412.0000
1972Gordon LongmireDAL16416.0000
1972Kelly CochraneHOU17421.0000
1973Mike WellsMIN480.0000
1973Randy MattinglyCLE4100.0000
1973Dan WernerDAL8204.0000
1973Mike RaeOAK8205.0000
1973Ty PaineNYG9225.0000
1973Matthew ReedBUF10240.0000
1973Tom PierantozziBAL13322.0000
1973John MadeyaATL14351.0000
1973Ted McNultyCIN15380.0000
1973Eddie McAshanNWE17420.0000
1973Eric CroneSTL17421.0000
1973Wayne EstabrookCIN17433.0000
1974Alan ChadwickCHI8186.0000
1974Gregg HareBUF8203.0000
1974Gary ValbuenaMIA10260.0000
1974Bo BobrowskiBAL12307.0000
1974Keith BoboDAL12309.0000
1974Frank KolchPIT13333.0000
1974Don Van GalderWAS14361.0000
1974Piel PenningtonDEN15379.0000
1974Craig HollandCHI17420.0000
1975Gary SheideCIN364.0000
1975Tom ShumanCIN6142.0000
1975Steve JoachimBAL7160.0000
1975Harry KnightOAK9232.0000
1975Rick WorleySFO12295.0000
1975Condredge HollowayNWE12306.0000
1975Jim McMillanDET14350.0000
1975John GrahamMIA14361.0000
1975Tom DoyleOAK14362.0000
1975Chris KupecBUF15383.0000
1975Alvin WhiteRAM15385.0000
1975Bill MaloufBAL16392.0000
1975Mitch AndersonATL17418.0000
1976Gene SwickCLE497.0000
1976Bob BatemanCIN7187.0000
1976Scott GardnerBUF8215.0000
1976Craig NagelCLE9261.0000
1976Bill BowermanDET10279.0000
1976Steve KincannonHOU10284.0000
1976Bill SalmonMIN10289.0000
1976Greg KokalNOR11294.0000
1976Cornelius GreeneDAL11317.0000
1976Dave BuckeyNYJ12327.0000
1976Joe BrunerKAN13361.0000
1976Steve HamiltonRAM13373.0000
1976Mark DriscollDAL13374.0000
1976Lynn HieberCIN15425.0000
1976Jack BerryTAM17460.0000
1976Chris RowlandSEA17461.0000
1976Jeff GrantzMIA17480.0000
1977Glenn CaranoDAL254.0000
1977Fred BesanaBUF5115.0000
1977Cliff StoudtPIT5121.0000
1977Tom DunivenCIN6160.0000
1977Steve MathiesonDET9236.0000
1977Mark VitaliKAN10261.0000
1977Mike CordovaPHI11286.0000
1978Pete WoodsKAN4104.0000
1978Mark MangesRAM4105.0000
1978Mike RiekerNOR6141.0000
1978Keith MyersGNB9228.0000
1978John HurleyWAS9243.0000
1979Rick LeachDEN5132.0000
1979David MarlerBUF10253.0000
1979Dan SandersNYJ11288.0000
1979Dave RaderSDG11295.0000
1979Larry FortnerMIA12327.0000
1980Gene BradleyBUF237.0000
1980Craig BradshawHOU7182.0000
1980Todd KruegerBUF8202.0000
1980Dan HartwigSFO9237.0000
1980Mike WrightCIN12308.0000
1980Jimmy JordanNWE12320.0000
1980Kevin ScanlonRAM12332.0000
1981Brad WrightMIA496.0000
1981Mike FordTAM9228.0000
1981Nickie HallGNB10255.0000
1981Phil KesselWAS10257.0000
1981Tim CliffordCHI10260.0000
1981Rick TrocanoPIT11292.0000
1981Brian BuckleyNWE11295.0000
1981Mark O'ConnellCIN12312.0000
1981Joe AdamsSFO12322.0000
1982Mike KelleyATL6149.0000
1982Luc TousignantBUF8218.0000
1982Bob LaneTAM9242.0000
1982Bryan ClarkSFO9251.0000
1982Ron ReevesHOU10261.0000
1982Steve MichutaCLE11282.0000
1982Steve SandonNWE11296.0000
1982Dan FeradayCIN12333.0000
1983Jim KellyBUF114.0000
1983Jeff ChristensenCIN5137.0000
1983Reggie CollierDAL6162.0000
1983Babe LaufenbergWAS6168.0000
1983Tom RamseyNWE10267.0000
1983Clete CasperRAM12311.0000
1983David MangrumPHI12312.0000
1983Scott LindquistRAI12333.0000
1984Wayne PeaceCIN17S0000
1984Ken HobartNYJ110S0000
1984Steve SmithSDG233S0000
1984Rick JohnsonRAM248S0000
1984Turner GillNYJ364S0000
1984Walter LewisNWE370S0000
1984Tim RiordanSTL373S0000
1984Frank SeurerSEA376S0000
1984John BondCLE377S0000
1984Jeff HostetlerNYG359.0000
1984Ben BennettATL6148.0000
1984Terry NugentCLE6158.0000
1984Mark CasaleCHI9244.0000
1984Kyle MackeySTL11296.0000
1984Randy EssingtonRAI12336.0000
1985Scott BarrySFO6168.0000
1985Steve CalabriaTAM9232.0000
1985Paul BernerSDG9234.0000
1985Buddy FunckDEN10269.0000
1985John ConnerSEA10277.0000
1985Joe ShieldGNB11294.0000
1986Robbie BoscoGNB372.0000
1986Stan GelbaughDAL6150.0000
1986Mike NorsethCLE7174.0000
1986Jeff WickershamMIA10274.0000
1986Chris HeggATL11280.0000
1986Kent AustinSTL12312.0000
1987Ken LambiottePHI9232.0000
1987John PayeSFO10275.0000
1987Mike ShulaTAM12313.0000
1987Jim KarsatosMIA12322.0000
1987Bill RansdellNYJ12327.0000
1988Don McPhersonPHI6149.0000
1988Mike PerezNYG7175.0000
1988Kerwin BellMIA7180.0000
1988Bud KeyesGNB10256.0000
1988Todd SantosNOR10274.0000
1988Danny McCoinDET11281.0000
1988Danny McManusKAN11282.0000
1988David WeberRAI11283.0000
1988Steve SlaydenCLE12328.0000
1989Jeff GrahamGNB487.0000
1989Brent SnyderCHI7192.0000
1989Terrence JonesSDG7195.0000
1989Paul SingerATL8202.0000
1989Bob JeanCIN10278.0000
1989Wayne JohnsonIND11296.0000
1989Steve TaylorIND12323.0000
1989Chuck HartliebHOU12325.0000
1990Gerry GdowskiNOR8207.0000
1990Kirk BaumgartnerGNB9242.0000
1990Todd EllisDEN9247.0000
1990Clemente GordonCLE11296.0000
1990Todd HammelTAM12307.0000
1990Gene BenhartIND12311.0000
1990John GromosSEA12312.0000
1990Major HarrisRAI12317.0000
1990Reggie SlackHOU12321.0000
1991Paul JustinCHI7190.0000
1991Pat O'HaraTAM10260.0000
1991Jeff BridewellPHO12309.0000
1991Larry WankeNYG12334.0000
1992Chris HakelWAS4112.0000
1992Ricky JonesRAM8198.0000
1992Mike PawlawskiTAM8222.0000
1992Darian HaganSFO9242.0000
1992Mark BarsottiMIA11296.0000
1992Keithen McCantCLE12316.0000
1992Cornelius BentonPIT12318.0000
1992Matt RodgersBUF12335.0000
1993Gino TorrettaMIN7192.0000
1993Trent GreenSDG8222.0000
1994Steve MatthewsKAN7199.0000
1995Chad MayMIN4111.0000
1995Jay BarkerGNB5160.0000
1995Jerry ColquittCAR6191.0000
1995John WalshCIN7213.0000
1996Spence FischerPIT6203.0000
1996Mike CawleyIND6205.0000
1996Jon StarkBAL7238.0000
1996Kyle WachholtzGNB7240.0000
1997Pat BarnesKAN4110.0000
1997Chuck ClementsNYJ6191.0000
1997Tony CorbinSDG7237.0000
1997Ron McAdaGNB7240.0000
1998John DuttonMIA6172.0000
1999Kevin DaftTEN5151.0000
2000Giovanni CarmazziSFO365.0000
2000Tee MartinPIT5163.0000
2000JaJuan SeiderSDG6205.0000
2001Josh BootySEA6172.0000
2001Josh HeupelMIA6177.0000
2002Brandon DomanSFO5163.0000
2002J.T. O'SullivanNOR6186.0000
2002Steve BellisariSTL6205.0000
2002Seth BurfordSDG7216.0000
2002Jeff KellySEA7232.0000
2002Wes PateBAL7236.0000
2004Andy HallPHI6185.0000
2004Josh HarrisBAL6187.0000
2004Jeff SmokerSTL6201.0000
2004Casey BramletCIN7218.0000
2004B.J. SymonsHOU7248.0000
2005David GreeneSEA385.0000
2005Stefan LeforsCAR4121.0000
2005Adrian McPhersonNOR5152.0000
2005James KilianKAN7229.0000
2006Charlie WhitehurstSDG381.0000
2006Ingle MartinGNB5148.0000
2006Omar JacobsPIT5164.0000
2006Reggie McNealCIN6193.0000
2006D.J. ShockleyATL7223.0000
2007Isaiah StanbackDAL4103.0000
2007Jeff RoweCIN5151.0000
2008John David BootyMIN5137.0000
2008Erik AingeNYJ5162.0000
2008Colt BrennanWAS6186.0000
2008Andre WoodsonNYG6198.0000
2008Alex BrinkHOU7223.0000
2009Rhett BomarNYG5151.0000
2009Nate DavisSFO5171.0000
2009Mike TeelSEA6178.0000
2010Jonathan CromptonSDG5168.0000
2010Dan LeFevourCHI6181.0000
2010Sean CanfieldNOR7239.0000
2010Zac RobinsonNWE7250.0000
2011Ricky StanziKAN5135.0000
2011Nathan EnderleCHI5160.0000
2012B.J. ColemanGNB7243.0000
2012Chandler HarnishIND7253.0000
2013Tyler WilsonOAK4112.0000
2013Brad SorensenSDG7221.0000
2013Zac DysertDEN7234.0000
2014Aaron MurrayKAN5163.0000
2014Keith WenningBAL6194.0000
2014Tajh BoydNYJ6213.0000
2014Garrett GilbertSTL6214.0000
2015Garrett GraysonNOR375.0000
2016Christian HackenbergNYJ251.0000
2016Brandon AllenJAX6201.0000
2016Brandon DoughtyMIA7223.0000
2017Davis WebbNYG387.0000
2017Brad KaayaDET6215.0000
2017Chad KellyDEN7253.0000
2018Mike WhiteDAL5171.0000
2018Tanner LeeJAX6203.0000
2018Danny EtlingNWE7219.0000
2018Alex McGoughSEA7220.0000
1999Scott CovingtonCIN7245.-300-3
1990Mike BuckNOR6156.06-10-4
2013B.J. DanielsSFO7237.00-6-6
2003Brian St. PierrePIT5163.0-60-6
1987Sammy GarzaSEA8216.-600-6
1989Erik WilhelmCIN383.899-104-6
2000Joe HamiltonTAM7234.-600-6
1978Rob HertelCIN5131.-700-7
1972Dean CarlsonKAN7179.00-9-9
2000Tim RattaySFO7212.-911-11-9
1997Wally RichardsonBAL7234.0-100-10
2003Gibran HamdanWAS7232.-1100-11
1995Kordell StewartPIT260.37-197148-11
2009Tom BrandstaterDEN6174.00-12-12
2018Logan WoodsideCIN7249.00-12-12
2000Todd HusakWAS6202.-1200-12
1982Bob HollyWAS11291.0-140-14
2016Nate SudfeldWAS6187.0-4429-14
2002Rohan DaveyNWE4117.-8-5-2-15
1978Gifford NielsenHOU373.-36813-16
2000Jarious JacksonDEN7214.-15-10-16
1995Dave BarrPHI4119.-1600-16
1987Dave WalterNYG11307.-1800-18
2008Kevin O'ConnellNWE394.-1900-19
1997Mike CherryNYG6171.0-200-20
2012Brock OsweilerDEN257.-12-1911-20
1984Rick McIvorSTL380.-2000-20
1987Doug HudsonKAN7186.-2000-20
2011Andy DaltonCIN235.-133-146259-20
2014David FalesCHI6183.00-20-20
2003Seneca WallaceSEA4110.00-22-22
1976Mike KruczekPIT247.128-6-144-23
2016Connor CookOAK4100.-2500-25
1994Perry KleinATL4111.-2500-25
1977Sam AdkinsSEA10254.-120-14-25
2016Cardale JonesBUF4139.-2600-26
1970Wayne ClarkSDG8198.400-66-27
1979Mike MoroskiATL6154.79-43-27
1999Chris GreisenARI7239.-27-70-34
1999Brock HuardSEA377.0-8349-34
1979Chuck FusinaTAM5133.0-5117-34
1983Jim Bob TaylorBAL11280.-3500-35
2004Bradlee Van PeltDEN7250.0-360-36
2005Dan OrlovskyDET5145.-3600-36
1979Dan ManucciBUF5116.0-380-38
2010Tony PikeCAR6204.-3800-38
1980Paul McDonaldCLE4109.095-133-38
1980Gary HogeboomDAL5133.00-38-38
2010Levi BrownBUF7209.-3800-38
1994Doug NussmeierNOR4116.00-42-42
1973Don StrockMIA5111.00-43-43
2009Pat WhiteMIA244.-4300-43
2005Matt CasselNWE7230.43-42-46-44
1990Craig KuppNYG5135.0-470-47
1992Casey WeldonPHI4102.0-6215-48
2009Matthew StaffordDET11.-8071757-49
1989Mike ElkinsKAN232.-5000-50
2016Jake RudockDET6191.0-510-51
2011Ryan MallettNWE374.0-520-52
1990Scott MitchellMIA493.00-52-52
1974David JaynesKAN366.-5300-53
1985Steve BonoMIN6142.-66-215-53
1999Joe GermaineSTL4101.-5500-55
2001Marques TuiasosopoOAK259.130-70-56
2000Chris RedmanBAL375.30-61-58
1974Clint LongleyCIN115S141-57-142-58
1992Brad JohnsonMIN9227.00-59-59
2018Josh AllenBUF17.-679-226845-60
2005Jason CampbellWAS125.021-81-60
1981Mark ReedNYG8207.00-61-61
1980Eric HippleDET485.0226-288-62
2004Matt MauckDEN7225.0-670-67
2003Rex GrossmanCHI122.-4-31-34-69
1978Guy BenjaminMIA251.34-5-100-71
1992Matt BlundinKAN240.0-13-59-72
2008Dennis DixonPIT5156.-3-27-44-74
2018Kyle LaulettaNYG4108.-7700-77
2017Joshua DobbsPIT4135.0-780-78
1987Rich GannonNWE498.-57-220-80
1985Frank ReichBUF357.14-940-80
2009Stephen McGeeDAL4101.0-16-65-81
1983Tony EasonNWE115.-342467-208-83
2003Drew HensonHOU6192.0-860-86
1990Peter Tom WillisCHI363.033-120-87
1996Jeff LewisDEN4100.-86-10-88
1984John WitkowskiDET6160.-8900-89
2010Mike KafkaPHI4122.0-890-89
1977Vince EvansCHI6140.0-52-39-91
1974Joe BarnesCHI13316.-9300-93
1980Ed LutherSDG4101.-34-52-9-95
1986Hugh MillenRAM371.0-16-80-96
1989Rodney PeeteDET6141.-154125-71-100
2014Tom SavageHOU4135.-460-60-106
2013Sean RenfreeATL7249.00-107-107
2004Matt SchaubATL390.-261174-26-113
1978Pat RyanNYJ11281.-40-740-114
1992Tony SaccaPHO246.-11500-115
1995Steve StenstromKAN4134.06-122-115
1972Joe GilliamPIT11273.-16-16158-118
1973Ron JaworskiRAM237.0-31-93-124
1971Bobby ScottNOR14340.00-124-124
1997Koy DetmerPHI7207.0-1301-130
2011Greg McElroyNYJ7208.0-1310-131
1977Cliff OlanderSDG5128.-78-540-133
1994Jim MillerPIT6178.0-110-23-133
1974Larry CipaNOR15373.-25-1090-133
1981Tom FlickWAS490.-110-240-134
2005Aaron RodgersGNB124.-110-6943-135
1973Tony AdamsSDG14343.00-135-135
2012Kirk CousinsWAS4102.81-353134-137
2007Jordan PalmerWAS6205.0-1400-140
1973Dan FoutsSDG364.-276234-99-142
2008Matt FlynnGNB7209.-23-66-53-142
1998Jonathan QuinnJAX386.-14500-145
2015Sean MannionSTL389.-13-63-71-147
1986Steve BradleyCIN12316.0-1480-148
1991Shawn MooreDEN11284.0-1480-148
1990Andre WareDET17.-1080-45-153
2011Jake LockerTEN18.166-282-38-153
2007Kevin KolbPHI236.-24-230100-154
2011Tyrod TaylorBAL6180.-3-86-72-161
1991Todd MarinovichRAI124.96-2600-165
1989Anthony DilwegGNB374.2-1700-168
1988Scott SeculesDAL6151.0-91-79-170
1992Bucky RichardsonHOU8220.-1221-181-172
1986Brian McClureBUF12313.0-1730-173
1970Frank PatrickGNB10251.-124-26-23-173
1969Bob NaponicHOU10256.0-1740-174
1973Dennis MorrisonSFO14357.0-1780-178
1980Mark MalonePIT128.0-1780-178
1971Joe ReedSFO11283.00-179-179
1973Gary KeithleySTL245.-18000-180
1987Cody CarlsonHOU364.0-99-83-182
1981Rich CampbellGNB16.-18300-183
2006Matt LeinartARI110.-72-15643-185
1987Mark VlasicSDG488.-85-1080-193
1984Scott CampbellPIT7191.9-153-52-196
2003Dave RagoneHOU388.-19900-199
1971Leo HartATL359.-4-1950-199
1980Rusty LischSTL489.-20000-200
1973Bert JonesBAL12.-521-295616-201
1974Norris WeeseRAM499.00-209-209
2010Rusty SmithTEN6176.-21504-211
1987Kevin SweeneyDAL7180.155-3680-213
1999Shaun KingTAM250.-56-117-41-214
2013Matt BarkleyPHI498.-209-60-216
1991Brett FavreATL233.-127328-419-217
1985Rusty HilgerRAI6143.-3616-199-219
1974Tom OwenSFO13322.-168-39-13-220
1991Donald HollasCIN499.-22880-221
1978Mark MillerCLE368.-172-510-223
2002David GarrardJAX4108.-16244-105-224
1974Carl SummerellNYG480.-137-890-225
2014Derek CarrOAK236.-82228567-226
1992Will FurrerCHI4107.-22700-227
1976Craig PenroseDEN4107.44-168-104-228
1995Stoney CaseARI380.-370-199-235
1975Carlos BrownGNB12296.67-3040-238
1988Tom TupaPHO368.3-2420-239
1989Steve WalshDAL115S-224-241224-241
1997Jim DruckenmillerSFO126.-24200-242
1977Tommy KramerMIN127.77-74-247-245
1993Mark BrunellGNB5118.0-77-169-246
1981Mark HerrmannDEN498.0-92-156-247
1977Matt RobinsonNYJ9227.-283130-95-249
1979Jeff RutledgeRAM9246.-223-6-20-250
1998Moses MorenoCHI7232.-6934-218-253
1981Neil LomaxSTL233.-420-160322-258
2010Tim TebowDEN125.89-320-27-258
2004John NavarreARI7202.-231-280-259
1981Wade WilsonMIN8210.-1360-123-259
1970Mike PhippsCLE13.-40-166-53-259
1977Randy DeanNYG5117.0-108-156-264
1989Timm RosenbachPHO115S-95-1710-266
1977Steve PisarkiewiczSTL119.0-116-151-267
2007John BeckMIA240.-27000-270
1977Vince FerragamoRAM491.56-84-245-272
1986David NorrieSEA11291.0-2740-274
2011T.J. YatesHOU5152.-79-72-125-276
1992Tommy MaddoxDEN125.-24816-51-283
2004Cody PickettSFO7217.-117-1690-286
2016Paxton LynchDEN126.-122-1700-292
1991Dan McGwireSEA116.-54-25818-294
1998Charlie BatchDET260.101131-526-295
1972Brian SipeCLE13330.00-295-295
1991Scott ZolakNWE484.0-287-10-297
1982Oliver LuckHOU244.0-35250-303
2003Chris SimmsTAM397.0-191-112-303
2016Jeff DriskelSFO6207.00-303-303
2006Tarvaris JacksonMIN264.-181-245119-307
1991Craig EricksonPHI5131.0-25-283-308
1982Mike MachurekDET6154.00-309-309
2018Mason RudolphPIT376.0-33929-310
2008Brian BrohmGNB256.0-127-183-310
2016Kevin HoganKAN5162.-170-1410-311
1989Jeff CarlsonRAM4102.00-313-313
1995Eric ZeierCLE384.-504-82268-318
1988Stan HumphriesWAS6159.0-11-310-321
2005Ryan FitzpatrickSTL7250.-32100-321
1987Brent PeaseMIN11295.-68-2540-322
1976Parnell DickinsonTAM7183.-33400-334
1976Jeb BlountOAK250.0-3360-336
1984Steve PelluerDAL5113.08-347-338
2002Randy FasaniCAR5137.-34200-342
1976Steve MyerSEA493.0-264-85-349
1992Dave BrownNYG115S-520-301-352
1971Scott HunterGNB6140.-179-27-152-358
2001Jesse PalmerNYG4125.09-370-361
2003Brooks BollingerNYJ6200.0-4-357-361
2007Tyler ThigpenMIN7217.-52-278-32-362
1983Bruce MathisonSDG10272.-290-334-363
2018Luke FalkTEN6199.0-3630-363
2004Luke McCownCLE4106.-36900-369
1969Alan PastranaDEN11270.0-3700-370
1969Al WoodallNYJ252.-95-84-196-375
1992Kent GrahamNYG8211.-247-77-53-376
2007Drew StantonDET243.0-27-354-381
2016Jacoby BrissettNWE391.-25-339-23-387
1974Jesse FreitasSDG6133.-127-2630-389
1975Bob AvelliniCHI6135.-138-35993-404
1997Tony GrazianiATL7204.-180-92-132-404
1970Steve RamseyNOR5126.-8-220-177-405
1972Jerry TaggeGNB111.-10-56-347-413
2014Johnny ManzielCLE122.-174-2420-416
1976Mike KirklandBAL5143.00-416-416
1973John HufnagelDEN14348.0-25-395-420
2008Josh JohnsonTAM5160.0-4220-422
1987Jim HarbaughCHI126.-59-142-235-435
1987Kelly StoufferSTL16.0-128-311-439
1971Lynn DickeyHOU356.-3470-97-443
1969James HarrisBUF8192.-16-82-350-448
1982Matt KoflerBUF248.0-55-404-459
1972Pat SullivanATL240.-20967-326-468
1989Billy Joe TolliverSDG251.-255-24531-470
1995Craig WhelihanSDG6197.00-473-473
1980Marc WilsonOAK115.7-484-6-483
2002Kurt KittnerATL5158.0-4880-488
1986Bubby BristerPIT367.-183-200-106-489
2004Craig KrenzelCHI5148.-49500-495
2013Mike GlennonTAM373.-409-880-497
1990John FrieszSDG6138.-56-4440-499
2006Brodie CroyleKAN385.-120-353-30-503
1976Jerry GolsteynNYG12333.0-315-190-505
2007Trent EdwardsBUF392.-24562-329-512
1983John ElwayBAL11.-479103-138-514
1977Steve DeBergDAL10275.0-701185-516
2007Brady QuinnCLE122.1-54-473-527
1994Glenn FoleyNYJ7208.-43-117-372-532
2013EJ ManuelBUF116.-334-82-123-538
1969Marty DomresSDG19.-414-25-103-541
1980Scott BrunnerNYG6145.-250-479183-545
2004J.P. LosmanBUF122.-47-414-91-552
2004Eli ManningSDG11.-508167-214-555
1988Chris ChandlerIND376.-149-10-407-567
2011Terrelle PryorOAK375S0-28-539-568
2014Teddy BridgewaterMIN132.-296-2770-573
2009Curtis PainterIND6201.-1980-376-574
2017C.J. BeathardSFO3104.-336-2410-577
1971Archie ManningNOR12.-305-253-21-579
1977David WhitehurstGNB8206.-137-192-251-580
1972John ReavesPHI114.-336-132-117-585
2002Patrick RamseyWAS132.-84-75-429-587
1994Heath ShulerWAS13.-255-3330-588
2006Kellen ClemensNYJ249.-54-487-48-588
1999Cade McNownCHI112.-230-3660-596
1987Chris MillerATL113.-359-27639-597
2003Ken DorseySFO7241.0-494-110-604
2009Keith NullSTL6196.-60700-607
1983Todd BlackledgeKAN17.79-345-341-608
2014Zach MettenbergerTEN6178.-90-5190-609
1980David WoodleyMIA8214.-436-15-161-612
1984Randy WrightGNB6153.-267-54-293-614
1991Browning NagleNYJ234.0-581-37-619
1976Richard ToddNYJ16.-61990-94-624
2001Drew BreesSDG232.78-218-487-626
1981Dave WilsonNOR115S-3930-236-628
2001Quincy CarterDAL253.-175-169-308-652
1982Mike PagelBAL484.-191-289-176-656
1982Art SchlichterBAL14.-1180-539-657
2009Josh FreemanTAM117.-608608-664-664
1995Todd CollinsBUF245.-165-24-476-665
2001Mike McMahonDET5149.-142-340-184-667
2016Cody KesslerCLE393.-73-138-457-668
2015Trevor SiemianDEN7250.0-90-581-671
1974Mike BorylaCIN487.91-212-556-676
1990Tom HodsonNWE359.-255-271-153-679
1971Jim PlunkettNWE11.69-84190-681
1977Randy HedbergTAM8196.-70900-709
1986Chuck LongDET112.-110-391-226-727
1974Gary MarangiBUF370.-3049-781-762
2015Bryce PettyNYJ4103.0-433-335-767
2000Spergon WynnCLE6183.-316-4580-774
1999Donovan McNabbPHI12.-675-259157-777
1969Terry HanrattyPIT230.-558-141-94-793
2008Chad HenneMIA257.-1-382-413-797
1984Steve YoungTAM11S0-296-501-797
2017Mitchell TrubiskyCHI12.-310124-617-803
2017Nathan PetermanBUF5171.-233-5890-823
1979Jack ThompsonCIN13.-377-311-144-831
2005Andrew WalterOAK369.0-836-6-842
2015Brett HundleyGNB5147.0-90-759-849
2006Vince YoungTEN13.-330-441-86-857
1976Scott BullSFO6177.-147-154-560-862
2005Kyle OrtonCHI4106.-8520-16-869
2010Colt McCoyCLE385.-245-576-51-872
1986Jack TrudeauIND247.-849117-171-902
2010Jimmy ClausenCAR248.-91300-913
2012Brandon WeedenCLE122.-520-4016-915
1996Danny KanellNYG4130.-190-232-503-925
2006Bruce GradkowskiTAM6194.-609-72-270-951
1996Tony BanksSTL242.-274-104-576-954
2012Ryan LindleyARI6185.-7400-231-971
2002Josh McCownARI381.-197-320-455-972
1979Steve FullerKAN123.-685-233-58-976
1996Bobby HoyingPHI385.-1534-1004-985
1997Danny WuerffelNOR499.-441-315-251-1006
1975Steve BartkowskiATL11.-56-399-570-1025
1989Troy AikmanDAL11.-672-616252-1035
1979Jeff KomloDET9231.-819-38-180-1037
2001Chris WeinkeCAR4106.-821-2250-1046
1985Randall CunninghamPHI237.-433-6468-1071
1993Drew BledsoeNWE11.-256-134-689-1079
2005Charlie FryeCLE367.-272-724-125-1120
2012Ryan TannehillMIA18.-365-565-194-1124
1999Tim CouchCLE11.-554-31-541-1127
1995Kerry CollinsCAR15.-481253-907-1136
1999Akili SmithCIN13.-426-726-13-1164
1979Phil SimmsNYG17.-347-598-224-1169
2002David CarrHOU11.-1096-9519-1171
1970Dennis ShawBUF230.-84-686-406-1176
1992David KlinglerCIN16.-212-511-495-1218
1970Terry BradshawPIT11.-802-353-93-1247
2010John SkeltonARI5155.-227-417-613-1257
2013Geno SmithNYJ239.-828-399-41-1268
2009Mark SanchezNYJ15.-614-186-493-1293
1973Gary HuffCHI233.-530-443-322-1296
2007JaMarcus RussellOAK11.-204-163-931-1298
2011Christian PonderMIN112.-530-485-298-1313
1969Bobby DouglassCHI241.-662-37-648-1346
2010Sam BradfordSTL11.-624-553-174-1350
2017DeShone KizerCLE252.-1138-2320-1369
2003Kyle BollerBAL119.-351-734-355-1440
1987Vinny TestaverdeTAM11.-151-872-467-1490
1990Jeff GeorgeIND11.-396-716-386-1497
1971Dan PastoriniHOU13.-394-437-739-1571
1997Jake PlummerARI242.-259-267-1055-1581
1998Ryan LeafSDG12.-9040-700-1603
2005Alex SmithSFO11.-821-278-505-1605
1993Rick MirerSEA12.-653-284-674-1611
1974Kim McQuilkenATL369.-489-443-685-1618
2002Joey HarringtonDET13.-599-754-266-1619
2018Sam DarnoldNYJ13.-481-312-896-1689
1994Trent DilferTAM16.-343-787-583-1713
2018Josh RosenARI110.-1221-5010-1722
2011Blaine GabbertJAX110.-1007-366-457-1830
2014Blake BortlesJAX13.-1234-118-649-2000

Darnold and Rosen grade out as two of the five worst passers through three seasons in the entire study, although a pair of Jaguars have them both beat.

{ 0 comments }

It is hard to beat a good team three times in a season, they say. Since the 1970 NFL Merger, there have been 21 instances where a team swept a team in the regular season and then had a third battle in the playoffs. The sweeping team has gone 14-7 in those games, which means it must not be *that* hard to beat a playoff team three times in a season. [1]For the historians out there, in the ’60s, the sweeping team went 3-1: the ’63 Chargers swept the Patriots and then beat them in the AFL Title game, the ’64 Bills pulled off that … Continue reading

It is worth noting that in 4 of these 21 trio of games, the sweeping team was on the road in the postseason. [2]The ’84 Seahawks swept the Raiders but finished three games behind them in the standings and lost in the playoff game, the ’92 Chiefs went 10-6 and swept the 11-5 Chargers and lost in San … Continue reading In the 17 instances where the postseason home team swept their playoff opponent during the regular season, the home teams went an impressive 12-5 in those games. The home team was, as you would expected, favored in all 17 games, with an average points spread of 5.8 points.

In the season opener, the Saints beat the Bucs by 11 points, and then the Saints shocked Tampa Bay on the road in the rematch, 38-3. Drew Brees threw 6 touchdowns and had no interceptions in the two games, while Tom Brady threw just 2 touchdowns and 5 interceptions while averaging just 5.13 net yards per attempt in those games. New Orleans won the two games by an average of 23 points a remarkable amount even for a two-game sweep. But it probably doesn’t mean much: there were three teams in our 17-paired sample where the sweeping team averaged a 17-point win or better during the regular season; shockingly, those teams went 0-3 in the playoff rematch.

The graph below shows the average margin of victory (on the X-Axis) for the sweeping team in the regular season, along with the results in the playoff game on the Y-Axis. Obviously if the dot is below the 0 line on the Y-Axis, that means the sweeping team lost in the postseason.

So yes, the Saints sure seem well equipped to handle Tampa Bay based on their dominant performance in the regular season. But I think it is probably best just to ignore that; for the most part, the sweeping teams usually win because they were the better team in the regular season and were at home in the playoffs. In this case, New Orleans is a 3-point favorite in the rematch, a pretty low number due to the low homefield advantage in this COVID-19 world and the extremely similar points differential the two teams had during the regular season.  I agree with Vegas: I’d make New Orleans the favorite, but this game feels close to a toss up.  And while I wouldn’t put much stock in the Saints regular season sweeps, I certainly would ignore any analysis that says it’s hard to go 3-0 against a good team.  Once you go 2-0, it’s actually not that hard!

The table below shows the 17 trio of games discussed above. Again, the home playoff team after sweeping their postseason opponent has gone 12-7 since the merger. The table below also includes links to all three games.

YearHome TeamRoad TeamGame 1Game 2Playoff GamePlayoff Spread
1982DolphinsJetsW 45-28W 20-19W 14-0-1
1986GiantsRedskinsW 27-20W 24-14W 17-0-7
1989OilersSteelersW 27-0W 23-16L 26-23-7
1991ChiefsRaidersW 24-21W 27-21W 10-6-5
1993RaidersBroncosW 23-20W 33-30W 42-24-2
1994VikingsBearsW 42-14W 33-27L 35-18-6
1994SteelersBrownsW 17-10W 17-7W 29-9-3.5
1997PackersBuccaneersW 21-16W 17-6W 21-7-13
1997PatriotsDolphinsW 27-24W 14-12W 17-3-5
1998CowboysCardinalsW 38-10W 35-28L 20-7-7
2000GiantsEaglesW 33-18W 24-7W 20-10-4.5
2002SteelersBrownsW 16-13W 23-20W 36-33-8
2004PackersVikingsW 34-31W 34-31L 31-17-6
2007CowboysGiantsW 45-35W 31-20L 21-17-7
2008SteelersRavensW 23-20W 13-9W 23-14-6
2009CowboysEaglesW 20-16W 24-0W 34-14-3.5
2017SaintsPanthersW 34-13W 31-21W 31-26-6.5
2020SaintsBuccaneersW 34-23W 38-3Sunday Night-3

As always, please leave your thoughts in the comments.

References

References
1 For the historians out there, in the ’60s, the sweeping team went 3-1: the ’63 Chargers swept the Patriots and then beat them in the AFL Title game, the ’64 Bills pulled off that same trick against the defending champion Chargers, and in the NFL, the Packers swept the Colts, although the last game came without either Hall of Fame quarterback. The one that went the other way was in 1969, when the AFL’s Chiefs lost to the Raiders in two tight regular season games, and then beat Oakland in the AFL Championship Game.

In the post World War II period (1945 to 1959), the sweeping team went 4-2 in these games: Cleveland pulled off this trick twice in the AAFC, and the ’52 Lions and ’58 Giants did it against the Rams and Browns, respectively. On the other hand, in 1950 (i) the Rams were swept by the Bears in a pair of close games, and then beat Chicago at home in the tiebreaker game, and (ii) the Browns lose two tight games to the Giants and then beat New York in the tiebreaker game.

2 The ’84 Seahawks swept the Raiders but finished three games behind them in the standings and lost in the playoff game, the ’92 Chiefs went 10-6 and swept the 11-5 Chargers and lost in San Diego in the postseason. On the other side, the ’99 Jaguars went 14-2, but lost all three games to the 13-3 Titans, the ’04 Seahawks went 9-7 but were swept by the 8-8 Rams in the regular season before beating them at home in the playoffs.
{ 7 comments }

Today Marks The First Ever Bills/Colts Playoff Game

The Colts have played 47 playoff games in franchise history, including 5 games apiece against the Steelers, Chiefs, and Patriots. But until today, the Colts have never played the Bills in a playoff game, one of just two AFC teams (Jacksonville) that the Colts have never played in the postseason.

The Bills have played 31 playoff games, including against the Dolphins four times. Buffalo has played a postseason game against all but two AFC teams: the Colts and the Ravens.

For half of Buffalo’s history, the Colts were a division rival; but the two teams were rarely both good at the same time. The graph below shows each team’s winning percentage in each season since 1960.

In ’64 and ’65, the Bills won the AFL Championship both seasons, while the Colts were one one of the top NFL contenders. Of course, the two leagues wouldn’t first play until the following season. At least one of the teams — usually Buffalo — had a losing record for most of the next two decades. The Bills would have a decade long stretch under Jim Kelly when they were a perennial contender, while the Colts were having mostly down seasons.

In 1999, the Bills went 11-5 under Doug Flutie while the Colts and Peyton Manning went 13-3; both teams lost in notable fashion to the Titans in the playoffs. This year, those records are reversed, but along with ’64 and ’65, ’99 and ’20 are the only seasons in 60 years where both teams went 11-5 or better (or the same winning percentage in a non-16 game season). The Colts had a long run of success under Manning while the Bills were having down years.

But today, the longtime AFC East rivals will finally play in a playoff game.

{ 0 comments }

Cordarrelle Patterson just become the first player to be named a first-team All-Pro returner by the Associated Press for the fourth time in his career. Patterson is on the Mount Rushmore of all time great returners, as he has dominated this era of kickoff returners in outlandish fashion. And he continues to rack up the postseason honors to go with his tremendous return averages, even if it come with a bit of an asterisk.

The Associated Press began naming an All-Pro kickoff returner in 1976; despite the name, it’s far from clear whether the voters drew a distinction between punt and kickoff returns. [1]In 2011, Patrick Peterson received the most votes of any kickoff returner, and he was therefore the first-team All-Pro selection. Only problem: Peterson, who had a magnificent year as a punt … Continue reading That was due in large part to some great returners beginning to enter the league. The previous year, Cardinal Terry Metcalf set an NFL with 2,462 all-purpose yards, and he ranked 3rd in punt return average and 2nd in kickoff return average. In Houston, Billy Johnson, of white shoes fame, had three punt returns for a touchdown in 1975. Pro Football Weekly named Johnson as its All-Pro returner that year, and beginning in ’76, the AP followed suit with a special slot dedicated to kickoff returners.

In the inaugural year, Denver’s Rick Upchurch earned first-team All-Pro honors from the Associated Press; that would happen two more times in his career. In the ’90s, Mel Gray also earned 3 first-team All-Pro returner nods from the Associated Press, and Devin Hester (’06, ’07, ’10) would later become the third player to earn three such honors. [continue reading…]

References

References
1 In 2011, Patrick Peterson received the most votes of any kickoff returner, and he was therefore the first-team All-Pro selection. Only problem: Peterson, who had a magnificent year as a punt returner, did not return a single kickoff that season.
{ 14 comments }

2020 AP All-Pro Teams Announced

After every year, I like to post the full results of the Associated Press voting for the All-Pro team, as the voting numbers are much more valuable than the binary answer to the question of whether or not a player was an All-Pro.

You were probably just getting to the new 2016 rules changes: that year, the AP decided to remove the fullback position in place of a “Flex” spot that goes to a running back, wide receiver, or tight end.  On defense, a “Defensive Back” spot was added

Historically, the voting has been wildly inconsistent at different positions, which has led to numerous embarrassing examples.  This year, the FLEX position and the Defensive Back position have been removed, with 3 WRs being selected and just one fewer defensive player. There were no positional issues this year, but the second-team process remains a joke. Raiders TE Darren Waller had 107 receptions for 1,196 yards and 9 touchdowns but was not a second-team pick.  He would likely have been a unanimous second-team pick if the All-Pro team had an actual second team; instead, because the first-team pick was unanimous, there is no second-team tight end selected.

The full results below.  The first-team picks are bolded. [continue reading…]

{ 0 comments }

Previously:

Week 17 was understated this year; with several playoff spots locked up, many teams rested starters and treated this like the final week of the preseason. With nothing to play for, the Eagles benched their starting quarterback midway through the game, putting in third stringer Nate Sudfeld. P.J. Walker, Chad Henne, and Mason Rudolph, saw significant action this week, while the Rams and Cardinals played one of the few meaningful games but with John Wolford and Chris Streveler as the starting quarterbacks. Remarkably, it was still a pretty good passing week for the NFL: the league averaged 6.30 ANY/A and a 91.8 passer rating in week 17.

The 5-10 Lions faced the 6-9 Vikings in a true meaningless game that turned out to be the most entertaining game of the early window. Kirk Cousins threw for over 400 yards and had a passer rating over 125; that happened only 6 times in the entire decade of the ’90s, but was the fifth time it happened in the 2020 season.

Perhaps just as impressive was Aaron Rodgers in the afternoon game; he threw for a first down on 52% of his dropbacks, including four touchdown passes, in an easy win over the Bears.
[continue reading…]

{ 0 comments }

Final 2020 Passing Statistics

It was the greatest passing season in NFL history… again. More on that in a moment, but first, let’s marvel at the game’s two best players. Aaron Rodgers and Patrick Mahomes were the top two quarterbacks in 2020, and the former MVPs both had magnificent seasons. Unfortunately for Mahomes, he faded slightly down the stretch, while Rodgers went into hyperdrive, throwing 8 TDs and nearly averaging 10 yards per attempt over his final two games.

In 2020, the league average was 6.40 ANY/A, the highest rate in NFL history. Rodgers averaged 8.89 Adjusted Net Yards per Attempt, a number that historians might feel sounds familiar: it’s the exact same number Mahomes averaged in his MVP campaign in 2018. In 2007, Tom Brady averaged 8.88 ANY/A, and in 2013, Peyton Manning averaged 8.87 ANY/A. It doesn’t quite crack the top 5 in this metric since 1970, or even make it the best season for Rodgers: he averaged 9.39 ANY/A in 2011.

But with an 8.89 ANY/A average on 546 dropbacks (526 pass attempts plus 20 sacks); since Rodgers averaged 2.49 ANY/A more than league average, we multiply those two numbers to conclude that Rodgers added 1,355 adjusted net yards of passing value over average. [1]That number is outstanding, but not all that noteworthy from a historical perspective. It 30th in history, in a near dead heat with Philip Rivers, 2009. From 2004 to 2019, there were 15 QBs who … Continue reading Mahomes averaged an excellent 8.33 ANY/A, or 1.93 ANY/A better than league average. He had more dropbacks than Rodgers (610), but that wasn’t enough to overcome the efficiency gap; Mahomes produced 1,176 yards of passing value over average. Deshaun Watson (8.22 ANY/A, 593 dropbacks, 1,077 yards of value over average) ranked 3rd in the greatest season by a QB who went 4-12 in NFL history.

But the Mahomes/Rodgers race was the story of the second half of the season.  In the chart below, I’ve shown how much cumulative value they provided by week, with Rodgers ultimately pulling ahead only in the final two weeks (and Mahomes, of course, sat in week 17).

Statistically speaking, it’s a narrow but clear win for Rodgers. In addition to leading the NFL in both ANY/A and Value, he also finished first in completion percentage and interception rate and touchdown rate. In fact, Rodgers joined Steve Young (1992) as the only quarterbacks since World War II to lead the NFL in completion percentage, interception rate, and touchdown rate in the same season.

Here are the full passing stats for each quarterback who threw 224 pass attempts in 2020. [continue reading…]

References

References
1 That number is outstanding, but not all that noteworthy from a historical perspective. It 30th in history, in a near dead heat with Philip Rivers, 2009. From 2004 to 2019, there were 15 QBs who qualified for the passing title and had a Relative ANY/A of at least 2.50, including most of the MVP seasons you can remember. Rodgers’s season numbers are outstanding, but the era is doing some of work in boosting his numbers; in other words, don’t listen to anyone who says this is one of the 10 greatest seasons in quarterback history, because it was not.
{ 0 comments }

When the Jets traded an enormous sum of draft capital to draft Sam Darnold — more draft capital, mind you, than the number one overall pick — the organization expected big results. Instead, it get the smallest results possible, which is just one reason why the Jets fired GM Mike Maccagnan last year.

Darnold was drafted with the 3rd overall pick in the 2018 Draft, the second quarterback selected after Baker Mayfield. And from 2018 to 2020, among the quarterbacks with at least 600 pass attempts, Darnold ranked dead last in both Adjusted Net Yards per Attempt and passer rating. [continue reading…]

{ 0 comments }

On the surface, Bears quarterback Mitchell Trubisky is having an unremarkable season. Through 16 weeks, there are 36 qualifying passers, and Trubisky ranks 24th in Adjusted Net Yards per Attempt. He is not doing particularly well in any conventional metric: Trubisky ranks 24th in completion percentage, 20th in yards per completion, 21st in sack rate, and a dismal 29th in interception rate! The only area where he’s really standing out is in touchdown rate, where he ranks 8th, but even his TD/INT ratio is relatively mediocre.

And yet, there is one area where Trubisky has not just been good, he’s been the best: the Bears fourth year quarterback is picking up first downs at the best rate in the NFL.
[continue reading…]

{ 0 comments }

Longtime readers may recall that in 2017, Russell Wilson was basically the entire Seahawks offense. Due to multiple running back injuries and a poor offensive line, no Seahawks back rushed for even 250 yards, and Wilson accounted for all of the team passing yards. In late November, the media was publicizing the fact that Wilson had accounted for over 82% of Seattle’s offensive yards, and that such a feat was the highest in NFL history. I noted at the time that those headlines, while accurate, were surprisingly quiet as to who the current recordholder was…. and then I found out why. Jon Kitna, playing for the 3-13 Detroit Lions, set the NFL record when he produced 81.8% of all Lions offensive yards.

Wilson was having an MVP-caliber season, of course, so comparing him to Kitna wasn’t exactly a compliment. As a result, the headlines (well, other than mine) were mostly silent on the current recordholder and just noted the impressive-sounding fact that Wilson was responsible for a larger percentage of his team’s yards than any player had ever been.  As it turns out, Wilson finished the season with 81.5% of the Seahawks yards, falling just behind Kitna’s mark.

Since then?  Jameis Winston in 2019 was the only player to come close, and he now ranks 3rd all-time in the metric behind Kitna ’06 and Wilson ’17.  But all of that is about to change, at least if week 17 results hold to previous form.  Houston quarterback Deshaun Watson has thrown for 4,458 yards and has rushed for 432 yards. Watson has produced just about all the yards for the offense, with running backs David Johnson and Duke Johnson picking up the scraps.  Watson has 4,890 of Houston’s 5,828 yards, which is 83.9%.  This would set the new record.  And, in case it wasn’t clear, it would break the record held by Jon Kitna.

UPDATE: The Texans individual players finished with 6,309 yards from scrimmage in 2020, excluding yards lost due to sacks. Watson threw for 4,823 yards and rushed for 444 yards, giving him 5,267 yards of offense, or 83.5% of all Houston yards. A remarkable season for Watson! He topped 90% twice, against Pittsburgh (where non-Watson players rushed for 24 yards) and against the Patriots. Facing New England, Watson threw for 344 yards and rushed for 36, and his 380 yards represented 95% of the Texans offensive output that day (with non-Watson players rusheing 13 times for 19 yards).

Congrats, Deshaun!

{ 0 comments }

PFR tracks air yards and YAC for quarterbacks, with that data available here. I went ahead and compiled the data at a team level, using quarterback statistics only. The graph below shows how air yards (on the X-Axis) and yards after the catch (on the Y-Axis) for each team so far in 2020.

[continue reading…]

{ 0 comments }

Don’t look now, but it’s the Baltimore Ravens who lead the NFL in points differential. The Ravens had a historic season in 2019, easily leading the league in this category. But in 2020, it’s been a rough year for Baltimore: they had clinched the 1 seed this time last season, but are still needing a win or some help in week 17 to make the 2020 postseason. Not too long ago, the Ravens were 6-5 after a Wednesday night loss with a depleted roster to the Steelers. Since then, the Ravens have won four straight games by a total of 62 points. That is enough to give Baltimore the best points differential in the NFL entering week 17. [continue reading…]

{ 0 comments }

Kyler Murray and Cam Newton have already both rushed for double digit touchdowns this season, a mark reached just five times by quarterbacks in the Super Bowl era prior to 2020. But they are far from alone:

In short: there have been a ton of rushing touchdowns this season by quarterbacks. With two weeks left to play, NFL quarterbacks have rushed for 110 touchdowns in 224 games (or 448 team games). That’s an average of one every four games, or about 4 per 16 games. Which is… an enormous amount. As recently as 1993, when there were 28 teams, NFL quarterbacks rushed for 28 touchdowns all season, or 1 for every 16 team games. In both 2009 and 2010, NFL quarterbacks rushed for 46 touchdowns, or 1.44 per team game. Three years ago, quarterbacks scored “only” 63 touchdowns on the ground, or just under 2 per team game. This year, we might double that mark! The graph below shows quarterback rushing touchdowns per team game for each year since 1970, with 2020 through 15 weeks. To call it a big outlier would be an understatement:
[continue reading…]

{ 0 comments }

In 2019, Buffalo quarterback Josh Allen averaged 5.71 Adjusted Net Yards per Attempt, which ranked 23rd among all NFL quarterbacks. The league average was 6.16 ANY/A in ’19, which means Allen was a bit below average as a passer: he averaged -0.45 ANY/A relative to league average.

This year, with two games to go, Allen has significantly improved. He is averaging 7.55 Adjusted Net Yards per Attempt, and will likely finish at least in the top 8 in the pass efficiency rankings. He is averaging +1.53 Relative ANY/A, given that the league average through 15 weeks is 6.40. [continue reading…]

{ 0 comments }

Previously:

The entire NFL had a passer rating of 99.1 in week 15, while averaging 6.91 ANY/A; in other words, the average quarterback this weekend was better than the average performance by Steve Young. So let’s focus on a couple of the rare duds.

A few weeks ago, Ben Roethlisberger was enjoying the high life as the quarterback of the 11-0 Pittsburgh Steelers. But after dropping three straight games, the situation is now ugly in Pittsburgh, and Roethlisberger is a big part of the problem. He is averaging an anemic 5.18 yards per attempt and 8.44 yards per completion over the last month of the season. On Monday Night Football, the Steelers lost to the Bengals in one of the biggest upsets in franchise history. Roethlisberger produced the worst passing performance of week 15: he threw for only 6 first downs on 38 pass attempts (plus 1 sack), making it one of the most anemic Steelers passing attacks of the last two decades.

Meanwhile, in Washington, Dwayne Haskins threw 55 times and somehow still didn’t reach 300 passing yards. It was even uglier through three quarters: he was 25 of 36, but for just 192 yards with only 10 first downs, and 2 interceptions and a sack. And then, somehow, his week got even worse.

The full week 15 passing stats, below. [continue reading…]

{ 0 comments }

Previously:

[continue reading…]

{ 0 comments }

Previously:

[continue reading…]

{ 0 comments }

On Thanksgiving Day, 1965, the Baltimore Colts and the Detroit Lions battled to a 24-24 tie. In the New York Times report of the day, it was noted that Unitas was sacked four times by the Lions defense; well, technically, it was reported that he was “trapped” four times.

That wasn’t such a big deal: the Lions defense would go on to lead the NFL in sacks with 49 that season, and no defense recorded more sacks than Detroit from 1960 to 1965. But the Thanksgiving performance was notable because it marked the 76th consecutive game that the Detroit Lions sacked the opposing quarterback.

The streak would end the following week against division rival San Francisco. John Brodie was a difficult man to take down; in 1965, the 49ers offense had the lowest sack rate in the NFL. Earlier in the season season, Detroit registered just one sack on Brodie, and in the rematch, Brodie dropped back 35 times without being trapped for a loss. [continue reading…]

{ 0 comments }

Travis Kelce Is Lapping The Tight End Field in 2020

In 1980, after 11 games, Chargers tight end Kellen Winslow had 878 receiving yards, more than 300 ahead of every other tight end in the NFL. Houston’s Mike Barber (576) and Tampa Bay’s Jimmie Giles (506) were the only other tight ends with even 500 receiving yards. The Oilers other tight end, Dave Casper, was acquired via trade midseason and had just 387 yards at the time. By the end of the year, Casper would finish with the second most receiving yards of any tight end in football, at 796. But Winslow blew him out of the water, with 1,290 receiving yards. That number was second in the entire NFL, but also just second on San Diego in receiving yards behind John Jefferson (and just ahead of teammate Charlie Joiner, who ranked 3rd in the AFC in receiving yards and 4th in the NFL).

Twenty years later, Chiefs superstar Tony Gonzalez had 828 receiving yards through 11 games; Shannon Sharpe (602), Freddie Jones (582) and Kyle Brady (570) were the only other tight ends with 500 yards at that time. By season’s end, Gonzalez would rack up 1,203 receiving yards for Kansas City, nearly 400 yards ahead of every other tight end in the league (Sharpe finished with 810).

Twenty years later, the current Chiefs superstar tight end is threatening to set a new record. Travis Kelce has 978 receiving yards after 11 games, and no other tight end is within shouting distance of him. Raiders TE Darren Waller is second in the NFL with 542 receiving yards, Lions TE T.J. Hockenson has 530, and Chargers TE Hunter Henry has 502 (by NFL fiat, the Chargers must always have a good tight end). Kelce could stop playing today and he’d probably finish the season with the most receiving yards of any tight end. Right now, he has a lead of 436 receiving yards, a remarkable 39.6 yard per game average.

Interesting trivia aside, I didn’t bring up the 20-year intervals at random. Those two seasons represent the largest difference in receiving yards between the top tight end and number two tight end in history. [1]I will note that there is some ambiguity in position labels from the early 1960s, and you may be able to argue that say, Mike Ditka had a larger lead if say, you want to quibble with calling Monty  … Continue reading Sharpe’s advantage was 393 yards, while Casper’s edge was a mammoth 494 yards. But Kelce is on pace to shatter that record, and should easily win the receiving TE crown by around 600 yards. It is even possible, if unlikely, that he will have more than twice as many yards as every other tight end in the NFL. Kelce, like Winslow in 1980, is second in the AFC in receiving yards and second on his own team: Tyreek Hill leads all AFC players with 1,021 yards, second in the NFL only to Seattle’s D.K. Metcalf (1,039).

It was only last season that Kelce quietly made history: he led the AFC in receiving yards, the first tight end to lead a conference in receiving yards since 1972. But this year, Kelce looks even more valuable. In part, his dominance is a reflection of the struggles for the other top tight ends in the league. George Kittle missed most of 2020 with an injury, Waller has been hurt by the addition of Nelson Agholor and a more run-heavy offense, Mark Andrews has disappeared with the rest of the Ravens passing offense, and Zach Ertz has gone down with the Carson Wentz ship. But let’s not take anything away from Kelce: He’s been absolutely outstanding for years, and yet might be currently in the middle of his best season ever.

References

References
1 I will note that there is some ambiguity in position labels from the early 1960s, and you may be able to argue that say, Mike Ditka had a larger lead if say, you want to quibble with calling Monty Stickles a tight end.
{ 0 comments }
Previous Posts