
Previously:
- Week 1 Passing Stats
- Week 2
- Week 3
- Week 4
- Week 5
- Week 6
- Week 7
- Week 8
- Week 9
- Week 10
- Weeks 11 and 12
- Week 13
- Week 14
The entire NFL had a passer rating of 99.1 in week 15, while averaging 6.91 ANY/A; in other words, the average quarterback this weekend was better than the average performance by Steve Young. So let’s focus on a couple of the rare duds.
A few weeks ago, Ben Roethlisberger was enjoying the high life as the quarterback of the 11-0 Pittsburgh Steelers. But after dropping three straight games, the situation is now ugly in Pittsburgh, and Roethlisberger is a big part of the problem. He is averaging an anemic 5.18 yards per attempt and 8.44 yards per completion over the last month of the season. On Monday Night Football, the Steelers lost to the Bengals in one of the biggest upsets in franchise history. Roethlisberger produced the worst passing performance of week 15: he threw for only 6 first downs on 38 pass attempts (plus 1 sack), making it one of the most anemic Steelers passing attacks of the last two decades.
Meanwhile, in Washington, Dwayne Haskins threw 55 times and somehow still didn’t reach 300 passing yards. It was even uglier through three quarters: he was 25 of 36, but for just 192 yards with only 10 first downs, and 2 interceptions and a sack. And then, somehow, his week got even worse.
The full week 15 passing stats, below.
| Rk | Passer | Team | Opp | Result | Att | Yd | TD | INT | 1D | Sk | Yd | FL | AdjY/DB | DB | VALUE |
|---|---|---|---|---|---|---|---|---|---|---|---|---|---|---|---|
| 1 | Ryan Tannehill | TEN | DET | W 46-25 | 27 | 273 | 3 | 0 | 17 | 1 | 5 | 0 | 16.21 | 28 | 193 |
| 2 | Justin Herbert | LAC | LVR | W 30-27 | 32 | 314 | 2 | 0 | 16 | 1 | 8 | 0 | 14.30 | 33 | 165 |
| 3 | Josh Allen | BUF | DEN | W 48-19 | 40 | 359 | 2 | 0 | 19 | 1 | 7 | 0 | 13.29 | 41 | 163 |
| 4 | Kyler Murray | ARI | PHI | W 33-26 | 36 | 406 | 3 | 1 | 18 | 1 | 9 | 1 | 13.43 | 37 | 152 |
| 5 | Baker Mayfield | CLE | NYG | W 20-6 | 32 | 297 | 2 | 0 | 16 | 1 | 11 | 0 | 13.70 | 33 | 145 |
| 6 | Lamar Jackson | BAL | JAX | W 40-14 | 22 | 243 | 3 | 1 | 13 | 1 | 0 | 0 | 15.13 | 23 | 134 |
| 7 | Tom Brady | TAM | ATL | W 31-27 | 45 | 390 | 2 | 0 | 19 | 3 | 25 | 0 | 11.63 | 48 | 111 |
| 8 | Matthew Stafford | DET | TEN | L 25-46 | 32 | 252 | 1 | 0 | 14 | 0 | 0 | 0 | 12.16 | 32 | 91 |
| 9 | Matt Ryan | ATL | TAM | L 27-31 | 49 | 356 | 3 | 0 | 21 | 3 | 24 | 0 | 10.65 | 52 | 70 |
| 10 | Philip Rivers | IND | HOU | W 27-20 | 28 | 228 | 2 | 0 | 10 | 1 | 5 | 0 | 11.55 | 29 | 65 |
| 11 | Mitchell Trubisky | CHI | MIN | W 33-27 | 21 | 202 | 1 | 1 | 10 | 1 | 4 | 0 | 11.55 | 22 | 49 |
| 12 | Deshaun Watson | HOU | IND | L 20-27 | 41 | 373 | 2 | 0 | 17 | 5 | 31 | 1 | 10.15 | 46 | 39 |
| 13 | Jalen Hurts | PHI | ARI | L 26-33 | 44 | 338 | 3 | 0 | 18 | 6 | 33 | 0 | 10.00 | 50 | 34 |
| 14 | Marcus Mariota | LVR | LAC | L 27-30 | 28 | 226 | 1 | 1 | 11 | 0 | 0 | 0 | 10.39 | 28 | 30 |
| 15 | Colt McCoy | NYG | CLE | L 6-20 | 31 | 221 | 0 | 0 | 10 | 1 | 7 | 0 | 9.50 | 32 | 6 |
| 16 | Ryan Finley | CIN | PIT | W 27-17 | 13 | 89 | 1 | 0 | 6 | 2 | 11 | 0 | 9.53 | 15 | 3 |
| 17 | Sam Darnold | NYJ | LAR | W 23-20 | 31 | 207 | 1 | 0 | 11 | 2 | 11 | 0 | 9.27 | 33 | -1 |
| 18 | Andy Dalton | DAL | SFO | W 41-33 | 33 | 209 | 2 | 0 | 12 | 2 | 17 | 0 | 9.20 | 35 | -4 |
| 19 | Kirk Cousins | MIN | CHI | L 27-33 | 35 | 271 | 2 | 1 | 12 | 3 | 22 | 0 | 8.79 | 38 | -20 |
| 20 | Cam Newton | NWE | MIA | L 12-22 | 27 | 209 | 0 | 0 | 8 | 3 | 23 | 0 | 8.60 | 30 | -21 |
| 21 | Drew Brees | NOR | KAN | L 29-32 | 34 | 234 | 3 | 1 | 10 | 1 | 9 | 0 | 8.66 | 35 | -23 |
| 22 | Gardner Minshew II | JAX | BAL | L 14-40 | 29 | 226 | 2 | 0 | 11 | 5 | 21 | 1 | 8.12 | 34 | -41 |
| 23 | Tua Tagovailoa | MIA | NWE | W 22-12 | 26 | 145 | 0 | 1 | 10 | 2 | 12 | 0 | 6.36 | 28 | -83 |
| 24 | Teddy Bridgewater | CAR | GNB | L 16-24 | 35 | 258 | 0 | 0 | 8 | 3 | 9 | 1 | 7.13 | 38 | -83 |
| 25 | Jared Goff | LAR | NYJ | L 20-23 | 34 | 209 | 2 | 1 | 9 | 3 | 20 | 0 | 6.68 | 37 | -98 |
| 26 | Russell Wilson | SEA | WAS | W 20-15 | 27 | 121 | 1 | 1 | 6 | 0 | 0 | 0 | 5.22 | 27 | -110 |
| 27 | Patrick Mahomes | KAN | NOR | W 32-29 | 47 | 254 | 3 | 0 | 16 | 4 | 22 | 1 | 7.04 | 51 | -116 |
| 28 | Aaron Rodgers | GNB | CAR | W 24-16 | 29 | 143 | 1 | 0 | 8 | 5 | 47 | 0 | 5.26 | 34 | -138 |
| 29 | Nick Mullens | SFO | DAL | L 33-41 | 36 | 219 | 2 | 2 | 12 | 2 | 11 | 1 | 5.21 | 38 | -156 |
| 30 | Drew Lock | DEN | BUF | L 19-48 | 32 | 132 | 1 | 0 | 10 | 3 | 17 | 1 | 4.74 | 35 | -160 |
| 31 | Dwayne Haskins | WAS | SEA | L 15-20 | 55 | 295 | 1 | 2 | 16 | 4 | 26 | 0 | 5.66 | 59 | -216 |
| 32 | Ben Roethlisberger | PIT | CIN | L 17-27 | 38 | 170 | 1 | 1 | 6 | 1 | 12 | 1 | 3.28 | 39 | -235 |
| Total | Total | Total | 1095 | 8122 | 54 | 15 | 410 | 72 | 462 | 8 | 9.31 | 1167 |
It was a rough week for the two leading MVP candidates. Patrick Mahomes threw 3 TDs and no interceptions and the Chiefs scored 32 points, which maybe is a sign of how high the Chiefs floor really is with Mahomes. But Kansas City punted 6 times, only the second time that’s happened in the Mahomes era, and the Chiefs averaged a poor 4.6 net yards per pass, the worst performance in any of Kansas City’s last 74 games. Meanwhile, the Packers averaged under 3 net yards per attempt, an extremely rare result for Green Bay over the last 25 years. In fact, it was only the fourth time since Rodgers became a starter that he averaged under 3 net yards per pass attempt for a game. Aaron Rodgers threw for just 8 first downs on 34 dropbacks, one of the worst performances of his career. But no matter: both the Packers and Chiefs rode to relatively easy wins.
The graph below shows the passing differential for each game in week 15.
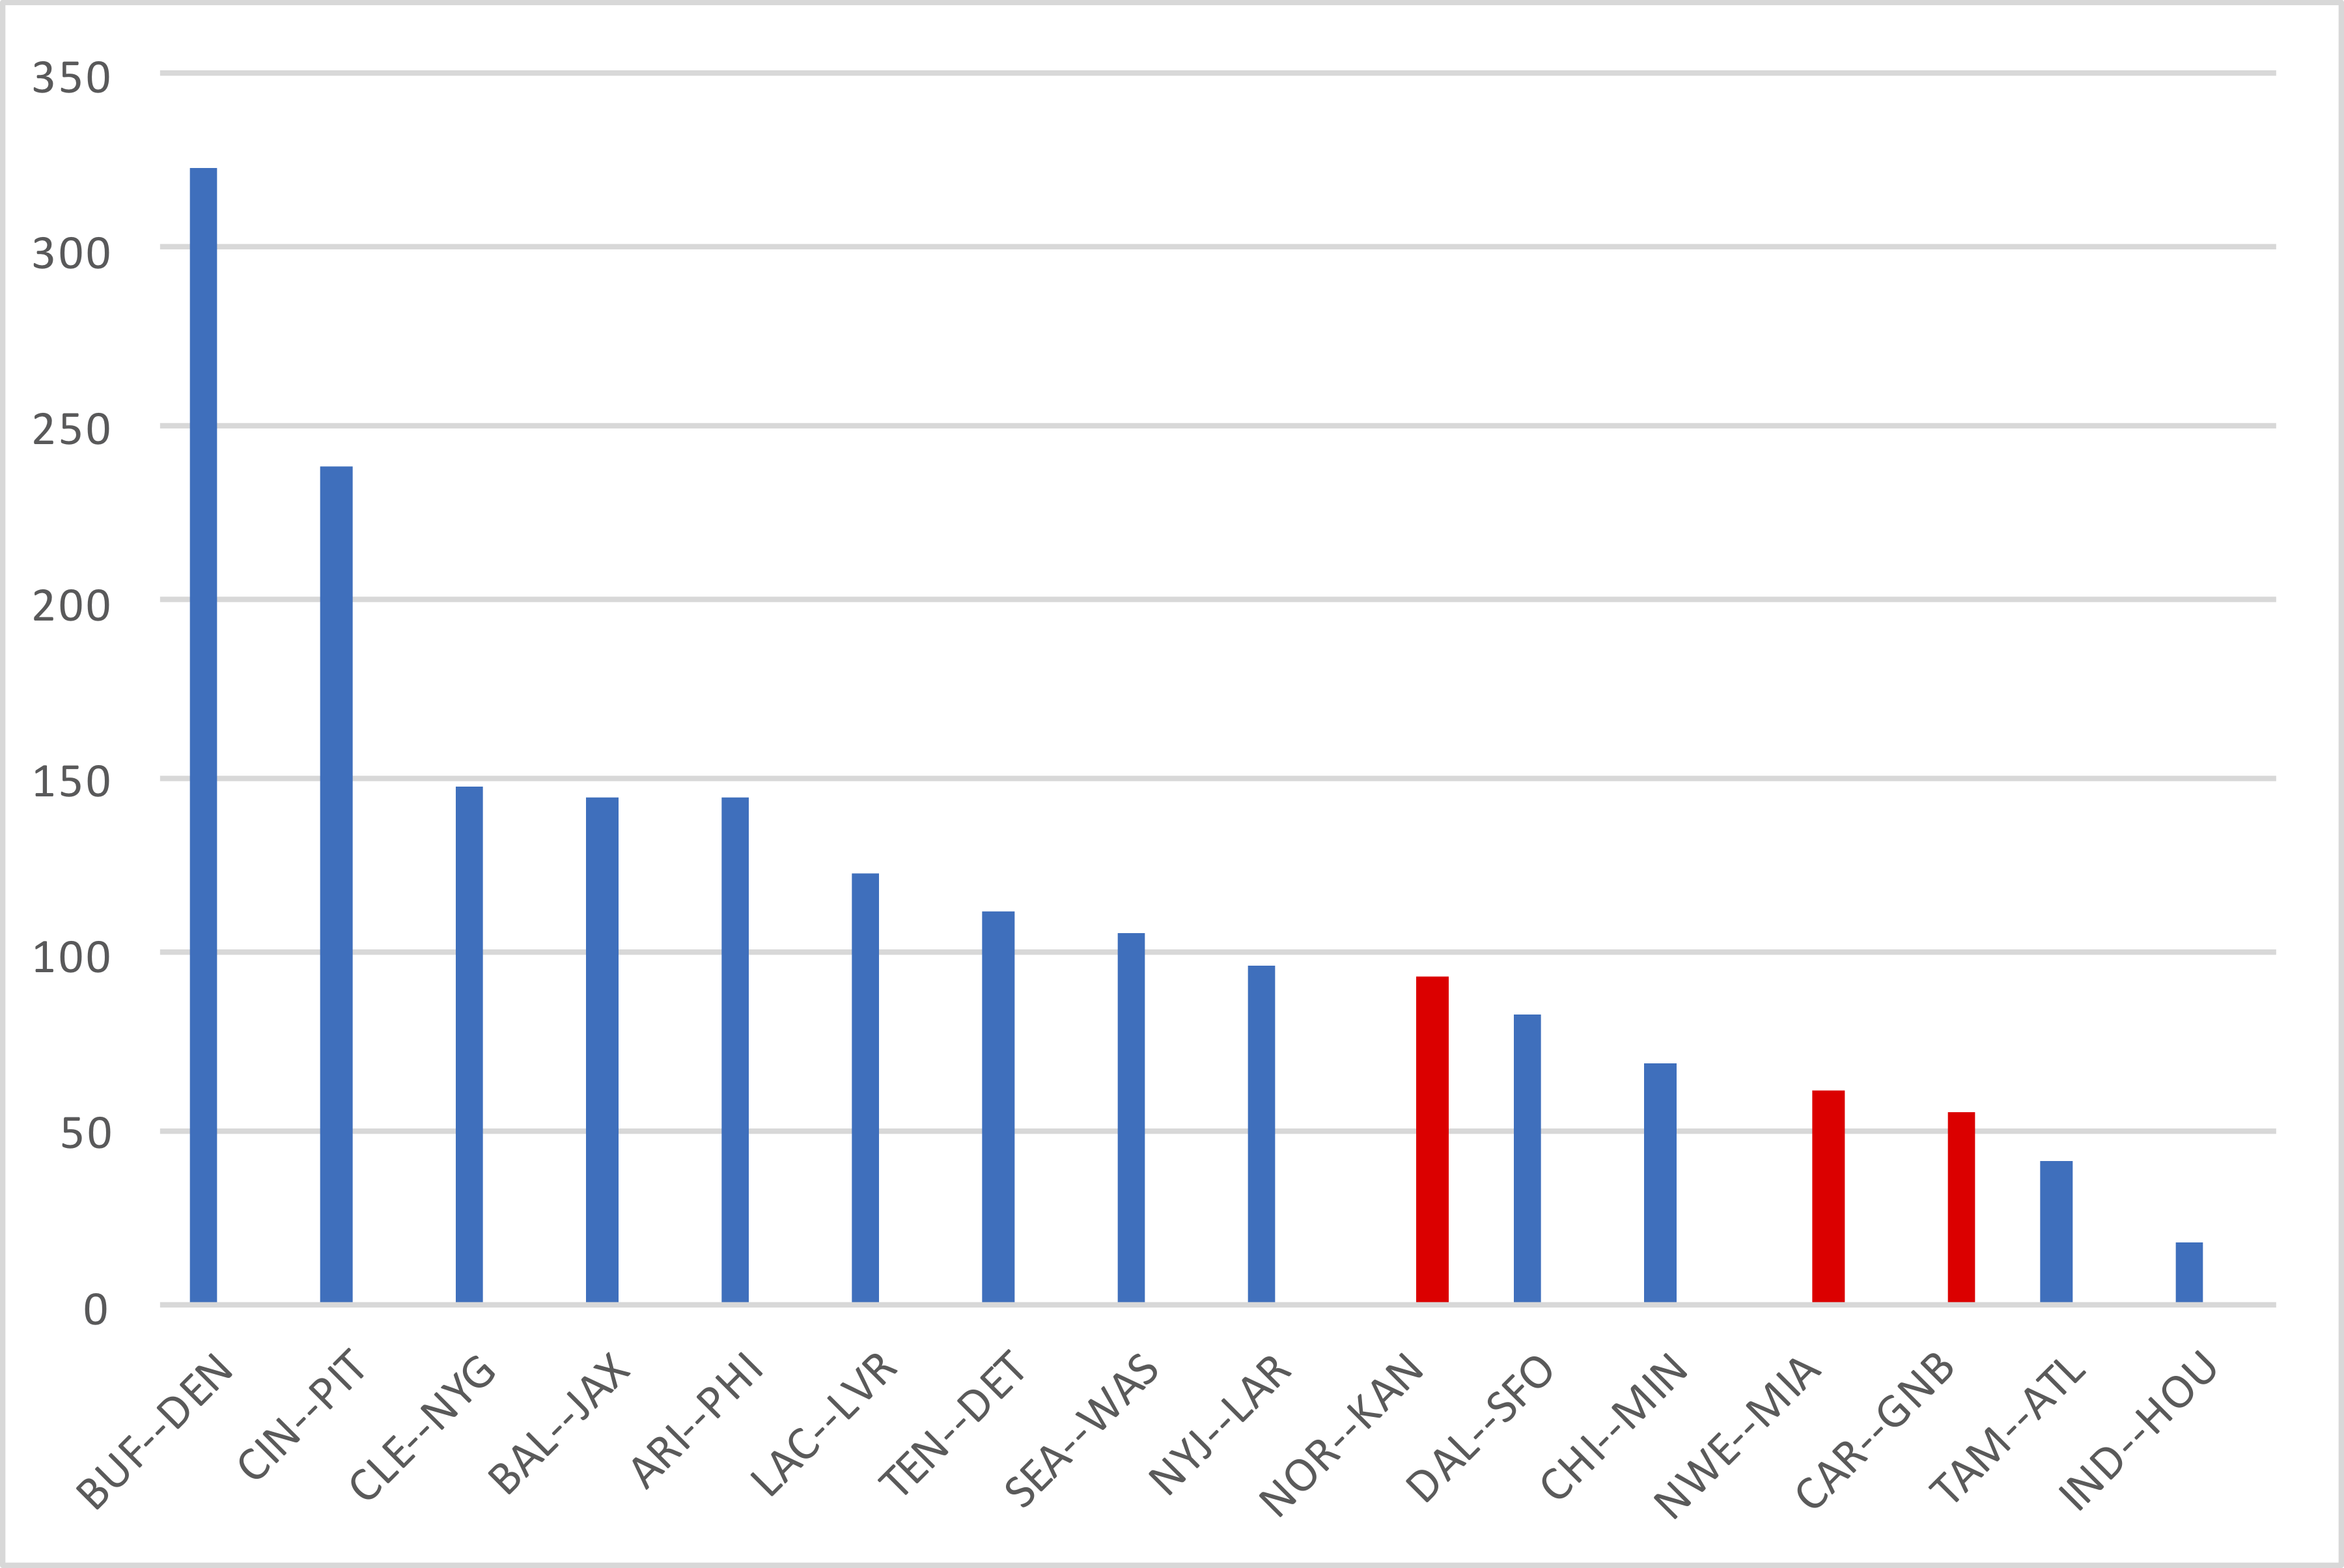
Mahomes did not play well by his standards, but you might be surprised to see the Chiefs on the negative end of the passing differential. Especially since Drew Brees really struggled for most of the game. He was 7 of 24 for 136 yards with 1 TD, 1 INT, and 1 sack when the game was close; on his final ten passes (which didn’t have a meaningful impact the outcome of the game), he went 8/10 for 98 yards with 2 TDs, 5 first downs, and no sacks. Both quarterbacks threw 3 touchdowns and had a turnover, but Mahomes gained only 7 more yards on 16 more dropbacks. Of course, I’d say Mahomes had the better game — KC went 9/18 on third downs, while the Saints were 1/11 — but I can see why the numbers favored Brees and the Saints.
For Rodgers, his passing stats were only slightly worse than Teddy Bridgewater; of course, the biggest play in the game was a fumble at the 1-yard line by Bridgewater. Bridgewater did not have a good game, but Rodgers had a very bad game: Green Bay punted on 6 out of 10 drives despite the Packers running game having a great day.
The Dolphins are the third team on this list to win with the worse passing game, but the explanation is very simple. Miami won with 250 rushing yards, the 2nd most by any team in a non-overtime game against the Belichick Patriots.
Finally, here are the season rankings for all qualifying quarterbacks. Note that the final row (league average) includes non-qualifying passers.
| Rk | Quarterback | Tm | Age | Att | Yds | TD | Int | Sk | Yds | ANY/A | Value |
|---|---|---|---|---|---|---|---|---|---|---|---|
| 1 | Patrick Mahomes * | KAN | 25 | 544 | 4462 | 36 | 5 | 22 | 147 | 8.5 | 1190 |
| 2 | Aaron Rodgers * | GNB | 37 | 477 | 3828 | 40 | 4 | 18 | 162 | 8.66 | 1120 |
| 3 | Ryan Tannehill | TEN | 32 | 430 | 3482 | 31 | 5 | 20 | 144 | 8.3 | 855 |
| 4 | Deshaun Watson * | HOU | 25 | 472 | 4134 | 27 | 6 | 44 | 267 | 8.02 | 837 |
| 5 | Josh Allen * | BUF | 24 | 511 | 4000 | 30 | 9 | 25 | 148 | 7.55 | 619 |
| 6 | Philip Rivers | IND | 39 | 482 | 3735 | 22 | 9 | 14 | 86 | 7.43 | 511 |
| 7 | Derek Carr | LVR | 29 | 445 | 3396 | 24 | 7 | 20 | 116 | 7.41 | 471 |
| 8 | Baker Mayfield | CLE | 25 | 406 | 3082 | 25 | 8 | 18 | 101 | 7.36 | 409 |
| 9 | Drew Brees | NOR | 41 | 332 | 2430 | 21 | 4 | 11 | 79 | 7.55 | 397 |
| 10 | Kirk Cousins | MIN | 32 | 435 | 3569 | 29 | 13 | 34 | 217 | 7.14 | 347 |
| 11 | Russell Wilson * | SEA | 32 | 490 | 3806 | 37 | 13 | 40 | 251 | 7 | 320 |
| 12 | Tom Brady | TAM | 43 | 542 | 3886 | 32 | 11 | 19 | 128 | 6.96 | 315 |
| 13 | Dak Prescott | DAL | 27 | 222 | 1856 | 9 | 4 | 10 | 66 | 7.72 | 306 |
| 14 | Kyler Murray * | ARI | 23 | 497 | 3637 | 26 | 11 | 22 | 143 | 6.78 | 199 |
| 15 | Matthew Stafford | DET | 32 | 494 | 3774 | 23 | 9 | 37 | 249 | 6.74 | 184 |
| 16 | Justin Herbert | LAC | 22 | 531 | 3781 | 27 | 10 | 27 | 171 | 6.63 | 131 |
| 17 | Teddy Bridgewater | CAR | 28 | 441 | 3360 | 14 | 8 | 26 | 165 | 6.67 | 128 |
| 18 | Lamar Jackson | BAL | 23 | 332 | 2461 | 21 | 8 | 29 | 160 | 6.54 | 52 |
| 19 | Jared Goff | LAR | 26 | 509 | 3718 | 20 | 12 | 20 | 143 | 6.49 | 51 |
| 20 | Ryan Fitzpatrick | MIA | 38 | 254 | 1909 | 12 | 8 | 14 | 65 | 6.43 | 10 |
| 21 | Matt Ryan | ATL | 35 | 547 | 4016 | 22 | 11 | 36 | 227 | 6.4 | 5 |
| 22 | Gardner Minshew II | JAX | 24 | 327 | 2259 | 16 | 5 | 27 | 147 | 6.23 | -57 |
| 23 | Mitchell Trubisky | CHI | 26 | 220 | 1538 | 14 | 6 | 16 | 119 | 6.06 | -81 |
| 24 | Tua Tagovailoa | MIA | 22 | 210 | 1359 | 9 | 2 | 16 | 104 | 5.95 | -101 |
| 25 | Ben Roethlisberger | PIT | 38 | 559 | 3462 | 30 | 10 | 12 | 109 | 6.13 | -149 |
| 26 | Nick Mullens | SFO | 25 | 326 | 2437 | 12 | 12 | 19 | 139 | 5.79 | -209 |
| 27 | Joe Burrow | CIN | 24 | 404 | 2688 | 13 | 5 | 32 | 231 | 5.72 | -297 |
| 28 | Andy Dalton | DAL | 33 | 256 | 1549 | 11 | 6 | 16 | 124 | 5.06 | -365 |
| 29 | Cam Newton | NWE | 31 | 328 | 2381 | 5 | 10 | 26 | 152 | 5.31 | -385 |
| 30 | Alex Smith | WAS | 36 | 220 | 1420 | 4 | 6 | 19 | 122 | 4.64 | -421 |
| 31 | Drew Lock | DEN | 24 | 355 | 2330 | 14 | 13 | 15 | 107 | 5.18 | -449 |
| 32 | Dwayne Haskins | WAS | 23 | 213 | 1285 | 5 | 5 | 18 | 135 | 4.44 | -453 |
| 33 | Nick Foles | CHI | 31 | 311 | 1852 | 10 | 8 | 18 | 145 | 4.7 | -557 |
| 34 | Daniel Jones | NYG | 23 | 382 | 2462 | 8 | 9 | 37 | 231 | 4.74 | -694 |
| 35 | Sam Darnold | NYJ | 23 | 298 | 1767 | 6 | 9 | 30 | 191 | 3.94 | -807 |
| 36 | Carson Wentz | PHI | 28 | 437 | 2620 | 16 | 15 | 50 | 326 | 3.98 | -1176 |
| Lg Avg | 0 | 0 | 15747 | 113748 | 757 | 342 | 982 | 6494 | 6.40 | 0 |
Yes, the league average ANY/A right now is 6.40.