
Previously:
There are only a handful of games a year where a quarterback throws 35+ passes and still picks up a first down on half his dropbacks. NFL fans were treated to two of them this week.
On Sunday, 49ers backup Nick Mullens had an outstanding performance despite playing with a depleted roster. The 49ers did not punt or turn the ball over and scored 36 points. The 49ers were just the 14th team since 1970 to pull off that hat trick, and Mullens was a big reason why. Mullens averaged nearly ten yards per attempt, and of his 25 completions, 19 went for first downs. PFR’s passing first down data only goes back to 1999, but this was the most pass attempts in a game by San Francisco in a game where the team picked up a first down on
at least half of their dropbacks (including sacks).
Of course, the next night, Patrick Mahomes had to one up him. Mahomes had 42 pass attempts and did not take a sack; he threw for a first down on 22 of his pass attempts as the Chiefs punted just one time. Mahomes also scrambled four times and picked up two more first downs, including a touchdown. The final tally for Mahomes: 46 plays, 24 first downs, 5 TDs.
Below are the week 3 passing stats.
| Rk | Passer | Team | Opp | Result | Att | Yd | TD | INT | 1D | Sk | Yd | FL | AdjY/DB | DB | VALUE |
|---|---|---|---|---|---|---|---|---|---|---|---|---|---|---|---|
| 1 | Patrick Mahomes | KAN | BAL | W 34-20 | 42 | 385 | 4 | 0 | 22 | 0 | 0 | 0 | 14.93 | 42 | 258 |
| 2 | Nick Mullens | SFO | NYG | W 36-9 | 36 | 343 | 1 | 0 | 19 | 2 | 16 | 0 | 13.39 | 38 | 175 |
| 3 | Philip Rivers | IND | NYJ | W 36-7 | 21 | 217 | 1 | 0 | 13 | 0 | 0 | 0 | 16.43 | 21 | 161 |
| 4 | Aaron Rodgers | GNB | NOR | W 37-30 | 32 | 283 | 3 | 0 | 14 | 1 | 12 | 0 | 13.03 | 33 | 140 |
| 5 | Jared Goff | LAR | BUF | L 32-35 | 32 | 321 | 2 | 1 | 15 | 2 | 10 | 0 | 12.44 | 34 | 124 |
| 6 | Drew Brees | NOR | GNB | L 30-37 | 36 | 288 | 3 | 0 | 14 | 2 | 13 | 0 | 11.42 | 38 | 100 |
| 7 | Russell Wilson | SEA | DAL | W 38-31 | 40 | 315 | 5 | 0 | 15 | 4 | 20 | 0 | 11.02 | 44 | 99 |
| 8 | Matthew Stafford | DET | ARI | W 26-23 | 31 | 270 | 2 | 0 | 16 | 4 | 38 | 0 | 11.37 | 35 | 91 |
| 9 | Tom Brady | TAM | DEN | W 28-10 | 38 | 297 | 3 | 0 | 12 | 2 | 12 | 0 | 10.65 | 40 | 75 |
| 10 | Ryan Fitzpatrick | MIA | JAX | W 31-13 | 20 | 160 | 2 | 0 | 9 | 1 | 4 | 0 | 12.33 | 21 | 75 |
| 11 | Teddy Bridgewater | CAR | LAC | W 21-16 | 28 | 235 | 1 | 0 | 10 | 2 | 14 | 0 | 10.73 | 30 | 58 |
| 12 | Baker Mayfield | CLE | WAS | W 34-20 | 23 | 156 | 2 | 0 | 12 | 2 | 14 | 0 | 10.88 | 25 | 52 |
| 13 | Ryan Tannehill | TEN | MIN | W 31-30 | 37 | 321 | 0 | 1 | 13 | 1 | 11 | 0 | 10.05 | 38 | 48 |
| 14 | Deshaun Watson | HOU | PIT | L 21-28 | 27 | 264 | 2 | 1 | 12 | 5 | 33 | 0 | 9.88 | 32 | 35 |
| 15 | Kirk Cousins | MIN | TEN | L 30-31 | 27 | 251 | 3 | 2 | 11 | 2 | 13 | 0 | 9.66 | 29 | 25 |
| 16 | Josh Allen | BUF | LAR | W 35-32 | 33 | 311 | 4 | 1 | 14 | 4 | 37 | 1 | 9.43 | 37 | 24 |
| 17 | Ben Roethlisberger | PIT | HOU | W 28-21 | 36 | 237 | 2 | 0 | 13 | 2 | 19 | 0 | 9.39 | 38 | 23 |
| 18 | Dak Prescott | DAL | SEA | L 31-38 | 57 | 472 | 3 | 2 | 20 | 2 | 11 | 1 | 9.05 | 59 | 16 |
| 19 | Joe Burrow | CIN | PHI | T 23-23 | 44 | 312 | 2 | 0 | 19 | 8 | 56 | 0 | 8.63 | 52 | -8 |
| 20 | Jacoby Brissett | IND | NYJ | W 36-7 | 4 | 17 | 0 | 0 | 1 | 0 | 0 | 0 | 6.50 | 4 | -9 |
| 21 | Derek Carr | LVR | NWE | L 20-36 | 32 | 261 | 2 | 0 | 13 | 2 | 12 | 2 | 8.47 | 34 | -11 |
| 22 | Nick Foles | CHI | ATL | W 30-26 | 29 | 188 | 3 | 1 | 7 | 0 | 0 | 0 | 8.24 | 29 | -16 |
| 23 | Kyler Murray | ARI | DET | L 23-26 | 35 | 270 | 2 | 3 | 16 | 1 | 2 | 0 | 8.31 | 36 | -17 |
| 24 | Matt Ryan | ATL | CHI | L 26-30 | 38 | 238 | 1 | 1 | 13 | 2 | 11 | 0 | 7.75 | 40 | -41 |
| 25 | Justin Herbert | LAC | CAR | L 16-21 | 49 | 330 | 1 | 1 | 18 | 2 | 11 | 1 | 7.78 | 51 | -51 |
| 26 | Brett Rypien | DEN | TAM | L 10-28 | 9 | 53 | 0 | 1 | 2 | 1 | 0 | 0 | 2.60 | 10 | -62 |
| 27 | Mitchell Trubisky | CHI | ATL | W 30-26 | 22 | 128 | 1 | 1 | 7 | 2 | 9 | 0 | 6.17 | 24 | -63 |
| 28 | Cam Newton | NWE | LVR | W 36-20 | 28 | 162 | 1 | 1 | 8 | 2 | 6 | 0 | 6.47 | 30 | -70 |
| 29 | Gardner Minshew II | JAX | MIA | L 13-31 | 42 | 275 | 0 | 1 | 14 | 4 | 29 | 1 | 6.02 | 46 | -127 |
| 30 | Jeff Driskel | DEN | TAM | L 10-28 | 30 | 176 | 1 | 1 | 7 | 5 | 45 | 0 | 4.57 | 35 | -147 |
| 31 | Daniel Jones | NYG | SFO | L 9-36 | 32 | 179 | 0 | 1 | 8 | 2 | 14 | 1 | 4.18 | 34 | -157 |
| 32 | Sam Darnold | NYJ | IND | L 7-36 | 29 | 168 | 1 | 3 | 7 | 2 | 17 | 0 | 2.90 | 31 | -182 |
| 33 | Dwayne Haskins | WAS | CLE | L 20-34 | 37 | 224 | 2 | 3 | 12 | 3 | 18 | 1 | 3.78 | 40 | -200 |
| 34 | Lamar Jackson | BAL | KAN | L 20-34 | 28 | 97 | 1 | 0 | 5 | 4 | 27 | 1 | 2.38 | 32 | -205 |
| 35 | Carson Wentz | PHI | CIN | T 23-23 | 47 | 225 | 1 | 2 | 11 | 3 | 19 | 0 | 4.52 | 50 | -213 |
| Total | Total | 1131 | 8429 | 62 | 28 | 422 | 81 | 553 | 9 | 8.78 | 1212 |
In what has become a common theme, the bottom of the list features the NFC East quarterbacks in the eastern time zone. But you will also see the presence of the game’s reigning NFL MVP. This was one of the worst passing games in Ravens history, and that’s saying something. The team averaged just 2.2 net yards per attempt, and threw for only 70 yards and 5 first downs on 32 dropbacks. What was billed as the game of the year and a showdown between the best quarterback of the 2019 regular season and 2019 postseason turned into the biggest mismatch of the week.
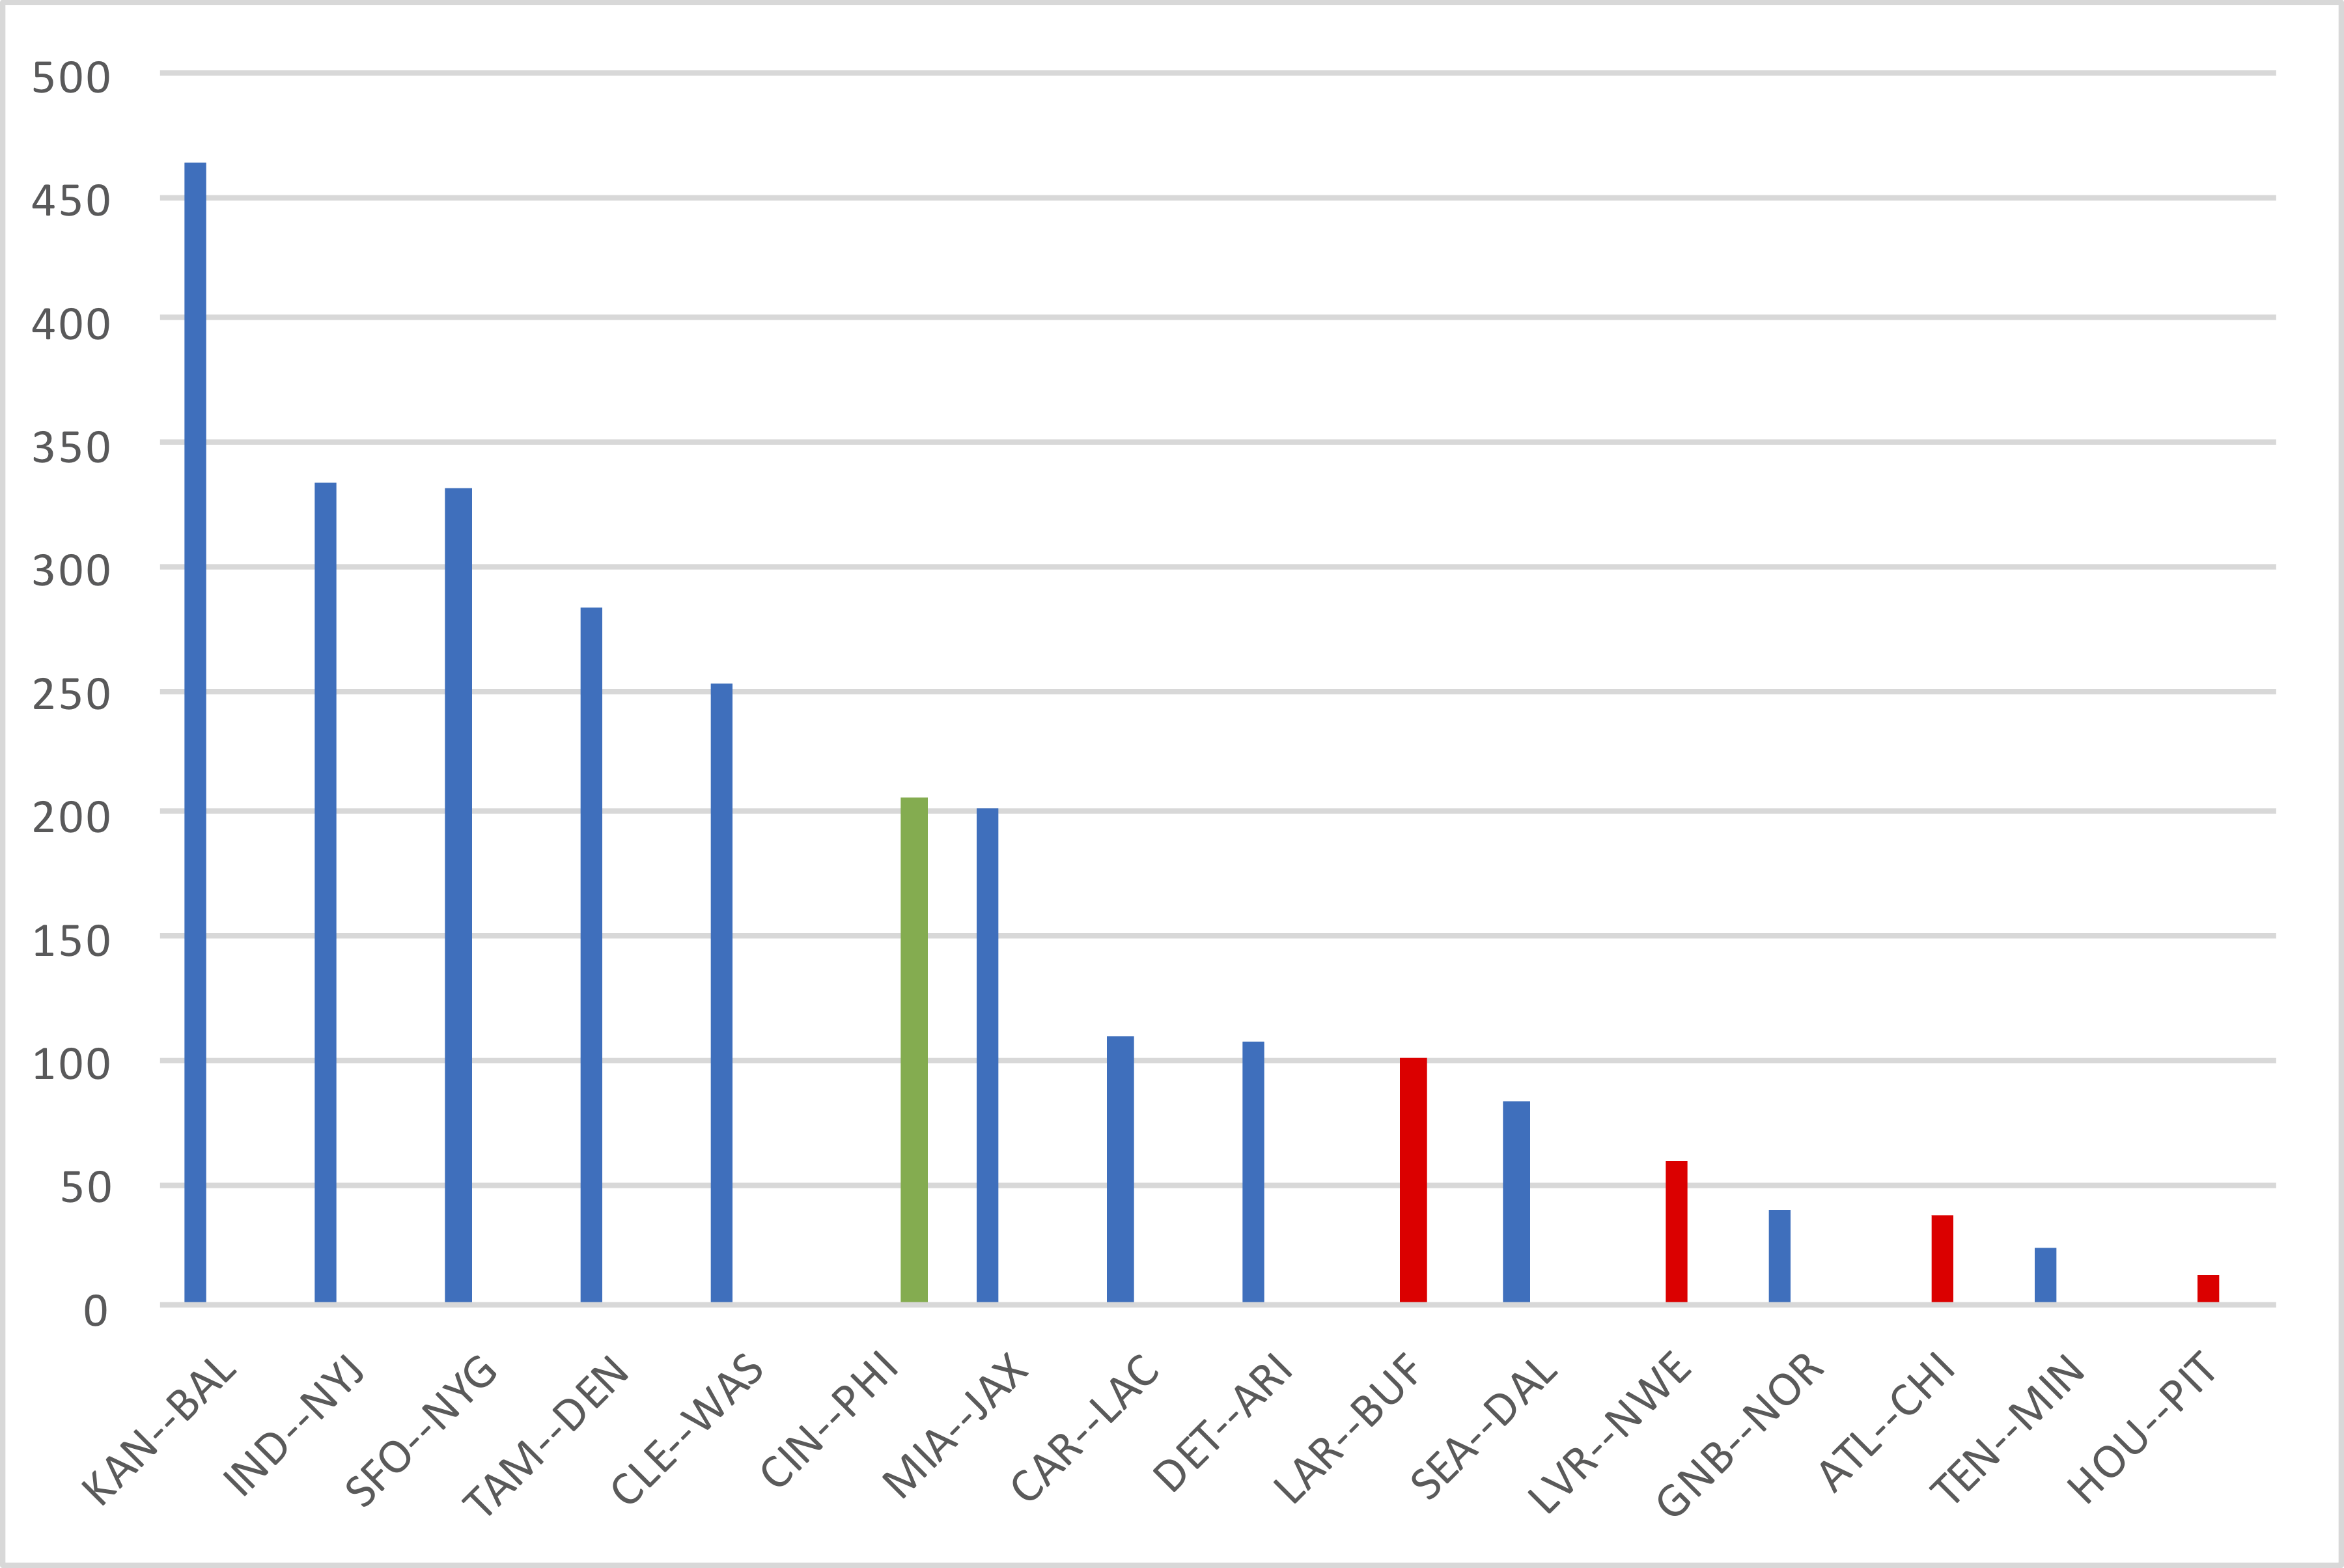
The graph below shows the adjusting passing yardage differential between the winner and loser (or tying teams!) in each game.
Please leave your thoughts in the comments.