
In week 1 of the 2019 season, Lamar Jackson had a breakout performance that foreshadowed his MVP season. And while his performance in week 1 of the 2020 season wasn’t quite as dominant, it still was the most effective passing performance — at least, statistically — of any quarterback in week one.
I like to post the weekly passing numbers and analyze which quarterbacks had the most valuable stat lines. I am going to tweak the formula a bit this year. The normal formula is based on Adjusted Net Yards per Attempt, which is (Passing Yards + 20*Passing TDs – 45*INTs – Sack Yards Lost) divided by (Pass Attempts + Sacks). But this year, I will make a couple of changes. I will incorporate a first down bonus of 9 yards, and since all touchdowns are also first downs, that means the multiplier on touchdowns will be 11 instead of 20. In addition, I am going to include a penalty of 50 yards for fumbles. So the new formula is (Passing Yards + 9 * Pass 1st Downs + 11 * Pass TDs – 45 * INTs – 50 * Fumbles Lost) divided by (Pass Attempts + Sacks).
Baltimore’s third-year quarterback went 20/25 for 275 yards with 3 TDs and 0 INTs against the Browns, while taking 2 sack and losing 14 yards. That means Jackson had 429 Adjusted Yards on 27 dropbacks, or 15.89 Adjusted Yards per Dropback. Overall, passers in week 1 averaged 9.20 Adjusted Yards per Dropback. To calculate passing value, we multiply that difference (15.89 – 9.20) by Jackson’s 27 dropbacks. Therefore, Jackson added 181 adjusted yards over average this week, the best of any passer. The way this formula works, all passers will sum to zero value over the week, since we are measuring value compared to average.
That means some quarterbacks will have to fare poorly, and nobody did worse than Carson Wentz. The Eagles passer went 24/42 for 270 passing yards, with 2 TDs, but that’s where the good stats end. Wentz threw 2 INTs and lost a fumble, and was sacked a whopping 8 times and lost 62 yards, and only picked up 13 first downs on his 50 dropbacks. Wentz averaged 4.14 Adjusted Yards per Dropback, which means he produced -253 Adjusted Yards relative to league average.
The full week 1, 2020, passing stats below:
| Rk | Name | Team | Opp | Result | Att | Yd | TD | INT | 1D | Sk | Yd | FL | AdjY/DB | DB | VALUE |
|---|---|---|---|---|---|---|---|---|---|---|---|---|---|---|---|
| 1 | Lamar Jackson | BAL | CLE | W 38-6 | 25 | 275 | 3 | 0 | 15 | 2 | 14 | 0 | 15.89 | 27 | 181 |
| 2 | Aaron Rodgers | GNB | MIN | W 43-34 | 44 | 364 | 4 | 0 | 17 | 0 | 0 | 0 | 12.75 | 44 | 156 |
| 3 | Russell Wilson | SEA | ATL | W 38-25 | 35 | 322 | 4 | 0 | 15 | 3 | 23 | 0 | 12.58 | 38 | 128 |
| 4 | Matt Ryan | ATL | SEA | L 25-38 | 54 | 450 | 2 | 1 | 23 | 2 | 16 | 0 | 11.04 | 56 | 103 |
| 5 | Kirk Cousins | MIN | GNB | L 34-43 | 25 | 259 | 2 | 1 | 12 | 2 | 11 | 0 | 12.33 | 27 | 85 |
| 6 | Patrick Mahomes | KAN | HOU | W 34-20 | 32 | 211 | 3 | 0 | 16 | 1 | 8 | 0 | 11.52 | 33 | 76 |
| 7 | Derek Carr | LVR | CAR | W 34-30 | 30 | 239 | 1 | 0 | 11 | 0 | 0 | 0 | 11.63 | 30 | 73 |
| 8 | Teddy Bridgewater | CAR | LVR | L 30-34 | 34 | 270 | 1 | 0 | 13 | 1 | 10 | 0 | 11.09 | 35 | 66 |
| 9 | Gardner Minshew II | JAX | IND | W 27-20 | 20 | 173 | 3 | 0 | 11 | 4 | 23 | 0 | 11.75 | 24 | 61 |
| 10 | Ben Roethlisberger | PIT | NYG | W 26-16 | 32 | 229 | 3 | 0 | 14 | 2 | 21 | 0 | 10.79 | 34 | 54 |
| 11 | Mitchell Trubisky | CHI | DET | W 27-23 | 36 | 242 | 3 | 0 | 15 | 1 | 28 | 0 | 10.32 | 37 | 42 |
| 12 | Taysom Hill | NOR | TAM | W 34-23 | 1 | 38 | 0 | 0 | 1 | 0 | 0 | 0 | 47.00 | 1 | 38 |
| 13 | Jared Goff | LAR | DAL | W 20-17 | 31 | 275 | 0 | 1 | 12 | 1 | 6 | 0 | 10.38 | 32 | 38 |
| 14 | Drew Lock | DEN | TEN | L 14-16 | 33 | 216 | 1 | 0 | 12 | 0 | 0 | 0 | 10.15 | 33 | 31 |
| 15 | Jimmy Garoppolo | SFO | ARI | L 20-24 | 33 | 259 | 2 | 0 | 10 | 3 | 16 | 0 | 9.86 | 36 | 24 |
| 16 | Cam Newton | NWE | MIA | W 21-11 | 19 | 155 | 0 | 0 | 8 | 2 | 15 | 0 | 10.10 | 21 | 19 |
| 17 | Ryan Tannehill | TEN | DEN | W 16-14 | 43 | 249 | 2 | 0 | 17 | 1 | 2 | 0 | 9.59 | 44 | 17 |
| 18 | Philip Rivers | IND | JAX | L 20-27 | 46 | 363 | 1 | 2 | 17 | 0 | 0 | 0 | 9.50 | 46 | 14 |
| 19 | Robert Griffin III | BAL | CLE | W 38-6 | 1 | 9 | 0 | 0 | 1 | 0 | 0 | 0 | 18.00 | 1 | 9 |
| 20 | Tyrod Taylor | LAC | CIN | W 16-13 | 30 | 208 | 0 | 0 | 10 | 2 | 1 | 0 | 9.28 | 32 | 3 |
| 21 | Dak Prescott | DAL | LAR | L 17-20 | 39 | 266 | 1 | 0 | 14 | 3 | 22 | 0 | 9.07 | 42 | -5 |
| 22 | Deshaun Watson | HOU | KAN | L 20-34 | 32 | 253 | 1 | 1 | 13 | 4 | 11 | 0 | 9.03 | 36 | -6 |
| 23 | Jacoby Brissett | IND | JAX | L 20-27 | 0 | 0 | 0 | 0 | 0 | 1 | 6 | 0 | -6.00 | 1 | -15 |
| 24 | Matthew Stafford | DET | CHI | L 23-27 | 42 | 297 | 1 | 1 | 14 | 1 | 9 | 0 | 8.84 | 43 | -16 |
| 25 | Drew Brees | NOR | TAM | W 34-23 | 30 | 160 | 2 | 0 | 9 | 1 | 9 | 0 | 8.19 | 31 | -31 |
| 26 | Dwayne Haskins | WAS | PHI | W 27-17 | 31 | 178 | 1 | 0 | 11 | 3 | 19 | 0 | 7.91 | 34 | -44 |
| 27 | Daniel Jones | NYG | PIT | L 16-26 | 41 | 279 | 2 | 2 | 16 | 3 | 17 | 0 | 7.68 | 44 | -67 |
| 28 | Josh Allen | BUF | NYJ | W 27-17 | 46 | 312 | 2 | 0 | 17 | 3 | 6 | 2 | 7.78 | 49 | -70 |
| 29 | Kyler Murray | ARI | SFO | W 24-20 | 40 | 230 | 1 | 1 | 12 | 2 | 6 | 0 | 7.10 | 42 | -88 |
| 30 | Joe Burrow | CIN | LAC | L 13-16 | 36 | 193 | 0 | 1 | 14 | 3 | 20 | 0 | 6.51 | 39 | -105 |
| 31 | Sam Darnold | NYJ | BUF | L 17-27 | 35 | 215 | 1 | 1 | 8 | 3 | 13 | 0 | 6.32 | 38 | -110 |
| 32 | Tom Brady | TAM | NOR | L 23-34 | 36 | 239 | 2 | 2 | 10 | 3 | 15 | 0 | 6.31 | 39 | -113 |
| 33 | Ryan Fitzpatrick | MIA | NWE | L 11-21 | 30 | 191 | 0 | 3 | 11 | 1 | 9 | 0 | 4.71 | 31 | -139 |
| 34 | Baker Mayfield | CLE | BAL | L 6-38 | 39 | 189 | 1 | 1 | 10 | 2 | 21 | 0 | 5.46 | 41 | -153 |
| 35 | Carson Wentz | PHI | WAS | L 17-27 | 42 | 270 | 2 | 2 | 13 | 8 | 62 | 1 | 4.14 | 50 | -253 |
| Total | 1123 | 8078 | 52 | 20 | 422 | 68 | 439 | 3 | 9.20 | 1191 |
Notes.
- Lamar Jackson picked up a first down on 56% of his dropbacks, the only passer to top 50% in week one. Meanwhile, his two 2018 classmates were on the other end of the spectrum. Sam Darnold, the third overall pick in that Draft, threw for a first down on only 21% of his dropbacks; Baker Mayfield, the first overall pick, had the second-worst rate in week 1 at just 24%. Add in Saquon Barkley and his 15-carries-for-6 yards stat line, and it was an awful week for the top three picks in the 2018 Draft.
- Gardner Minshew II had a remarkable game, although the conventional stat line overstates things a bit. He went 19/20, which sounds like an insanely efficient performance. But he took 3 sacks and “only” 11 on his completions went for first downs (which is just an average rate of turning completions into first downs); as a result, Minshew picked up a first down on 46% of his pass plays. That’s a great result, but it was behind both Jackson and Patrick Mahomes, who quietly picked up a first down on 48% of his passing plays in a low-octane (for him) win over the Texans.
- Mitchell Trubisky had a nice 4th quarter, but I am writing to alert you to an important fact: his 28 yards lost on 1 sack was not a typo.
- It was a good passing week overall, as you might suspect. To use more traditional stats, the NFL had an overall passer rating of 95.5 and averaged 6.54 ANY/A. But those numbers are slightly down from the wild week 1 we saw last year.
For the most part, the team with the passing advantage will win the game. There was one notable outlier in week 1, and it came in the NFC West battle featuring Kyler Murray and Jimmy Garoppolo. This was the rare game where the running game tipped the scales, although much of that has to do with Murray. [1]I’ll also note that passing stats are not always quarterback stats. Garoppolo had, as he often does, a ton of yards after the catch. His 8.5 yards after the catch per completion was the … Continue reading The Cardinals quarterback rushed 11 times for 100 yards with 4 first downs including one touchdown. [2]Excluding kneels. Overall, Arizona rushed 34 times for 189 yards and 13 first downs, while the 49ers rushed 25 times for 123 yards and 6 first downs. San Francisco also went 0/2 on two crucial fourth downs, and either of those could have tipped the scales.
The graph below shows the Adjusted Passing Value differential for each game. The winning team is in blue.
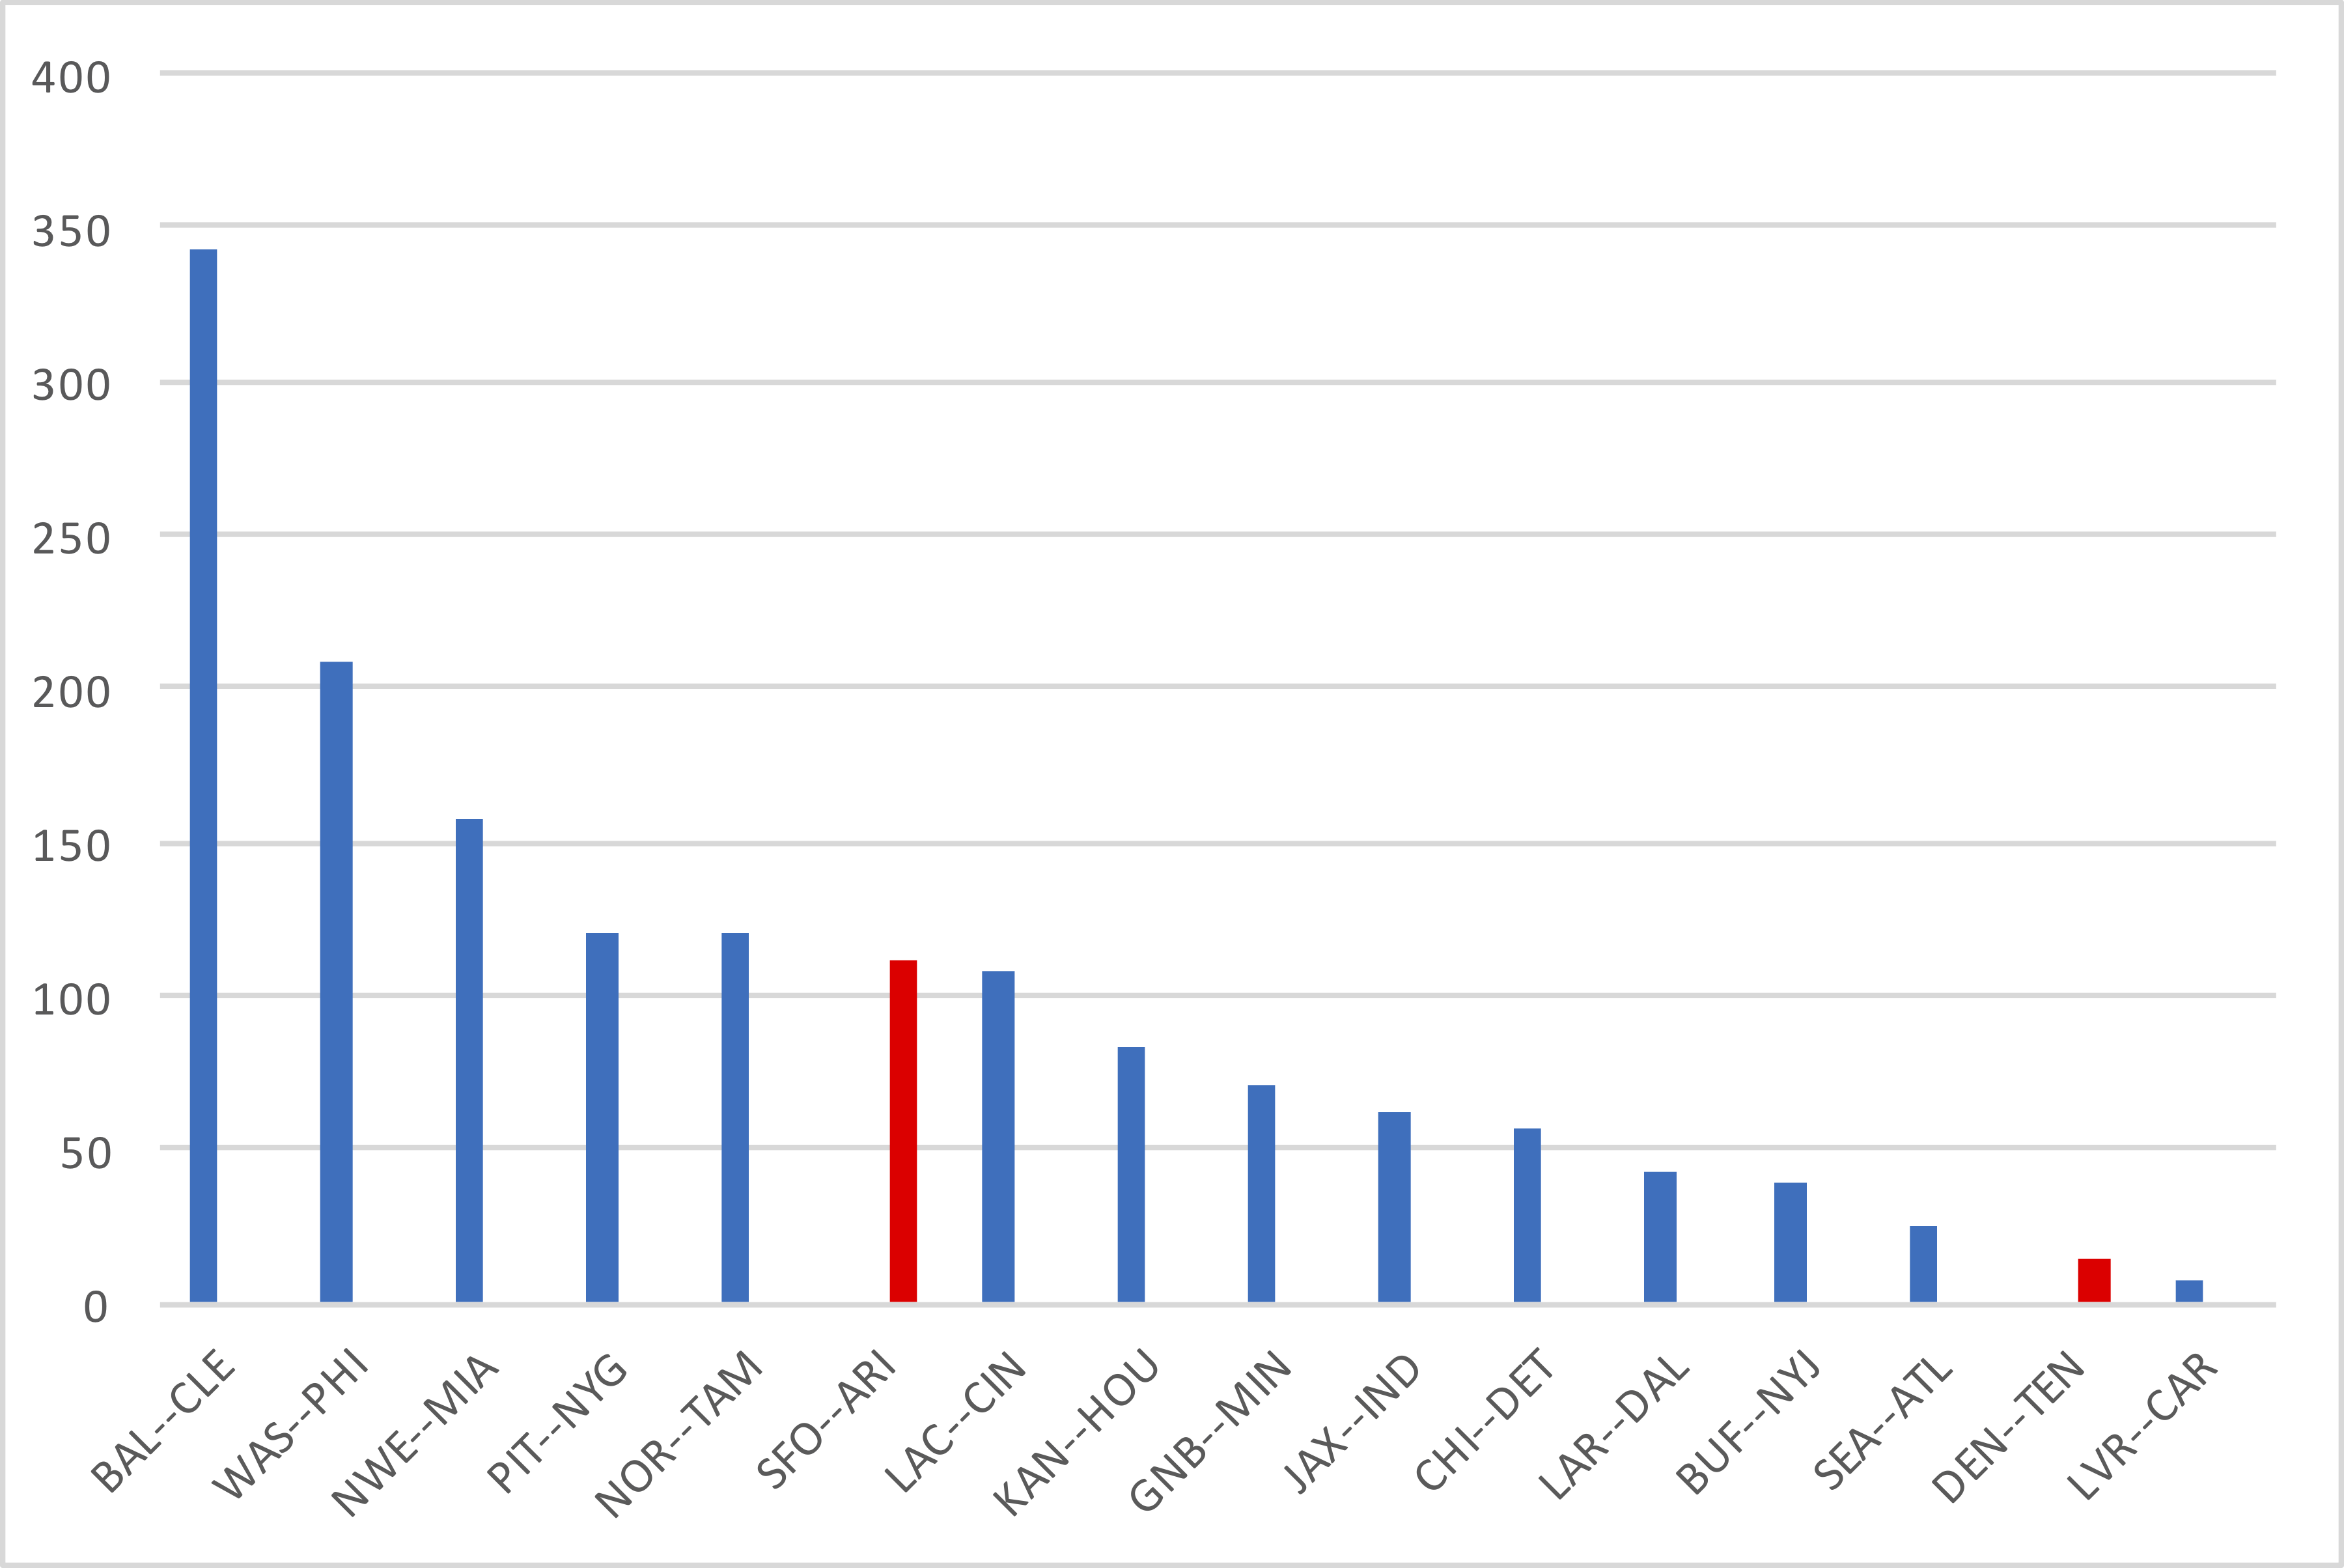
What stands out to you?
References
| ↑1 | I’ll also note that passing stats are not always quarterback stats. Garoppolo had, as he often does, a ton of yards after the catch. His 8.5 yards after the catch per completion was the second-highest of the week, and it included 71 yards on one touchdown pass to Raheem Mostert. |
|---|---|
| ↑2 | Excluding kneels. |