
Previously:
You remember Brian St. Pierre, don’t you? The former Boston College star was drafted by the Steelers in the 5th round of the 2003 Draft, and then bounced around the league for years without ever starting a game. In 2010, the Carolina Panthers drafted Jimmy Claussen in the second round, but that didn’t stop the quarterback problems that plagued the team. Carolina bottomed out under John Fox, going 2-14 and setting the team up to draft Cam Newton the following April. Claussen was terrible as a rookie and a shoulder injury to Matt Moore left the Panthers down to their third string quarterback, rookie Tony Pike.
At the time, St. Pierre was holding down one of the world’s most noble positions: stay at home dad. But with Moore’s shoulder injury ending his season, and Claussen dealing with a concussion, St. Pierre was signed to compete with Pike. During practice this week, St. Pierre “won” the job, and that meant the former B.C. star would finally start an NFL game: just one week shy of his 31st birthday! The results, however, were not straight out of a fairy tale. [continue reading…]
Previously:
In week 8 — which was nearly two weeks ago, my apologies — there were three teams that really leaned on the ground game. Buffalo never led by more than 8 points against New England, and the game was very close throughout. Despite this, the Bills ran on two-thirds of their plays. Buffalo running backs Devin Singletary and Zack Moss carried 28 times for 167 yards and two touchdowns, while Josh Allen struggled most of the day as a passer. And, as you might have guessed, Allen contributed as a runner: he had three scrambles for 24 yards and three more designed runs (he finished with 10 carries on the day, owing to four kneels). But a 2-to-1 run/pass ratio in a 3-point win is almost unheard of in the modern era, absent crazy weather or a running quarterback. Had I published this article on time, I could have had scathing criticism for Allen as a passer or the Bills offensive design, but in week 9, the Bills went super pass-heavy and won(more on this later in the week). So consider this a one-week anomaly, or a reaction to the Patriots defense (or both). [continue reading…]
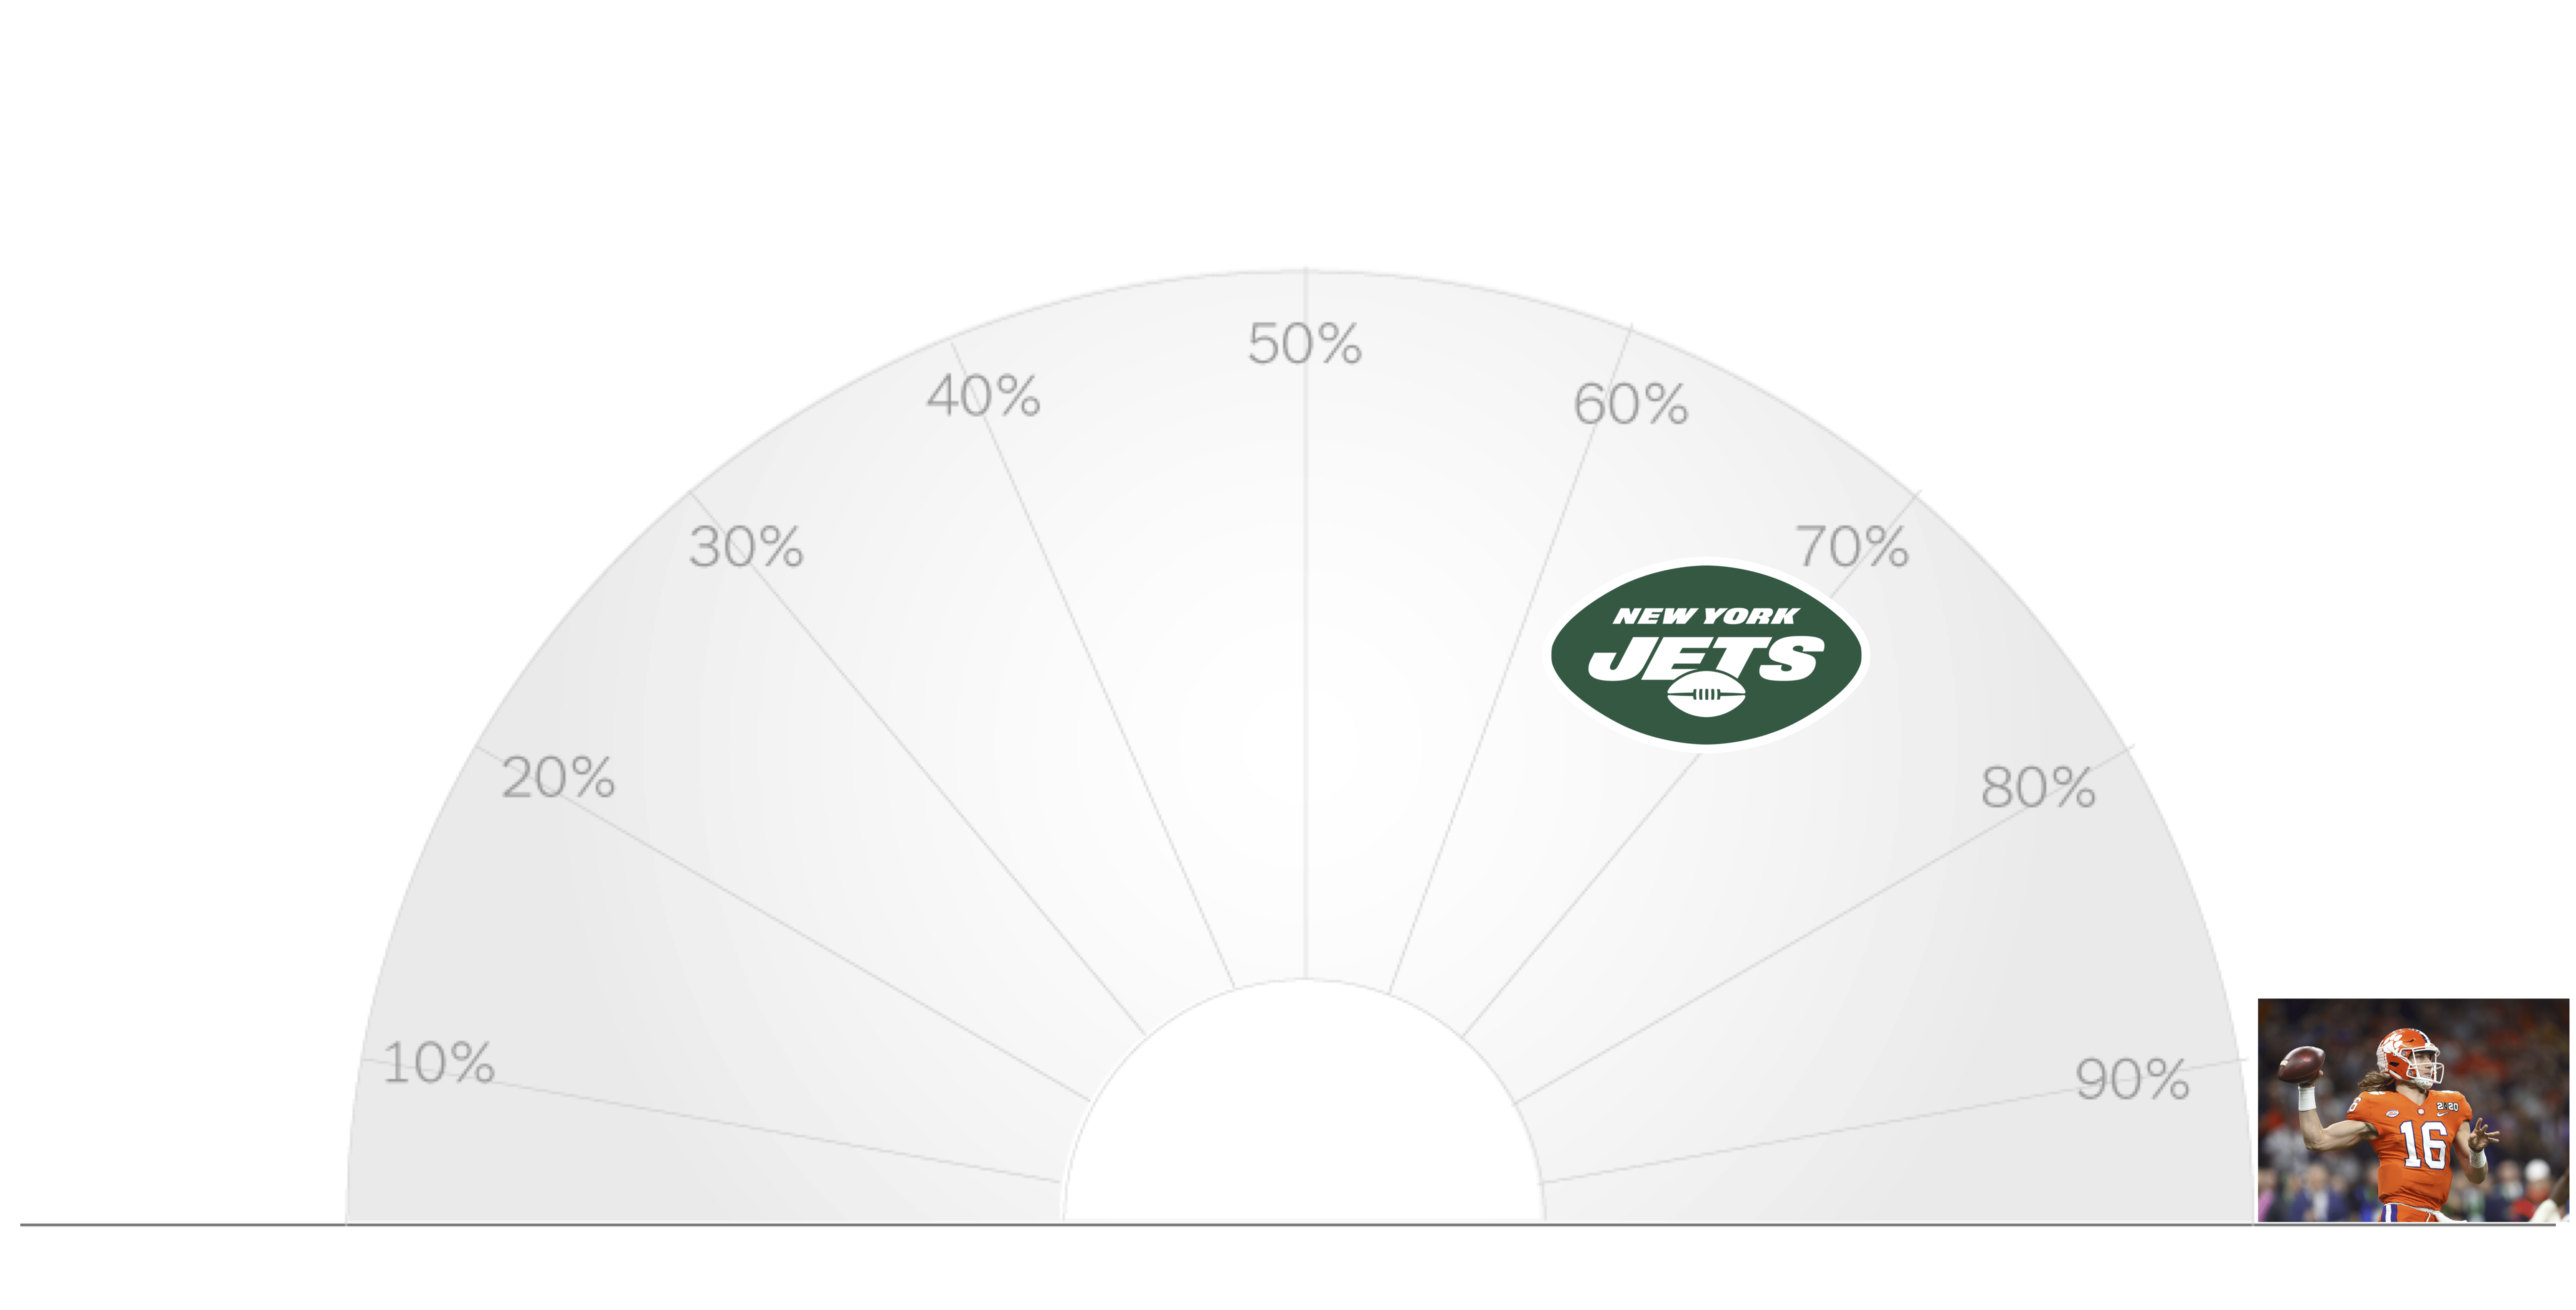 The Jets are 0-8 and in the pilot’s seat for the #1 pick in the 2021 NFL Draft. The Jaguars have lost seven straight games and have a difficult remaining schedule; Jacksonville is in the co-pilot seat with a realistic chance to take the top spot. It’s difficult to imagine the Jets going 3-5 down the stretch, and even a 2-6 finish may be optimistic. But what if the Jets and Jaguars finish with the same record, either at 1-15 or 2-14? Who would get Trevor Lawrence?
The first tiebreaker is strength of schedule, with the team having the easier schedule winning the better draft pick. The logic being if two teams have the same record, the team that did so against a weaker schedule is probably the worse team. So if you are a Jets fan, you probably should be worried that right now, the Jets project to have the toughest schedule in the NFL as of the end of the 2020 season. That leaves no margin for error in the Tank for Trevor. The Jets face the NFC West, the AFC West, the Colts and the Browns, along with the other teams in the AFC East… while also giving 14-16 of those teams one free win. So it’s not surprising that the Jets project to have the toughest schedule.
But is there a change the Jaguars schedule leapfrogs the Jets for the toughest? Let’s compare the two teams schedules.
Ignore the Browns and Chargers
The Jets play all teams in the AFC West while the Jaguars play the full AFC North. But the Jets also play the Browns and the Jaguars also play the Chargers, so these are two common opponents that we can ignore.
There are two other common opponents — the Jets play the Colts and the Jaguars play the Dolphins, but those teams still matter since the other team plays that opponent two times.
The other 14 games
I looked at Football Outsiders projected wins for each team. Here is each opponent for the Jets and Jaguars, from best to worst: [continue reading…]
Previously:
It was 18 years ago that Herm Edwards made his famous “You Play To Win The Game” speech. That came after the Jets had a loss in their 7th game of the season, dropping the team’s record to 2-5.
With that backdrop, let’s move on to some…. curious…. coaching decisions after seven weeks of the 2020 NFL season.
Before getting to the data, I want you to think about how the following game would unfold. A team trails by at least 14 points at halftime and ultimately loses by at least 21 points. This is your classic blowout, a game that wasn’t competitive for very long. Now, how frequently would you expect the losing team to pass? From a Game Scripts perspective, this is obviously a game that would heavily incentive throwing the football. However, sometimes teams just give up. [continue reading…]
Over the last three and a half seasons, the Giants have the worst record in football. In fact, it’s not particularly close: since the start of the 2017 season, the Giants are 13-42. The Jets have the second worst mark, at 16-39, the Bengals are 16-38-1, and every other team has a winning percentage at least 10% higher than the Giants.
But does it feel like the Giants have been by far the worst team in the NFL? Probably not: they’ve been bad, but not even necessarily all that noticeably bad. And I think the biggest reason for that is New York has been relatively competitive over this stretch. The Giants don’t even rank in the bottom three in points differential since the start of the 2017 season: the Jets, Raiders, and Dolphins all have fared worse. Along with Tampa Bay (more on them in a moment), the Giants have been a large outlier in terms of underperforming, at least when we measure their points scored and points allowed numbers relative to their winning percentage. [continue reading…]
Ryan Fitzpatrick has been benched in Miami in favor of Tua Tagovila. This doesn’t come as a big surprise, of course: Fitzpatrick is a 38-year-old journeyman who is always on the verge of being benched for the next big thing.
But Fitzpatrick’s career has been fascinating to watch. I calculated his Adjusted Net Yards per Attempt for each game of his career, and then compared that to league average for that season. That is plotted in the graph below: the X-axis is each game of his career in chronological order, the Y-Axis is how many Adjusted Net Yards of value he added over average, and the size of the dot represents how many dropbacks he had. And, of course, given that this is Fitzpatrick, it is color-coded by team: [continue reading…]
Previously:
Passing efficiency was way down in week 6. While passing stats were outstanding at the beginning of the season, the league-wide passer rating this week was just 85.4. There were only 46 touchdown passes and a whopping 28 interceptions along with 55 sacks, while completion percentage was just 61.3%. Nowhere was the efficiency drop more obvious than with Aaron Rodgers, who had arguably the worst game of his career. He averaged 0.72 ANY/A, the first time in his career he’s been under 1.0 ANY/A for a game since he became a starter. He and Joe Flacco battled it out for the worst performance of the week, with the Jets new starter only having the advantage of a higher number of below-average passing plays. Flacco also produced an unholy 15% passing first down rate, easily the worst mark of the week.
Matt Ryan, Deshaun Watson, and Jimmy Garoppolo were the top passers in a down week. Each averaged over 13.0 Adjusted Yards per Dropback, and Garoppolo in particular had a huge turnaround from his disastrous week five performance. The 49ers had the best passing first down rate of the week at 48%; San Francisco has been all over the map this season in terms of passing first down rate, including a 50% rate in week 3 and a 20% rate in week 5. Ryan was brilliant and had his 8th game with 4 TDs and 0 INTs; perhaps the most remarkable thing about that stat is this was just his fifth win in those games. As for Watson, more on him in a moment.
Below are the week 6 passing stats. [continue reading…]
Previously:
You might not expect Nick Foles and Tom Brady — at least, the 2020 versions of those guys — to engage in an all out aerial assault. And while the quality wasn’t there, the quantity certainly was: combined, the two quarterbacks had 89 dropbacks, while the two teams called just 30 running plays (excluding QB sneaks and kneeldowns). That is a remarkably pass-heavy game, the likes of which we typically only see once a year. But in terms of passing efficiency, it was … not so great. The Bears were particularly notable: you often see a team have a poor passing day and also be pass-happy, but that’s usually because they lost the game; you rarely seem a team win, run just 14 times, and average under 5 yards per pass! In fact, it hadn’t happened since 2013, and it had only happened 9 times since the merger! Of course, Chicago wasn’t very effective on the ground, so passing still was the optimal strategy.
For Tampa Bay, this was just more evidence that Tampa Tom is in full control of the offense. The Bucs are 5th in pass attempts despite usually playing with a lead; on Thursday Night against Chicago, the Bucs finished with a +3.6 Game Script and still passed on nearly 70% of their plays. Running back Ronald Jones II, who was the only player other than Brady to have a run or pass, finished with 17 carries; Brady finished with 43 plays! That means 72% of all Tampa plays — mind you, in a game they were usually leading — went through Brady.
The full week 5 Game Scripts below. [continue reading…]
Previously:
In 2015, Ryan Fitzpatrick had a breakout year for the Jets at the age of 33; not only did he post the first winning season of his career, but he set a career high in both yards and touchdowns. In 2016, Fitzpatrick and the Jets had a contract dispute that lasted nearly the entire offseason; he struggled in ’16, and looked to be finished.
Since then? He’s been a backup in Tampa Bay, posted league-leading efficiency numbers in Tampa Bay, been a backup in Miami, played well in Miami, been a mentor to a rookie in Miami, produced a two-incompletion game with the Dolphins, and … at almost 38 years old, just posted the top passing performance of week five of the 2020 season.
On the road in San Francisco, Fitzpatrick had 30 dropbacks and gained 342 yards, with 3 TDs and no interceptions. He also scrambled once, for a 17-yard first down. That gave him 13 first downs on 31 dropbacks, but his day was marked mostly by big plays: there was a 70-yard completion to Mike Gesicki, 47- and 32-yard deep passes to Preston Williams, a screen to Matt Breida that went for 31 yards (all YAC), and two deep passes to DeVante Parker for 28 and 22 yards.
The second-best passing performance of week five belongs to another former Jets quarterback: Teddy Bridgewater. The former Vikings star was signed by New York in 2018, but traded before ever playing a game with the Jets. Bridgewater’s raw stats were pleasing enough to the eye — 313 yards, 2 TDs, no interceptions or sacks — but it was the first down rate that set him apart. He picked up a first down on 18 of 37 dropbacks, and five of Carolina’s eight drives ended in scores. That was the second-highest first down rate of the week, slightly behind Ryan Tannehill’s 50% rate.
The full week 5 passing stats, below. [continue reading…]
Previously:
In week 3, the Bengals passed on 74% of their plays against Philadelphia in a game where Cincinnati led after three quarters (and ultimately tied). In week 4, the 49ers passed on 71% of their plays against Philadelphia in a game where San Francisco led after three quarters (and ultimately lost in the final minutes). In 2018 and 2019, there just were 7 games each season where a team led after three quarters and still passed on 71% of their plays; it’s happened against the Eagles now in back to back weeks!
Interestingly, during the first two weeks of the season, Eagles opponents were extremely run-heavy, even after accounting for Game Script. Philadelphia faced a league-high 75 rushing plays in the first two games of the season, but have been the most pass-happy defense since then. I don’t have a good explanation for this one — the 49ers don’t profile as a pass-happy team, but wound up having 50 dropbacks between their second and third string quarterbacks.
The full Week 4 Game Scripts below:
| Team | H/R | Opp | Boxscore | PF | PA | Margin | Game Script | Pass | Run | P/R Ratio | Op_P | Op_R | Opp_P/R Ratio |
|---|---|---|---|---|---|---|---|---|---|---|---|---|---|
| CLE | @ | DAL | Boxscore | 49 | 38 | 11 | 11.5 | 33 | 40 | 45.2% | 61 | 18 | 77.2% |
| CAR | ARI | Boxscore | 31 | 21 | 10 | 11.4 | 37 | 35 | 51.4% | 32 | 23 | 58.2% | |
| BAL | @ | WAS | Boxscore | 31 | 17 | 14 | 11 | 24 | 32 | 42.9% | 48 | 22 | 68.6% |
| GNB | ATL | Boxscore | 30 | 16 | 14 | 10.3 | 34 | 26 | 56.7% | 43 | 25 | 63.2% | |
| IND | @ | CHI | Boxscore | 19 | 11 | 8 | 8.2 | 30 | 38 | 44.1% | 43 | 16 | 72.9% |
| BUF | @ | OAK | Boxscore | 30 | 23 | 7 | 6.7 | 35 | 24 | 59.3% | 46 | 23 | 66.7% |
| MIN | @ | HOU | Boxscore | 31 | 23 | 8 | 6.7 | 25 | 40 | 38.5% | 35 | 27 | 56.5% |
| SEA | @ | MIA | Boxscore | 31 | 23 | 8 | 5.5 | 36 | 26 | 58.1% | 46 | 22 | 67.6% |
| KAN | NWE | Boxscore | 26 | 10 | 16 | 5.1 | 30 | 25 | 54.5% | 39 | 35 | 52.7% | |
| NOR | @ | DET | Boxscore | 35 | 29 | 6 | 4.6 | 27 | 42 | 39.1% | 34 | 22 | 60.7% |
| LAR | NYG | Boxscore | 17 | 9 | 8 | 4 | 34 | 23 | 59.6% | 41 | 25 | 62.1% | |
| CIN | JAX | Boxscore | 33 | 25 | 8 | 3.6 | 37 | 34 | 52.1% | 43 | 20 | 68.3% | |
| DEN | @ | NYJ | Boxscore | 37 | 28 | 9 | 1.2 | 31 | 32 | 49.2% | 50 | 24 | 67.6% |
| PHI | @ | SFO | Boxscore | 25 | 20 | 5 | 0.4 | 31 | 27 | 53.4% | 50 | 20 | 71.4% |
| TAM | LAC | Boxscore | 38 | 31 | 7 | -3.9 | 46 | 27 | 63% | 27 | 23 | 54% |
The Vikings and Saints profiled as the two run-heavy teams of the week. For Minnesota, this is hardly a surprise; the Vikings have been trying for years to be a run-heavy team, even if the personnel (or salary cap hits) didn’t always dictate that.
Previously:
Pick a random week since 2012, and you wouldn’t be surprised to see Aaron Rodgers, Russell Wilson, and Tom Brady as the top 3 quarterbacks, would you? Add in another great game from Drew Brees, and it was an excellent week for the quartet of future Hall of Famers. Perhaps the four best quarterbacks of the last decade combined to throw for 1,302 yards and 13 touchdowns in week 4, with three interceptions and five sacks on 143 dropbacks. They picked up 69 first downs, for a whopping 48.2% passing first down rate. Meanwhile, in the city that never sleeps, the two quarterbacks selected early in the first round in the 2018 and 2019 Drafts were the two worst passers of the week.
The full week 4 passing data below: [continue reading…]
The entire NFC East is a combined +33.5 today.
— Mike Tanier (@MikeTanier) October 4, 2020
Let’s take a quick look at the point spread for the NFC East games today:
The Cowboys are 3.5 point home favorites against the Browns.
The Football Team are 14-point home dogs against the Ravens.
The Giants are 13.5-point underdogs in Los Angeles against the Rams.
The Eagles are 9-point road underdogs tonight in San Francisco.
Yes, indeed, Mr. Tanier is correct: the NFC East are underdogs of 33 or 33.5 points today (the Baltimore/Washington line has fluctuated between 14 and 14.5 points). That sounds like a lot. It is a lot. But how much of an outlier is that?
As it turns out, there has been just one week since 1978 (which is as far back as PFR’s points spread database goes back) where the collective points spread for Dallas, Washington, New York, and Philadelphia was worse: week 13 of the 1998 season. That was the week that Randy Moss had three 50+ yards touchdown catches on Thanksgiving against the Cowboys, Washington was 2-9 under Norv Turner but upset the Raiders, the Giants under Kent Graham were 13-point dogs against a high-powered 49ers team (and lost by 24), and the Eagles and Koy Detmer were 18-point dogs against the two-time defending NFC Champion Packers.
And that’s it. Week 4 of the 2020 season is the second-worst week in history, at least as far as perception relative to opponent goes, for this quartet of teams. [1]Note that I am not saying NFC East history, as I am excluding the Cardinals from this post. Here’s the average points spread over the course of each season since 1978 for the Giants, Cowboys, Eagles, and the WFTFKATR. Remember, when looking at point spreads, it’s the reverse of points differential: a positive number indicates a weaker team. [continue reading…]
References
| ↑1 | Note that I am not saying NFC East history, as I am excluding the Cardinals from this post |
|---|
Previously:
The two football teams in Ohio have taken very different approaches to offensive football. With first overall pick Joe Burrow at quarterback, the Bengals have quickly become one of the most pass-happy teams in the NFL. Cincinnati played Philadelphia to a tie in week three, and yet Burrow had 52 dropbacks while Cincinnati handed off the football just 17 times. This game was close throughout and yet the Bengals were still extremely pass-happy. In fact, since the start of the 2014 season there have been just four games where a team did not lose or trail by more than 6 points after the second and third quarters, and still passed on at least 74% of their plays: two Tom Brady games, one Aaron Rodgers game, and the Bengals in week three.
A week ago, I noted that Cleveland ran on 60% of their plays for the first time in 5 years. Well in week 3, the Browns trailed entering the 4th quarter, and yet still ran on 57% of plays. That has not happened for Cleveland since 2009 and has happened just five times since the Browns rejoined the NFL in 1999. The Browns were just the 14th team since the start of the 2015 season to meet those two thresholds, a sure sign that Cleveland is now one of the most run-heavy teams in football.
| Team | H/R | Opp | Boxscore | PF | PA | Margin | Game Script | Pass | Run | P/R Ratio | Op_P | Op_R | Opp_P/R Ratio |
|---|---|---|---|---|---|---|---|---|---|---|---|---|---|
| MIA | @ | JAX | Boxscore | 31 | 13 | 18 | 12.7 | 20 | 36 | 35.7% | 46 | 17 | 73% |
| IND | NYJ | Boxscore | 36 | 7 | 29 | 12.1 | 25 | 31 | 44.6% | 31 | 29 | 51.7% | |
| TAM | @ | DEN | Boxscore | 28 | 10 | 18 | 12.1 | 40 | 25 | 61.5% | 45 | 14 | 76.3% |
| SFO | @ | NYG | Boxscore | 36 | 9 | 27 | 8.5 | 38 | 35 | 52.1% | 34 | 15 | 69.4% |
| KAN | @ | BAL | Boxscore | 34 | 20 | 14 | 8.5 | 42 | 31 | 57.5% | 32 | 21 | 60.4% |
| BUF | LAR | Boxscore | 35 | 32 | 3 | 8.4 | 37 | 21 | 63.8% | 34 | 32 | 51.5% | |
| CAR | @ | LAC | Boxscore | 21 | 16 | 5 | 6.1 | 30 | 21 | 58.8% | 51 | 23 | 68.9% |
| NWE | OAK | Boxscore | 36 | 20 | 16 | 5.4 | 30 | 38 | 44.1% | 34 | 22 | 60.7% | |
| SEA | DAL | Boxscore | 38 | 31 | 7 | 4.3 | 44 | 26 | 62.9% | 59 | 21 | 73.8% | |
| CLE | WAS | Boxscore | 34 | 20 | 14 | 2.2 | 25 | 37 | 40.3% | 40 | 22 | 64.5% | |
| GNB | @ | NOR | Boxscore | 37 | 30 | 7 | 1.5 | 33 | 26 | 55.9% | 38 | 20 | 65.5% |
| DET | @ | ARI | Boxscore | 26 | 23 | 3 | 0.3 | 35 | 27 | 56.5% | 36 | 27 | 57.1% |
| PHI | CIN | Boxscore | 23 | 23 | 0 | 0.2 | 50 | 36 | 58.1% | 52 | 18 | 74.3% | |
| PIT | HOU | Boxscore | 28 | 21 | 7 | -1.8 | 38 | 38 | 50% | 32 | 15 | 68.1% | |
| TEN | @ | MIN | Boxscore | 31 | 30 | 1 | -2.8 | 37 | 35 | 51.4% | 29 | 33 | 46.8% |
| CHI | @ | ATL | Boxscore | 30 | 26 | 4 | -8.5 | 53 | 25 | 67.9% | 40 | 25 | 61.5% |
The Cowboys had one of the NFL’s most pass-heavy games in week three. Dak Prescott threw 57 passes, tied for the third most in Cowboys history. Dallas rarely passes this often, and when they do, it’s usually because of a large deficit. But against Seattle, the Cowboys were competitive most of the game and led late. Prescott himself was responsible for nearly half of the team’s rushing yards, too; he finished with 484 yards of offensive, setting a new Dallas franchise record.
Miami also checked in as very run-heavy in week three; the Dolphins ran on over 63% of plays in a game they handled most of the way. Miami finished with both the strongest game script and the strongest run ratio, but Miami still had a very run-heavy gameplan. A good comparison would be to Tampa Bay, who had a similar Game Script but once again checked in as super pass-happy. For the second straight week, Tom Brady and company went pass-happy in an easy win. Last week, the Bucs passed 61.4% of the time in a game with a +11.6 Game Script; this week, it was 61.5% with a +12.1 Game Script. From 2017 to 2020, there were only five games where a team led by double digits at the end of each quarter and threw on 61% of their pass plays; the 2020 Bucs are responsible for two of those games, and Tom Brady is responsible for three of them.
The more surprising development continues to be how pass-happy the Buffalo Bills have become. Buffalo had a Game Script of +8.4, albeit in a weird game that saw the team trailing in the final minute. Still, the Bills — who checked in as very pass-happy over the first two weeks — passed on 64% of their plays in week three. Among all winning teams, Buffalo had the second highest pass ratio in week 3, trailing only the Bears — who had a -8.5 Game Script! Josh Allen continues to be the engine in the Buffalo offense.
As for those Bears, it marked the second straight week where Atlanta lost with a Game Script of over +8.0. Meanwhile, the Jets gave up for the second week in a row, but what more is there to right about? At some point, the stats don’t really need to be broken down.
Previously:
There are only a handful of games a year where a quarterback throws 35+ passes and still picks up a first down on half his dropbacks. NFL fans were treated to two of them this week.
On Sunday, 49ers backup Nick Mullens had an outstanding performance despite playing with a depleted roster. The 49ers did not punt or turn the ball over and scored 36 points. The 49ers were just the 14th team since 1970 to pull off that hat trick, and Mullens was a big reason why. Mullens averaged nearly ten yards per attempt, and of his 25 completions, 19 went for first downs. PFR’s passing first down data only goes back to 1999, but this was the most pass attempts in a game by San Francisco in a game where the team picked up a first down on
at least half of their dropbacks (including sacks).
Of course, the next night, Patrick Mahomes had to one up him. Mahomes had 42 pass attempts and did not take a sack; he threw for a first down on 22 of his pass attempts as the Chiefs punted just one time. Mahomes also scrambled four times and picked up two more first downs, including a touchdown. The final tally for Mahomes: 46 plays, 24 first downs, 5 TDs.
Below are the week 3 passing stats. [continue reading…]
You may have heard that the New Orleans Saints have now gone 45 straight games without allowing a 100-yard rusher. That’s very impressive: it includes 40 straight regular season games since Samaje Perine of Washington rushed 23 times for 117 yards in an overtime loss when Kirk Cousins was still the team’s quarterback; it also includes 5 straight playoff games (including three losses, naturally).
The defense with the longest streak without allowing a 100-yard rusher, since at least 1950, appears to be the Cleveland Browns. On opening day of the 1951 season, Verl Lillywhite of the 49ers rushed 17 times for 145 yards, including runs of 20, 28, and 33 yards. But from 1951 to 1955 — a span of 60 games during the 12-game era — no other player rushed for more than 83 yards against the mighty Browns. No player rushed for 100 yards in any of the Browns five playoff games during that era, too, although Doak Walker came very close. During Cleveland’s streak of 59 straight games without allowing a 100-yard rusher, the other 11 teams allowed 109 different 100-yard rushing games.
A few years ago, I looked at longest streaks without allowing a 100-yard rusher. At the time, I didn’t have individual player rushing data from the ’50s, so the longest streak was 53 straight games by the early ’90s Eagles. If the Saints go the full season without allowing a 100-yard rusher, that would bring them to 54 straight games, breaking the modern era record.
The table below shows all regular season streaks since 1950 of at least 33 games, along with the individual rusher who broke the mark. [continue reading…]
Previously:
Kirk Cousins had a very bad day on Sunday. He averaged -1.38 ANY/A against the Colts, an unspeakably bad performance from an above-average quarterback most weeks. Since 2010, there have been just 22 other times where a quarterback finished with below -1.00 ANY/A, and most of those quarterbacks were very bad.
It was bad on all fronts. He threw 3 interceptions and took 3 sacks, so there were plenty of negative plays. He also threw for only five first downs. His completion percentage was bad, too, and he only averaged 10 yards per completion. The passing offense gained just 95 net yards, and obviously negative adjusted net yards.
How bad was it? Carson Wentz was a disaster on Sunday, throwing for only 242 yards on 43 pass attempts, with 0 TDs, 2 INTs, and only 13 first downs. But in terms of passing value added relative to average, Cousins’s performance was twice as bad as Wentz’s was.
How bad was it? The Vikings finished with a passer rating of 13.0. The last time a team won with a passer rating under 15.0 and their opponent did not have a passer rating under 15.0, was way back in 2008, when the Panthers and Jake Delhomme threw 4 INTs but still beat the Andrew Walter-led Oakland Raiders. If you are wondering why that previous sentence had to be so clunky, it’s because yes there was in fact a game where both teams had passer ratings under 15.0 in recent memory: a 2010 disaster of a game featuring Todd Collins, Matt Moore, and Jimmy Clausen.
On the plus side, we have Bills quarterback Josh Allen, who had the best passing game of his career in week two. The 2018 first round pick finally had his first 300-yard game in week 1 of the 2020 season, and promptly followed that up with his first 400-yard game on Sunday. The 2020 season represents just 6.7% of Allen’s career games played to date, but 12.3% of his career passing yards. Allen became just the 20th player to throw for 400+ yards and have a passer rating of 145.0+ in NFL history; of course, just one of those games came before 1984, with the majority coming in the last ten years.
Below are the full week 2 passing stats. As a reminder, the new formula to calculate Adjusted Yards per Dropback is (Passing Yards + 9 * Pass 1st Downs + 11 * Pass TDs – 45 * INTs – 50 * Fumbles Lost) divided by (Pass Attempts + Sacks). In week 2, the average was 9.37, slightly up from 9.20 in week 1. So for each passer, we multiply his number of dropbacks by the difference between his AdjYd/DB average and 9.37 to create a passing value.
[continue reading…]
When the Jets decided to hire Adam Gase as head coach, I noted that it was an unusual hire because Gase’s teams had been outscored significantly when he was the Dolphins head coach. His record in Miami was 23-25, the result of winning a number of close games. So what did that mean for Gase’s prospects going forward?
And we could look at this two ways: did he coach a terrible team that got lucky to have a few more wins than they should have (in which case Gase should be considered a bad coach), or did he oversee a talent-poor team and coached them up to win more often than they should have (in which case Gase should be considered a good coach)?
From 2016 to 2018, Miami went 18-5 in games decided by 7 or fewer points, and 20-6 in games decided by 8 or fewer points. Both records were comfortably the best in the league. So, is that sparkling record in close games a positive for Gase — hey, he’s a great coach who wins when the talent level is close! — or a negative for Gase (he’s a terrible coach who is lucky his teams won as often as they did).
Unfortunately for Jets fans, nearly all the research on this subject suggests that a team’s record in close games is not reflective of skill, but of luck. The Jets have been terrible in close games in recent years, while Gase has been great: you would expect some regression to the mean in either instance, and I would project the Jets to be about .500 in close games during Gase’s tenure.
The bigger cause for concern, then, would be this: Gase went an almost unfathomable 3-19 in games decided by more than 8 points during his time in Miami.
A few months later, I dove even deeper into Gase’s weird splits in close and non-close games. Over his three years in Miami, Gase’s teams had the best record in the NFL in close games, and the second-worst record in non-close games. Based on how the other highly-regarded coaches fared in this split, I wrote that “if Adam Gase is a great coach who was overachieving with a bad roster, he’s pretty unique in that regard.”
Fast forwarded 18 games later, and the evidence is more convincing than ever that Adam Gase is not a great coach. The evidence is also still there that Gase has this weird split between close and non-close games. In New York, Gase is 2-9 in games decided by more than 8 points, and 5-2 in games decided by 8 or fewer points. And that includes a game where the Jets trailed the winless Dolphins by 11 points with 20 seconds left, and kicked a field goal to cut the lead to 8 in the hopes of recovering an onside kick, scoring a touchdown, converting a 2-point attempt, and outscoring Miami in overtime. If not for that meaningless field goal, Gase would be 2-10 in non-close games and 5-1 in close games with the Jets.
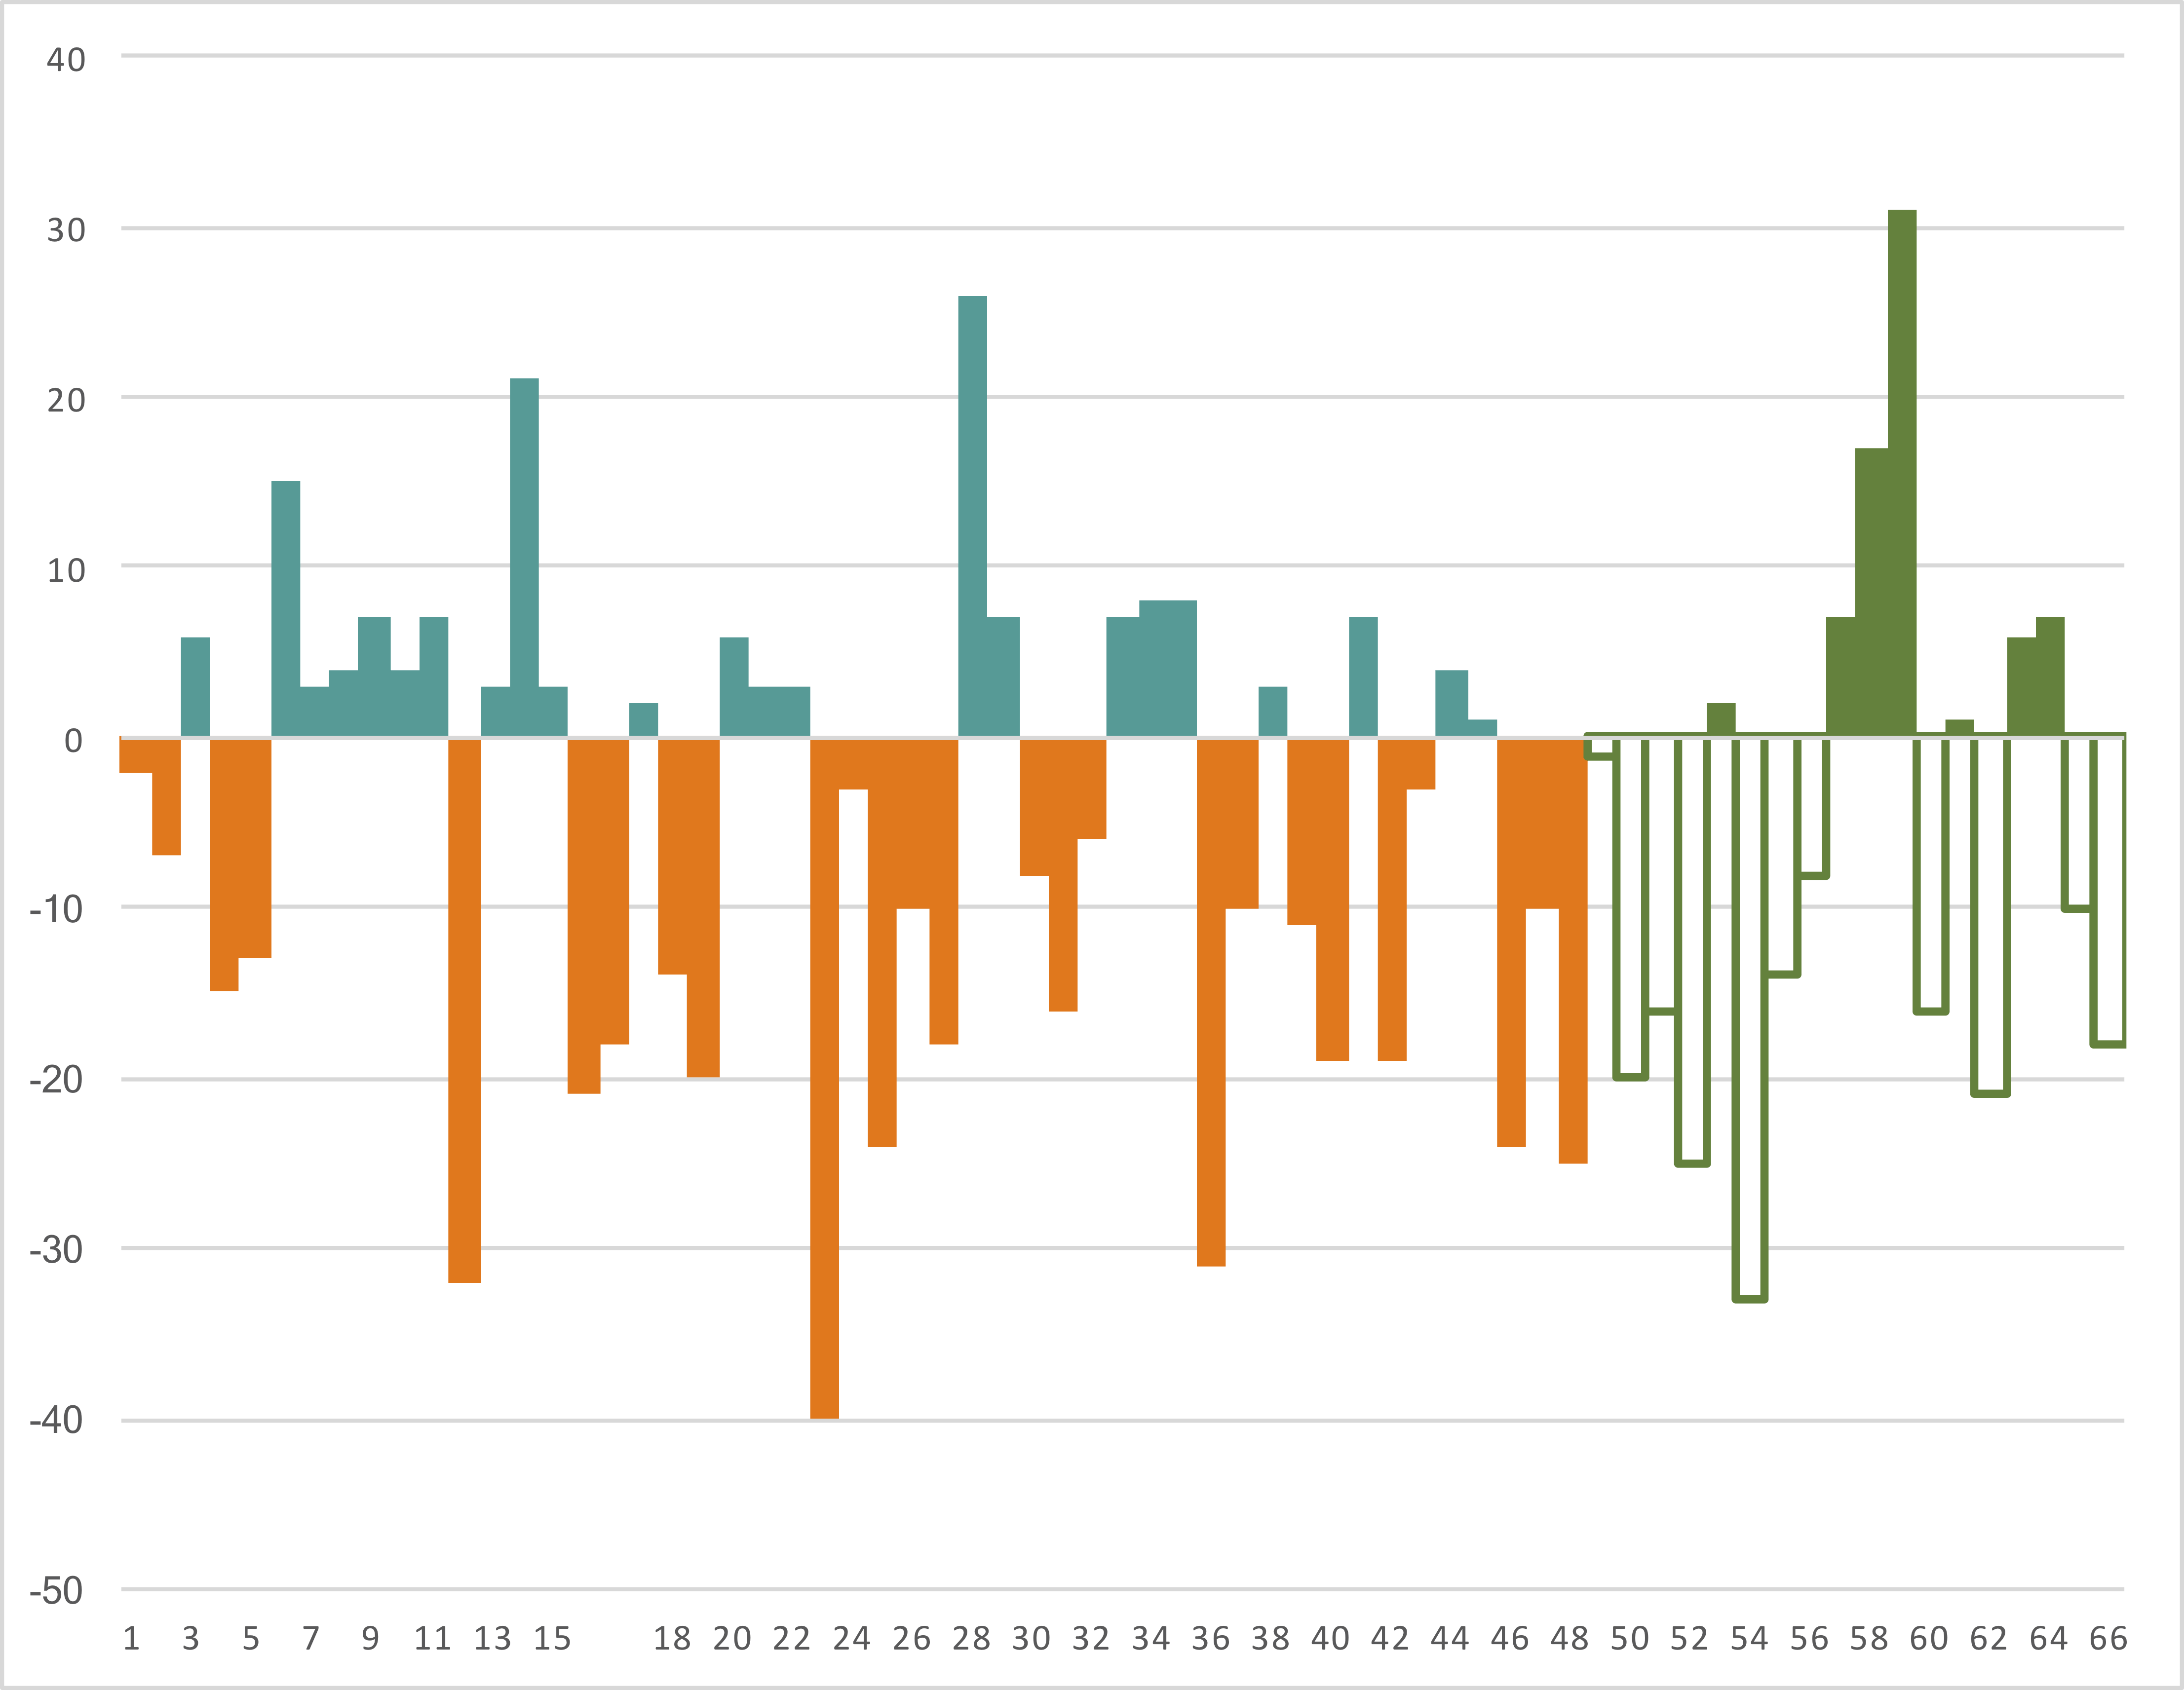
But ultimately, Gase is 5-28 in games decided by more than 8 points in his now 4+ year head coaching career. He’s also 25-8 in close games! The graph below shows the points differential for Gase’s teams in each of his 67 games as head coach. If you think this graph looks like an iceberg, you are right: most of the action takes place below the surface.
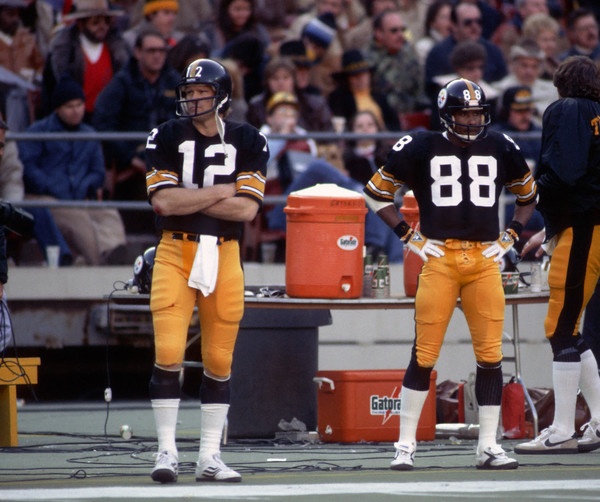
Bradshaw’s career took off when Swann entered the starting lineup.
Let’s start with Swann’s breakout year in 1975. In only his second season, he caught 11 touchdowns, tied with the Mel Gray for the league lead. Swann also ranked 8th in the NFL in receiving yards, and he did so while playing on a run-heavy Steelers team. While Swann’s raw numbers may not look great to the 2020 eye, he had 31% of all Steelers receiving yards and over 50% of his team’s receiving touchdowns. The most productive wide receiver in 1975 was Houston’s Ken Burrough, who that year became the last player in NFL history to gain over half of his team’s receiving yards. Gray had more yards than Swann, and Oakland’s Cliff Branch had a huge year on a run-heavy team, too. But I put Swann as the 4th most productive receiver in the NFL this year based on the following formula:
[ (Receptions * 5) + (Receiving Yards) + (Receiving TDs * 20) ] / (Team Pass Attempts, pro-rated for games played]
Let’s look at that formula again. Swann had a stat line of 49-781-11, which translates to 1,246 adjusted catch yards. Pittsburgh threw 337 passes in 1975, tied for the third fewest in the NFL. That means Swann averaged 3.70 adjusted catch yards per team pass attempt — which is one useful measure of receiver efficiency. Here were the top 15 receivers in 1975 in ACY/TPA: [continue reading…]
Five years ago, I noted the age when receivers produced their best season in terms of receiving yards. Today, I am going to revisit that study.
Irving Fryar is the biggest outlier in NFL history in this regard. He was a top college star and a prized NFL prospect who wound up going first overall in the USFL-depleted 1984 NFL Draft. He spent his 20s on some inconsistent Patriots teams, and then in 1991, at the age of 29, he had his first 1,000-yard season while playing with a below-average quartebrack in Hugh Millen. Fryar then went to Miami, and while playing with Dan Marino, had a career-season at age 31 in 1994. Eventually, Fryar landed in Philadelphia during the lean, pre-Reid/McNabb years. And yet in 1997, at the age of 35, while playing with journeymen Ty Detmer and Bobby Hoying in a Jon Gruden offense, Fryar had the first 1,300-yard season of his career. In fact, it remains the lone season of 1,300+ yards by a player 35 years or older… which is pretty remarkable given the quarterback presence.
There are 141 players in NFL history who have reached 7,000 career receiving yards. Fryar is the only one to have his best season (measured by receiving yards) at the age of 35; only four other players — Pete Retzlaff, Charlie Joiner, Bobby Engram, and Joey Galloway — had their best season at age 34.
The graph below shows the age where each of the 141 players with 7,000 career receiving yards had their best season. [continue reading…]
For the sake of argument, let’s just assume that there is no 2020 NFL season, or that a 2020 NFL season is cut extremely short after just a couple of games. How would the NFL go about preparing a 2021 Draft Order?
I have seen 3 main ideas floated around:
- Just re-do last year’s draft order, which seems to me to be a bit unfair. It assumes that the teams that were bad in 2019 will also be bad in 2020.
- A completely random draft order. This has the advantage of being ex ante fair — there is no advantage to being the Jets or the Raiders or the Cowboys — but would be extremely unfair ex post: the team that gets the 32nd pick would be at a severe disadvantage to the team that gets the 1st pick.
- Let’s say you and 31 friends came upon a bag containing $32,000. It would be very simple and fair to split it $1K for each of you. Now, you certainly could engage in a winner-takes-all coin flip battle until there is one person who gets the full $32,000. And that would be ex ante fair, as all of you would have the same chance of getting it. But it wouldn’t feel fair after the fact.
- This feels particularly important for the NFL, when you have a blue chip quarterback prospect.
- Base the draft order on an average of each team’s record over the last 3 or 4 or 5 years. This might feel fairer, but what does that have to say about how good these teams are now? The Patriots would pick last under this scenario, and New England could turn into a below-average team in 2020. The 49ers would have a top-8 pick.
What I would propose is a draft system that is ex post fair, or at least as fair as we can make it. In a world with no 2020 NFL or college football season, nobody can say with any confidence which teams will be the best in 2021. And you risk creating a lot of backlash among fans if a team lucks into the first overall pick. So the goal of a draft in this hypothetical should be to create an outcome that is relatively fair among all teams.
That sounds hard to do, but it is not impossible. Here is what I am thinking.
How 27 of the 32 teams would draft
Let’s ignore the top 5 picks in the Draft for now; five teams will get the first five picks, and we will deal with them later. Let’s look at the other 27 teams. What the NFL should do is give Team 1 the 6th pick in the first round, Team 2 the 7th pick, Team 3 the 8th pick, and so on, through the end of the first round…. and then go in reverse order for the second round, and keep that reverse order for the rest of the draft (which will be 8 rounds). So Team 1 would receive picks 6, 59 (the last pick in the second round), 86 (the last pick in the third round), 113, 140, 167, 194, and 221, while team 28 would have picks 32, 33, 60, 87, 114, 141, 168, and 195.
Now, is that fair? According to the traditional Jimmy Johnson chart, the teams with early picks would still do better, but not by much; and, in fact, teams at the end would tend to fare slightly better than teams in the middle. [continue reading…]
Let’s review the passing games of the 2001 Raiders and the 2018 Raiders. Both teams were coached by Jon Gruden and had similar passing yardage totals: the 2018 Raiders gained 4,057 receiving yards (i.e., gross passing yards before deducting sack yards lost), while the 2001 version gained 3,862 receiving yards. But how those passing offenses were constructed were very different. [1]It is noteworthy, but not the intent of this post, that the 2001 Raiders passing offense was also much better. Oakland ranked 4th in passing yards in 2001, and more notably, 4th in ANY/A. The 2018 … Continue reading
In 2001, Gruden’s offense was largely centered around the team’s two top wide receivers, a pass-catching running back, and a tight end, in that order: Tim Brown had 1,165 receiving yards, Jerry Rice had 1,139, Charlie Garner gained 578 yards, and Roland Williams gained 298 yards. Brown and Rice combined for 60% of the team’s receiving yards, and the quartet gained 82% of Oakland’s passing yards. Jerry Porter, the team’s third wide receiver, was limited to 220 receiving yards, while fullback Jon Ritchie (154) was the only other player with 100 receiving yards. That did not stand out as unusual for the era. [continue reading…]
References
| ↑1 | It is noteworthy, but not the intent of this post, that the 2001 Raiders passing offense was also much better. Oakland ranked 4th in passing yards in 2001, and more notably, 4th in ANY/A. The 2018 Raiders ranked 20th in passing yards and 18th in ANY/A. Of course, it says a lot about the 2001 NFL vs. the 2018 NFL that the 2001 Raiders ranked much higher despite the 2018 Raiders actually gaining more yards. But this post is about breaking down how the receiving pie was broken up, not any of these other measures. |
|---|
There are over 100 academic institutions that are identified by the US Department of Education as Historically Black Colleges and Universities (HBCUs). But when it comes to football, three stand out:
- Grambling State University is located in northern Louisiana in the city of Grambling. Prominent alumni include four Hall of Famers — Willie Davis, Willie Brown, Buck Buchanan, and Charlie Joiner, along with great players like Everson Walls, Albert Lewis, Gary Johnson, Ernie Ladd, Tank Younger, and Doug Williams. There have been a record 121 Tigers from Grambling State drafted.
- Tennessee State University is located in Nashville, Tennessee. More draft value has been spent on TSU Tigers than on any other HBCU. Prominent alumni include Hall of Famers Richard Dent and Claude Humphrey. In the pros, these players have not had the success of the Grambling players, but in terms of draft value, they can’t be topped: Too Tall Jones was selected first overall, Humphrey and Waymond Bryant were top-5 picks, and Dan Williams, Vern Holland, Dominique Rodgers-Cromartie, Jim Marsalis, and Eldridge Dickey were all top-25 picks. A whopping 117 players from TSU were drafted.
- Jackson State is located in Jackson, Mississippi, about halfway in between New Orleans and Memphis. The JSU Tigers have four Hall of Famers in Walter Payton, Jackie Slater, Lem Barney, and Robert Brazile. Jackson State is also home to two of the best receivers not in the Hall of Fame: Jaguars great Jimmy Smith and Harold Jackson, who comfortably led all players in receptions, receiving yards, and receiving touchdowns in the 1970s. Coy Bacon, Wilbert Montgomery, and Leon Gray all went to Jackson State, among other stars, helping the school provide more AV in the pros than any other HBCU. There have been 101 players from JSU drafted by the NFL.
A fourth school, Southern University in Baton Rouge, LA, is in its own tier as the 4th most prominent HBCU when it comes to NFL success. There have been 78 Jaguars drafted and only one — Isiah Robertson — was selected in the first round. So it hasn’t had quite the success as Grambling, Tennessee State, or Jackson State at putting players into the pros. But the Jaguars sure have been successful once they got there (including Robertson, a fringe HOF candidate). Two Hall of Fame cornerbacks, Mel Blount and Aeneas Williams, were drafted in the third round, while WR Harold Carmichael was a 7th round pick. And one of the best defensive ends during his prime was Broncos legend Rich “Tomstone” Jackson, was also a Jaguar. [continue reading…]