
The first NFL Draft took place in 1936. But for players attending Historically Black Colleges and Universities (HBCUs), it wasn’t until 1950 that the draft would hold any significance. Later, for a short window in the late ’60s and early ’70s, players from these tiny HBCUs dominated the draft. And finally, with a few notable exceptions, the prominence of HBCU players in the NFL Draft all but disappeared. Today, a look at NFL draft results and how players from HBCUs were valued in each draft. However, to start the story in the 1950s would be woefully inadequate. [continue reading…]
Every year, I publish a color-coded version of the NFL schedule the night it is released. Tonight is that night. [continue reading…]
Drafts in the early 1970s were long by modern standards, with 442 players selected. If the 1971 NFL Draft is remembered for anything, it’s for having three quarterbacks go with the first three picks in the draft: Stanford’s Jim Plunkett, Mississippi’s Archie Manning, and Santa Clara’s Dan Pastorini. But more than any other draft in NFL history, the 1971 NFL Draft represented the changing landscape of college football — and the country.
Fifty years ago, many Division 1 schools still operated independent from any conference affiliation. There were 56 players selected from such schools in the ’71 Draft, including 10 from Houston, 6 from Pittsburgh, 5 from Notre Dame, and 4 each from Penn State, Tulane, and Boston College.
The Big 10 led all conferences with 52 players drafted. That number just to 60 players drafted from schools in the 2020 version of the Big 10, which you reach by including the players drafted from Nebraska and Penn State.
The SEC had 31 players drafted in 1971, and 46 players if you include existing SEC schools not in the conference fifty years ago. [1]Those schools: South Carolina, Missouri, Texas A&M, and Arkansas.
The Pac-8 (the predecessor to the current Pac-12) had 29 players drafted, and 44 players chosen from schools now in the Pac-12. [2]Adding Colorado, Arizona and Arizona State, and Utah.
The Big 8 conference (the predecessor to the current Big 12) had 34 players drafted; the Southwest Conference (another predecessor to the Big 12) had 23 draftees that year, with players from Texas and Arkansas making up the majority of that group. There were 35 players drafted in 1971 among modern Big 12 schools.
The ACC had only 11 players drafted, although there were 26 players drafted from schools currently in the ACC. [continue reading…]
In a few weeks, Alabama quarterback Tua Tagovailoa will be drafted early in the first round of the 2020 NFL Draft. In doing so, he will become the fourth Crimson Tide passer to get drafted in the first round (in addition to Hall of Famers Bart Starr and Ken Stabler, who were not first round picks). But in the current, golden era of Alabama football, this isn’t much of a surprise: in fact, his former teammate, QB Jalen Hurts, will also hear his name announced during this draft.
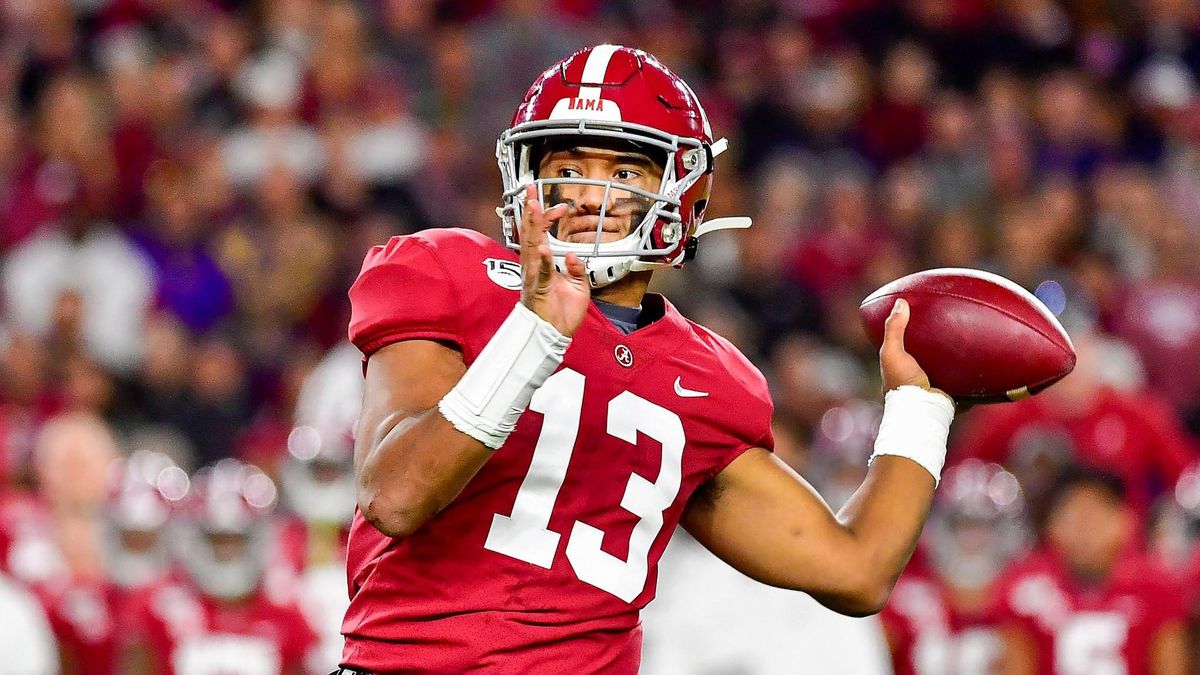
The rarest of sights: a quarterbacks throwing a football with his left hand.
Being born in Hawaii and of Samoan descent makes Tagovailoa a rarity in NFL circles, but not unique: he will join Marcus Mariota as the second such quarterback in the NFL.
But there is something particularly distinct about Tua: he throws the football with his left hand. The last quarterback in the NFL who was lefthanded was Kellen Moore, who went undrafted eight years ago in 2012 and has not thrown a pass in the NFL since 2015 (and, of course, is now the offensive coordinator for the Cowboys). The last southpaw quarterback to get drafted in the first round was Tim Tebow.
Over the last decade, the lefty has disappeared from the NFL passing landscape. Sure, you get the occasional lefthanded pass from a Tyreek Hill, Kevin Byard, or Antonio Brown, and the even rarer lefthanded toss by a righty, but the last time a lefthanded quarterback back stated and won a game was Michael Vick back in week 6 of the 2015 season! As I wrote last year, the lefthanded quarterback has been slowly phased out of the game; the graph below shows the percentage of passing yards in each season since 1932 that were thrown by southpaws: [continue reading…]
I was reading an old Brad Oremland article and this line about Andre Reed’s career stood out to me:
Even his seven Pro Bowls are as much a reflection of the AFC’s weakness as anything. Who was he beating out? Haywood Jeffires, Anthony Miller, and Al Toon? The competition (Clark, Ellard, Irvin, Rice, Rison, Sharpe) was all in the NFC.
Reed made seven Pro Bowls in his career, and he did that consecutively from 1988 to 1994. But it’s true that those years were some of the weakest years the AFC receivers had relative to their NFC counterparts (the weakest would come the year after, in 1995). Here are Reed’s ranks in receiving yards in the AFC from 1988 to 1994: 7th, 1st, 6th, 2nd, 12th, 4th, and 2nd. That’s pretty good and while there are a few less than stellar years in there, in almost all of those you can see why he’d be a Pro Bowl receiver. But here are Reed’s ranks in receiving yards in the NFL during those seasons: 17th, 5th, 13th, 6th, 11th, 23rd, 5th. Without fail, his ranking in the combined AFC/NFC league looks worse than his ranking in the AFC each year.
For nearly Reed’s entire career, the receivers in the NFC were superior to those in the AFC. For each year since 1970, I looked at the top five leaders in receiving yards in both conferences, and recorded how many receiving yards was gained by the average player in each group. In 1992, for example, the top five leaders in receiving yards in the AFC gained 950.8 yards, while the top five leaders in the NFC picked up 1,252 yards. The NFC boasted the top five leaders in receiving yards that season, which is how Reed — who ranked 11th in yards that season — ranked 4th in the conference in receiving yards.
The graph below shows the average for each season from 1970 to 2019. [continue reading…]

The QB who put together the 2nd best career, behind only Wilson, among players to enter the NFL from 2006 to 2015.
For the 10-year period from 2006 to 2015, only two quarterbacks with strong Hall of Fame prospects entered the league: Matt Ryan in 2008 and Russell Wilson in 2012.
And there aren’t that many franchise quarterbacks that entered during this time, either: Matthew Stafford in 2009, Cam Newton in 2011, and Andrew Luck in 2012 are the only that probably qualify. (And pickin’ nits s as to whether Ryan should be with this group, or Newton should be with the other group, is not relevant to this post.)
Heck, there weren’t even that many good starters that entered the league during this time 10-year period: the ones that qualify are Kirk Cousins, Andy Dalton, Joe Flacco, Jay Cutler, and Derek Carr.
How about solid starters? Jameis Winston and Ryan Tannehill, maybe? The book has yet to be written on Jimmy Garoppolo or Teddy Bridgewater and Marcus Mariota, so perhaps they jump into this or one of the higher tiers over the next few years.
After that, you are looking at guys like Jason Campbell, Sam Bradford, Nick Foles, Colin Kaepernick, and Case Keenum as the other top guys. But in general, this was an ugly decade. [continue reading…]
In March of 2011, the NFL voted to move kickoffs up from the 30 to the 35-yard line. That impact has been significant, and the league responded by placing a greater emphasis on kickers who can boom kickoffs into the opposing end zone.
In 2016, the NFL moved up where offenses would start following a touchback from the 20 to the 25-yard line, which made returners more likely to just take a touchback. That impact has been marginal.
The graph below shows the percentage of kickoffs that resulted in a touchback in each of the last 25 seasons. [continue reading…]
If you know nothing else about a game other than the quarterback threw for over 300 yards, would you bet that the team won the game?
On one hand, passing yards is correlated with production: all else being equal, more yards are better than fewer yards. On the other hand, we know that Game Scripts call for teams with a lead to throw less frequently than teams that trail; for the same reason that “teams that run 30+ times usually win”, you might be suspect about the fortunes of a team that threw for 300 yards.
And what about historically? Has the league-wide winning percentage changed over time for when a quarterback throws for 300 yards? Great questions! Let’s get some answers. [continue reading…]
The NFL is looking at adding a 7th team to the playoff field in each conference, which would represent a significant change in the current structure. Moving forward, only the #1 seed would have a bye. How would this chance things?
Wild Card Round
There would now be three games played here in each conference: as before, the 6 seed would travel to face the 3 seed, and the 5 seed would go on the road against the 4 seed. And the 1 seed would have a bye. But the 2 seed and 7 seed would now play each other, as opposed to both teams being off that week (with the 7 seed missing the playoffs).
My assumptions throughout this post are (1) home field advantage matters, and (2) the stronger seed is the better team, with the exception of 4 vs. 5. With 4-team divisions, the best team to not win its division — that is, often, the 2nd best team in the division with a very good division winner — is more often than not a better team than the worst division winner.
Let’s assume the 2 seed has a 65% chance of beating the 7 seed, the 3 seed has a 60% chance of winning, and the 4 seed has a 55% chance of winning. In the Division Round, the 1 seed will face the weakest remaining seed, while the strongest-seeded winner that won on Wild Card weekend would be home against the other remaining winner from Wild Card weekend. I simulated 32,000 playoff seasons to see which matchups are most likely in the Division Round.
As it turns out, the 1 seed has at least a 15% chance of facing any of the 4-7 seeds, with the 7 seed being its most likely opponent (because the 7 seed always plays the 1 seed when it wins). The 2 seed is the overwhelming favorite to be the other host team in the Division Round, although now the 3 seed has a 1-in-5 chance to do so (currently, it has a 0-in-5 chance of hosting a Division Round game). And heck, even the 5 seed has an opportunity to host a Division Round game, if all three road teams win on Wild Card weekend. [continue reading…]
Arizona running back David Johnson is one of the better receiving backs in the NFL, but he’s also the most unique. Most teams use their running back as a last resort on passing plays; on average, passes to running backs are right at the line of scrimmage. But with Johnson, he’s actually thrown passes down the field, rather than just as a checkdown option.
The graph below shows each running back with 40+ targets. The X-Axis shows the average number air yards on each reception by that running back; the Y-Axis shows the average number of yards gained after the catch. Most running backs will be up (high YAC) and to the far left (low Air Yards) on this chart. Johnson, however, is a bit of an outlier. Arizona frequently lines him up in the slot, and even throws him the occasional deep pass.
The other notable outliers at running back are Austin Ekeler (10.2 YAC per reception) and Dalvin Cook (11.2 YAC per reception): [continue reading…]
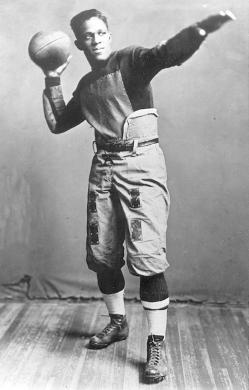
Fritz Pollard, the first African American coach and quarterback in the NFL.
Twelve years ago, I wrote a four part series detailing the history of the black quarterback.
Six years ago, I updated that article; today, a further update as the NFL just concluded its 100th season. And while for the last 52 of those seasons, at least one black quarterback was in the NFL, the roles and treatment of black quarterbacks have varied greatly over the last five decades.
The history of black quarterbacks in professional football is complicated. The New York Giants did not have a black quarterback throw a pass until 2007, when Anthony Wright became the first to do so; 10 years later, Geno Smith became the first and only black quarterback to start a game for the Giants. But as far back as 1920, Frederick Douglass “Fritz” Pollard was the tailback of the Akron Pros; a year later, he was promoted to player/coach, and became the first black head coach in NFL history. Pollard helped the Pros win the championship in the NFL’s inaugural season. [1]At the time, the NFL went by the name the American Professional Football Association. It was not known as the NFL until 1922. The Pros ran the single-wing, and Pollard was the player lined up behind the center who received the snaps. At the time the forward pass was practically outlawed, so Pollard barely resembles the modern quarterback outside of the fact that he threw a few touchdown passes during his career. [2]In addition to his NFL exploits, Pollard also achieved a great deal of fame for leading Brown to back-to-back road wins over the powerhouse schools of the time, Yale and Harvard, in 1916. He would … Continue reading And, of course, it was a time of significant discrimination: Pollard and end Bobby Marshall were the first two black players in professional football history.
As told by Sean Lahman, at least one African American played in the NFL in every year from 1920 to 1933, although Pollard was the only one resembling a quarterback. [3]It wasn’t just African Americans that had full access during this era: Jim Thorpe coached and starred in a team composed entirely of Native Americans called the Oorang Indians in 1922 and 1923. Beginning in 1934, that there was an informal ban on black athletes largely championed by Washington Redskins owner George Marshall. It wasn’t until 1946 that black players were re-admitted to the world of professional football, when UCLA’s Kenny Washington [4]Who occupied the same backfield with the Bruins as Jackie Robinson. and Woody Strode were signed by the Los Angeles Rams; in the AAFC, Bill Willis and Marion Motley were signed by Paul Brown’s Cleveland Browns that same season.
[continue reading…]
References
| ↑1 | At the time, the NFL went by the name the American Professional Football Association. It was not known as the NFL until 1922. |
|---|---|
| ↑2 | In addition to his NFL exploits, Pollard also achieved a great deal of fame for leading Brown to back-to-back road wins over the powerhouse schools of the time, Yale and Harvard, in 1916. He would become the first African American to be named an All-American and the prior season, he lead Brown to the Rose Bowl. |
| ↑3 | It wasn’t just African Americans that had full access during this era: Jim Thorpe coached and starred in a team composed entirely of Native Americans called the Oorang Indians in 1922 and 1923. |
| ↑4 | Who occupied the same backfield with the Bruins as Jackie Robinson. |
There aren’t many shared birthdays among NFL starting quarterbacks. Teddy Bridgewater and Drew Lock were born four years apart on November 10th, making them the only shared birthday among players with 1,000 passing yards last season. The March 2nd birthday has been held by Ben Roethlisberger alone for a long time, but Tua Tagovailoa — both on the same date 16 years later — arrives just in time to carry that date’s mantle. And watch out: the next decade of the NFL could be defined by Kyler Murray (born August 7th, 1997) and Jalen Hurts (born August 7th, 1998). As for the presumptive number one pick in the 2020 Draft? Well, Joe Burrow may wind up being the career leader in passing yards by a player born on December 10th by the end of his rookie season.
But when it comes to NFL birthdays, there’s no date that can compare to today. Drew Bledsoe — born on Valentine’s Day, 1972 — ranks 16th on the all-time passing yards list, and he’s only the third best quarterback born on this date. Hall of Famer Jim Kelly was born a dozen years before Bledsoe, and Steve McNair was born February 14th, 1973. There are only 47 quarterbacks with 30,000 passing yards, and three of them were born today. David Garrard ranks 142nd on the all-time passing yardage list with over 16,000, which is pretty darn good for the 4th best quarterback born on a calendar date. In fact, no other calendar date has four passers of note (May 17th is the only other day to give us four quarterbacks who hit even 7,500 yards).
And Patrick Ramsey, who ranks as the 5th best February 14th passer, has more yards than any other player who ranks fifth on his birthday’s passing list. The same is true of Anthony Wright at #6, although that’s where the fun stops. With Christian Hackenberg — yes, he celebrating his 25th birthday today — failing to gain any traction in the NFL, May 11th remains the only birthday with seven 1,000-yard passers.
The graph below shows the career passing yards for each birthday for all of NFL history. With over 137,000 passing yards, February 14th is easily the leader: [continue reading…]
The Kansas City Chiefs are Super Bowl champions. And the Chiefs did it in one of the most remarkable ways possible: by coming back from double digit deficits in all three games.
Kansas City trailed 24-0 early in the 2nd quarter of the Division Round playoff game with the Texans. The Chiefs responded with four touchdown drives to somehow grab a 28-24 lead heading into the locker room.
In the AFC Championship Game, the Titans jumped out to a 10-0 lead 10 minutes into the game, and held a 17-7 lead with 5 minutes left in the half. Once again, Kansas City score two quick touchdowns to take a lead into the locker room, 21-17.
Then, last night in the Super Bowl, the 49ers took a 20-10 lead into the 4th quarter. The low point was probably with 7:13 left in the game, as the Chiefs trailed 20-10 and faced a 3rd-and-15 from the Kansas City 35-yard line. [continue reading…]
It’s safe to say that the Chiefs rely on their quarterback, Patrick Mahomes, a lot more than the 49ers rely on Jimmy Garoppolo. More often than not, these Super Bowls have ended with the better team winning, and the better quarterback losing.
The most extreme example is probably Super Bowl XLVIII between the Seahawks and Broncos. Seattle had a great defense and a very good running game, with an efficient but low-volume quarterback. Denver had the best quarterback in the NFL. Does that sound familiar? Of course, as we all know, the Seahawks blew out the Broncos.
Five years earlier, in Super Bowl XLIII, the Steelers were a much more balanced team than the Cardinals. Arizona had Kurt Warner, Larry Fitzgerald, and Anquan Boldin, but Pittsburgh was driven by its top-ranked defense. Ben Roethlisberger had been interception prone during the season, and the Steelers passing attack was average at best for most of 2008. Still, Pittsburgh emerged victorious.
And while you likely don’t remember it, Super Bowl IX is another good comparison to this year’s game. Minnesota had Fran Tarkenton, who was arguably the top quarterback in the NFC in 1974, but the defense had fallen from its golden days of the late ’60s and early ’70s. Meanwhile, Pittsburgh ranked 1st or 2nd in most of the key defensive categories but had a young and unproven quarterback in Terry Bradshaw. The Steelers were not very reliant on their quarterback, while Minnesota was: and in the Super Bowl, the dominant defense carried the day.
A counter example comes from 2006 in Super Bowl XLI. The Bears had an interception prone quarterback in Rex Grossman and an outstanding defense, while the Colts were obviously carried by Peyton Manning. This time, the dominant quarterback’s team won, although it was the running game and the defense (or maybe the absence of a passing game for Chicago) that really led Indianapolis to victory.
How about one of the greatest upsets in pro football history, in Super Bowl XLII? We don’t often think of this game as a “great QB vs. a balanced team” sort of game, because New England was just so much better than New York during the regular season. But the Giants passing game was below-average during the regular season and the defense was better than average, while the Patriots were defined by their passing game. In the Super Bowl, the Giants defensive line dominated the game, and led to a huge upset.
Another lopsided game was Super Bowl XXIV between the ’89 49ers and ’89 Broncos. While San Francisco was the better team overall, and 13-point favorites, the Broncos were certainly the more balanced team. The 49ers passing offense was off the charts good during the regular season, while Denver’s defense finished 1st in points allowed and 3rd in yards allowed. The 49ers blew out the Broncos in the most one-sided game in Super Bowl history.
Let’s close with two more games that featured upsets by the “balanced/defense” team over the “star QB team”. In Super Bowl 50, the Broncos had a great defense while the Panthers had the league MVP at quarterback. And in Super Bowl XXXVII, the Bucs had a great defense while the Raiders had the league MVP at quarterback. In both games, the dominant defense stole the show.
Will Super Bowl LIV follow a similar trend? I’m a bit surprised to see the Chiefs as 1.5-point favorites in this game. While no game is a perfect mirror of any other game, there are many similarities between this 49ers/Chiefs game and several of the games on the above list. And we know that the 49ers were the better team overall this season. Even Super Bowl XXV, between the Giants and Bills, matches this trend. That game didn’t make the list because the Giants passing attack during the regular season was very good, but that was mostly with Phil Simms; if you consider the Giants team that made the Super Bowl as a balanced/defense-heavy team going up against a high-octane offense, that’s another mark in favor of the 49ers on Sunday.
So what methodology did I use to come up with these results? The full explanation below. [continue reading…]
Last year, the Kansas City Chiefs were the #1 seed in the AFC, while the 49ers had the second-worst record in the NFL. This year, the two teams are in the Super Bowl. Today, let’s look at how each of the 108 Super Bowl teams fared in Year N-1 — that is, the year before making the Super Bowl.
For each team, I calculated their Pythagenpat record in Year N-1. The best Super Bowl team by Year N-1 Pythagenpat record was, unsurprisingly, the 1973 Dolphins. As we all know, the year before Miami went 14-0 and won the Super Bowl.
The 2019 Chiefs don’t fare all that well in this regard, mostly because the 2018 team ranked 24th in points allowed. Kansas City was the #1 seed, but it was not a dominant team by these standards. The 49ers, however, do stand out as particularly bad (although I’ll note that San Francisco, despite finishing with the 2nd pick in the 2019 Draft, “only” had the 6th worst Pythagenpat rating of 2018). The 2018 49ers are one of the worst 5 teams to make the Super Bowl the following season. [continue reading…]
In 2019, the Vikings averaged 7.13 yards per pass play, while the Chargers averaged 7.01 yards per pass play. Yards per pass play here is just Net Yards per Attempt, which is team passing yards (net of sacks) divided by pass attempts (including sacks).
In 2019, the Vikings averaged 4.48 yards per carry, while the Chargers averaged only 3.97 yards per carry.
But in 2019, despite Minnesota being more efficient both at passing and rushing than Los Angeles, the Vikings averaged fewer yards per offensive play than the Chargers: Minnesota averaged 5.83 Y/P, while Los Angeles averaged 5.90 Y/P. Regular readers here know that this is the result of Simpson’s Paradox, a counter-intuitive phenomenon in which a trend appears in different sets of data but reverses when these data are combined.
How does this happen? Because overall, passing is more efficient than running when it comes to yards per play, and the Chargers passed much more frequently than the Vikings. That’s one reason why I don’t like “yards per play” as a statistic to measure offensive production: it’s biased in favor of pass-happy teams.
Instead, I like to use a modified version called adjusted yards per play, which takes 60% of the team’s Yards per Pass average and 40% of the team’s Yards per Carry average. This eliminates any Simpson’s Paradox issues and gives a better sense of which are the most efficient offensive teams.
And here’s your Super Bowl LIV tie-in: the Chiefs averaged more yards per play this year than the 49ers, but San Francisco averaged more adjusted yards per play. Here’s how to read the table below. San Francisco had 514 pass plays for 3,792 yards, averaging 7.38 Net Yards per Attempt. The 49ers had 498 rushing plays for 2,305 yards, averaging 4.63 yards per carry. Overall, this means the 49ers averaged 6.02 yards per play, but San Francisco passed on only 50.8% of plays this season. As a result, the 49ers averaged 6.28 Adjusted Yards per Play (60% of 7.38 plus 40% of 4.63), which was the third-best average this season. The Chiefs rank 5th in this metric: Kansas City averaged 6.22 yards per play and 6.16 adjusted yards per play. And, if you removed the three Matt Moore games (Denver, Green Bay, Minnesota), the Chiefs in the 13 Patrick Mahomes games averaged 6.34 yards per play and 6.29 Adjusted Yards per Play.
During the regular season, Jimmy Garoppolo had 143 pass plays on third down. On 13 of those pass plays, he took a sack. On the other 130 third down pass plays, Garoppolo gained a first down on exactly half of them. On Saturday, commenter LightsOut85 pointed out that he thought Garoppolo’s great third down performance was “more an indicator of SF’s offensive scheme (namely YAC) than his passing ability.”
Is that true? I decided to investigate. Of Garoppolo’s 130 third down pass plays that were not sacks:
-
- 41 of them (31.5%) were thrown at or beyond the first down marker (i.e., past the sticks) and completed for a first down.
- 30 of them (23.1%) were thrown past the sticks but fell incomplete.
- 24 of them (18.5%) were thrown short of the sticks but still picked up a first down (this is the category LightsOut85 was focused on).
- 35 of them (26.9%) were thrown short of the sticks and did not pick up a first down.
The graph below shows each of his 130 pass attempts. It is color-coded to make it easier to read, but let’s explain. The X-Axis shows the distance — i.e., it was 3rd-and-X. The Y-Axis shows the amount of air yards for the throw. For example, at the top right, you will see a 3rd-and-16 pass that went for 41 air yards, which was one of the more memorable plays of the 49ers season.
If the pass was thrown at or beyond the sticks, the bubble is blue. If it was converted for a first down, the dot is fully colored in blue; if it was not, it is a white bubble with a blue outline. If the pass was thrown short of the sticks, the bubble is red. If it was converted for a first down, the dot is fully colored in red; if it was not, it is a white bubble with a red outline. [continue reading…]
Super Bowl LIV features the two best tight ends in the game: Kansas City’s Travis Kelce and San Francisco’s George Kittle. Over the last six seasons, Kelce has averaged 1,078 receiving yards per season, and he’s posted four straight 1,000-yard years. But it was Kittle who was the top tight end this year according to the AP, and the top player overall according to Pro Football Focus.
Kittle is an excellent blocker and an outstanding receiver, but today, I want to focus on his receiving numbers. While Kittle put together a great season working with Jimmy Garoppolo, he ranked “only” 3rd in receiving yards among tight ends. That’s because the 49ers were one of the most run-heavy teams this year: Kelce’s Chiefs threw 97 more passes than the 49ers, while Oakland’s Darren Waller played on a team that threw 45 more passes than San Francisco.
In terms of pure receiving yards per team pass attempt, Kittle was best in the league.
[continue reading…]
In 2018, in an article about the weird 2017 season that Jameis Winston had (if I only knew what the future would hold!), there was one tidbit you might have missed: in 2017 season, Jimmy Garoppolo had the best 3rd down conversion rate in the league. After being traded to the 49ers in midseason, Garoppolo picked up a first down on exactly half of his dropbacks (28 of 56).
Garoppolo did not repeat this success in limited playing time in 2018 (6 of 24); you won’t be surprised to learn that Patrick Mahomes (48%) led the NFL in this metric last season. [continue reading…]
On the surface, it is very easy to paint Super Bowl LIV as yet another matchup between a great defense and a great offense, similar to Super Bowl 50 (Panthers/Broncos), Super Bowl XLVIII (Broncos/Seahawks), any of the first three Super Bowls, or many of the great ones in between.
The Chiefs have the reigning MVP of the NFL in Patrick Mahomes, and Kansas City is averaging 4.3 points (!) and 48 yards per drive this postseason. The 49ers had a dominant defense in the first half of the season, becoming just the 9th team since 2002 to allow 102 or fewer points through 8 games. In the playoffs, San Francisco held Minnesota to just 10 points and then shut out the Packers in the first half (while forcing two turnovers), effectively clinching a Super Bowl berth by halftime courtesy of a 27-0 lead.
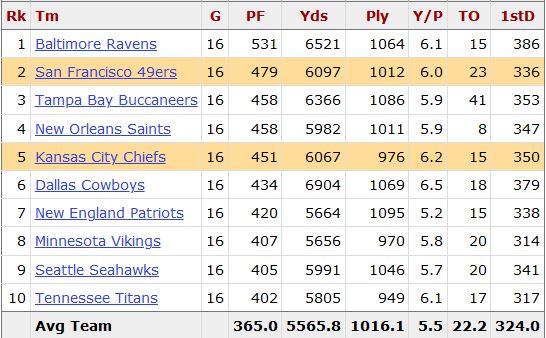
But here’s the interesting thing: did you know that the 49ers scored more points this year than the Chiefs? And that Kansas City allowed fewer points this year than San Francisco? Strange, but true. In fact, San Francisco scored more points and gained more yards than Kansas City.
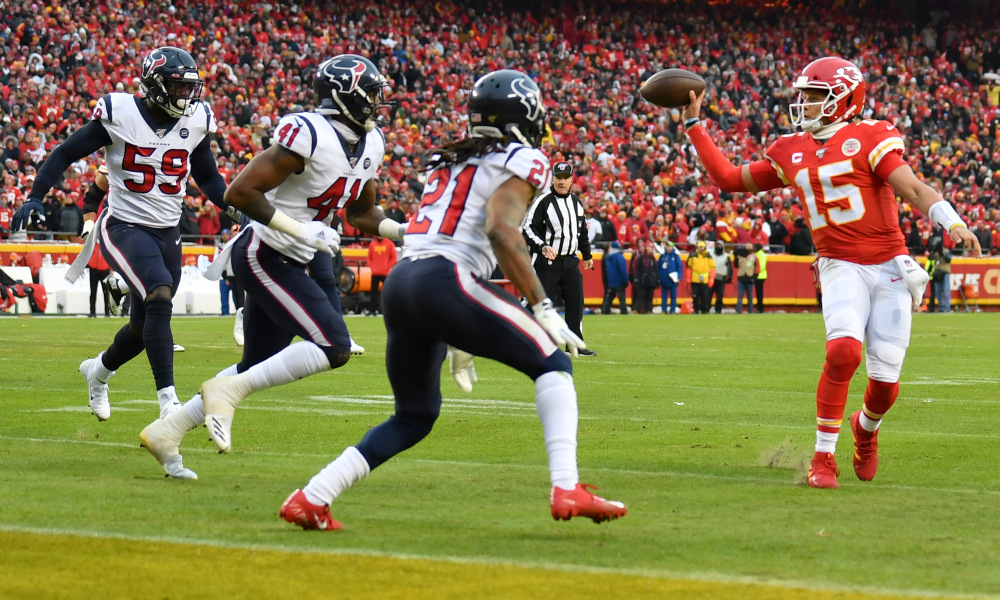
Mahomes can beat you deep — or with a flip.
Against the Titans in the 2019 AFC Championship Game, Patrick Mahomes threw for 14 first downs on 35 passes, while also taking two sacks. That’s a passing first down rate of 37.8%. Note that this ignores that Mahomes scrambled 6 times and picked up a first down on four of them, so his true first down rate was 41.9% (the Chiefs also just dropped two passes here).
Let’s ignore the advanced stats for a minute (scrambles, drops) and just focus on his passing numbers: Mahomes has picked up 30 first downs through the air on 72 dropbacks this postseason, a 42% rate. That’s amazing, but it isn’t as amazing the standard way we analyze quarterbacks here: Mahomes is averaging 10.74 ANY/A this postseason! [continue reading…]
Can Rodgers erase Favre’s bad history?
Packers fans were confident: they were home, they were 7.5-point favorites, and they were facing a team they had defeated handily during the regular season. Unfortunately for them, the rematch went very differently: the Giants won, in overtime, 23-20.
But that game may give Rodgers and Packers fans something to point to as they prepare for the 2019 NFC Championship Game. Green Bay is headed to San Francisco, the site of a 37-8 49ers blowout in the regular season. San Francisco fans are confident: they are home, they are 7.5-point favorites, and they are facing a team they defeated handily during the regular season.
Of course, 49ers fans have positive examples to point to, as well. In fact, they have a lot of them, with Jimmy Garoppolo also having some experience he can point to as a backup. In 2014, Garoppolo was a rookie on the New England Patriots. In week 10 of that season, the Patriots blew out the Colts, 42-20, in Indianapolis, in a game best remembered for Jonas Gray hitting the national stage with 201 rushing yards and 4 touchdowns. The two teams would later meet in Foxboro in the 2014 AFC Championship Game. New England was a 7.0-point home favorite, and demolished the Colts even more convincingly. So much so that the 45-7 victory is mostly remembered now for the “Deflategate” controversy that surfaced after the game. [continue reading…]
In week 10, the Chiefs and Titans faced off in one of the most exciting and weirdest games of the year. Tennessee won 35-32 in a game that had it all: a 68-yard touchdown run (by Derrick Henry, naturally), a 63-yard touchdown pass, a fumble returned for a 53-yard touchdown, a Ryan Tannehill strip sack, a Ryan Tannehill 23-yard touchdown pass in the final seconds, an aborted field goal attempt, and a blocked field goal attempt as time expired.
It was one of the wildest games of the season, and if we get a repeat of that game, football fans are in for a treat. Patrick Mahomes was the top passer in the NFL that week, throwing for 446 yards and 3 touchdowns, while Henry rushed for 188 yards.
But there is one big difference: that game was in Nashville, while this game will be in Arrowhead. That makes this a repeat of last season, when the Chiefs lost by 3 points on the road to the Patriots in the regular season, than hosted the Patriots in the AFC Championship Game. Of course, Kansas City lost the playoff rematch, too. [continue reading…]
There were many decisions to analyze from yesterday’s AFC Division Round matchup between the Texans and Chiefs. Houston raced out to a 24-0 lead and somehow still trailed at halftime, fueled in part by its own poor fourth down decisions (kicking a field goal on 4th-and-a-foot early, a fake punt later). Kansas City became just the third team to win a game by 20+ points after trailing by 20+ points earlier in the same game.
But there was an interesting decision late in the game that, while it wound up having no impact on the game, is still worthwhile to analyze. Here was the situation: Kansas City led, 48-31, with 8:10 left in the game. The Chiefs faced 4th-and-2 from the Houston 6-yard line, and had two choices:
- Attempt a field goal to take a 51-31 lead. This would gave Houston the ball at its own 25-yard line, down by 20 points, with 8:06 to go.
- Go for it, which would lead to one of three results:
- Score a touchdown, effectively ending the game.
- Convert the 4th down, and the drive still ends in a field goal attempt, albeit with probably two more minutes taken off the clock.
- Fail on the 4th down conversion, which gives Houston the ball, down 17 with 8:00 remaining, at their own 6-yard line.
So what is the best decision here? Obviously the Chiefs chances of winning are extremely good no matter what they do. With 8 minutes left, the odds of Houston scoring 17, 20, or 21 points are all really low. Let’s think about it in a more competitive game situation. [continue reading…]
Today marks the 27th postseason game of Andy Reid’s career.
In 17 of the first 26 games, Reid’s team was favored; shockingly, those teams have gone just 9-8.
In the other 9 games, when Reid’s teams (the Eagles in all but one game) were underdogs; they went 3-6.
But today, Reid’s Chiefs are 10-point favorites at home against Houston, the single largest point spread for any playoff game under Reid.
The graph below shows each of the first 26 games of Reid’s career, marked in Eagles and Chiefs colors. The X-Axis shows how many points by which his team was favored; the Y-Axis shows the actual margin of victory.
The short version is:
- Upper Right: Favored to win and actually won (9 games)
- Lower Right: Favored to win and lost (8 games, including four with the Chiefs where Kansas City lost by 1, 1, 2 points, and in overtime).
- Upper Left: Underdogs but won (3 games)
- Lower Left: Underdogs and lost (6 games)
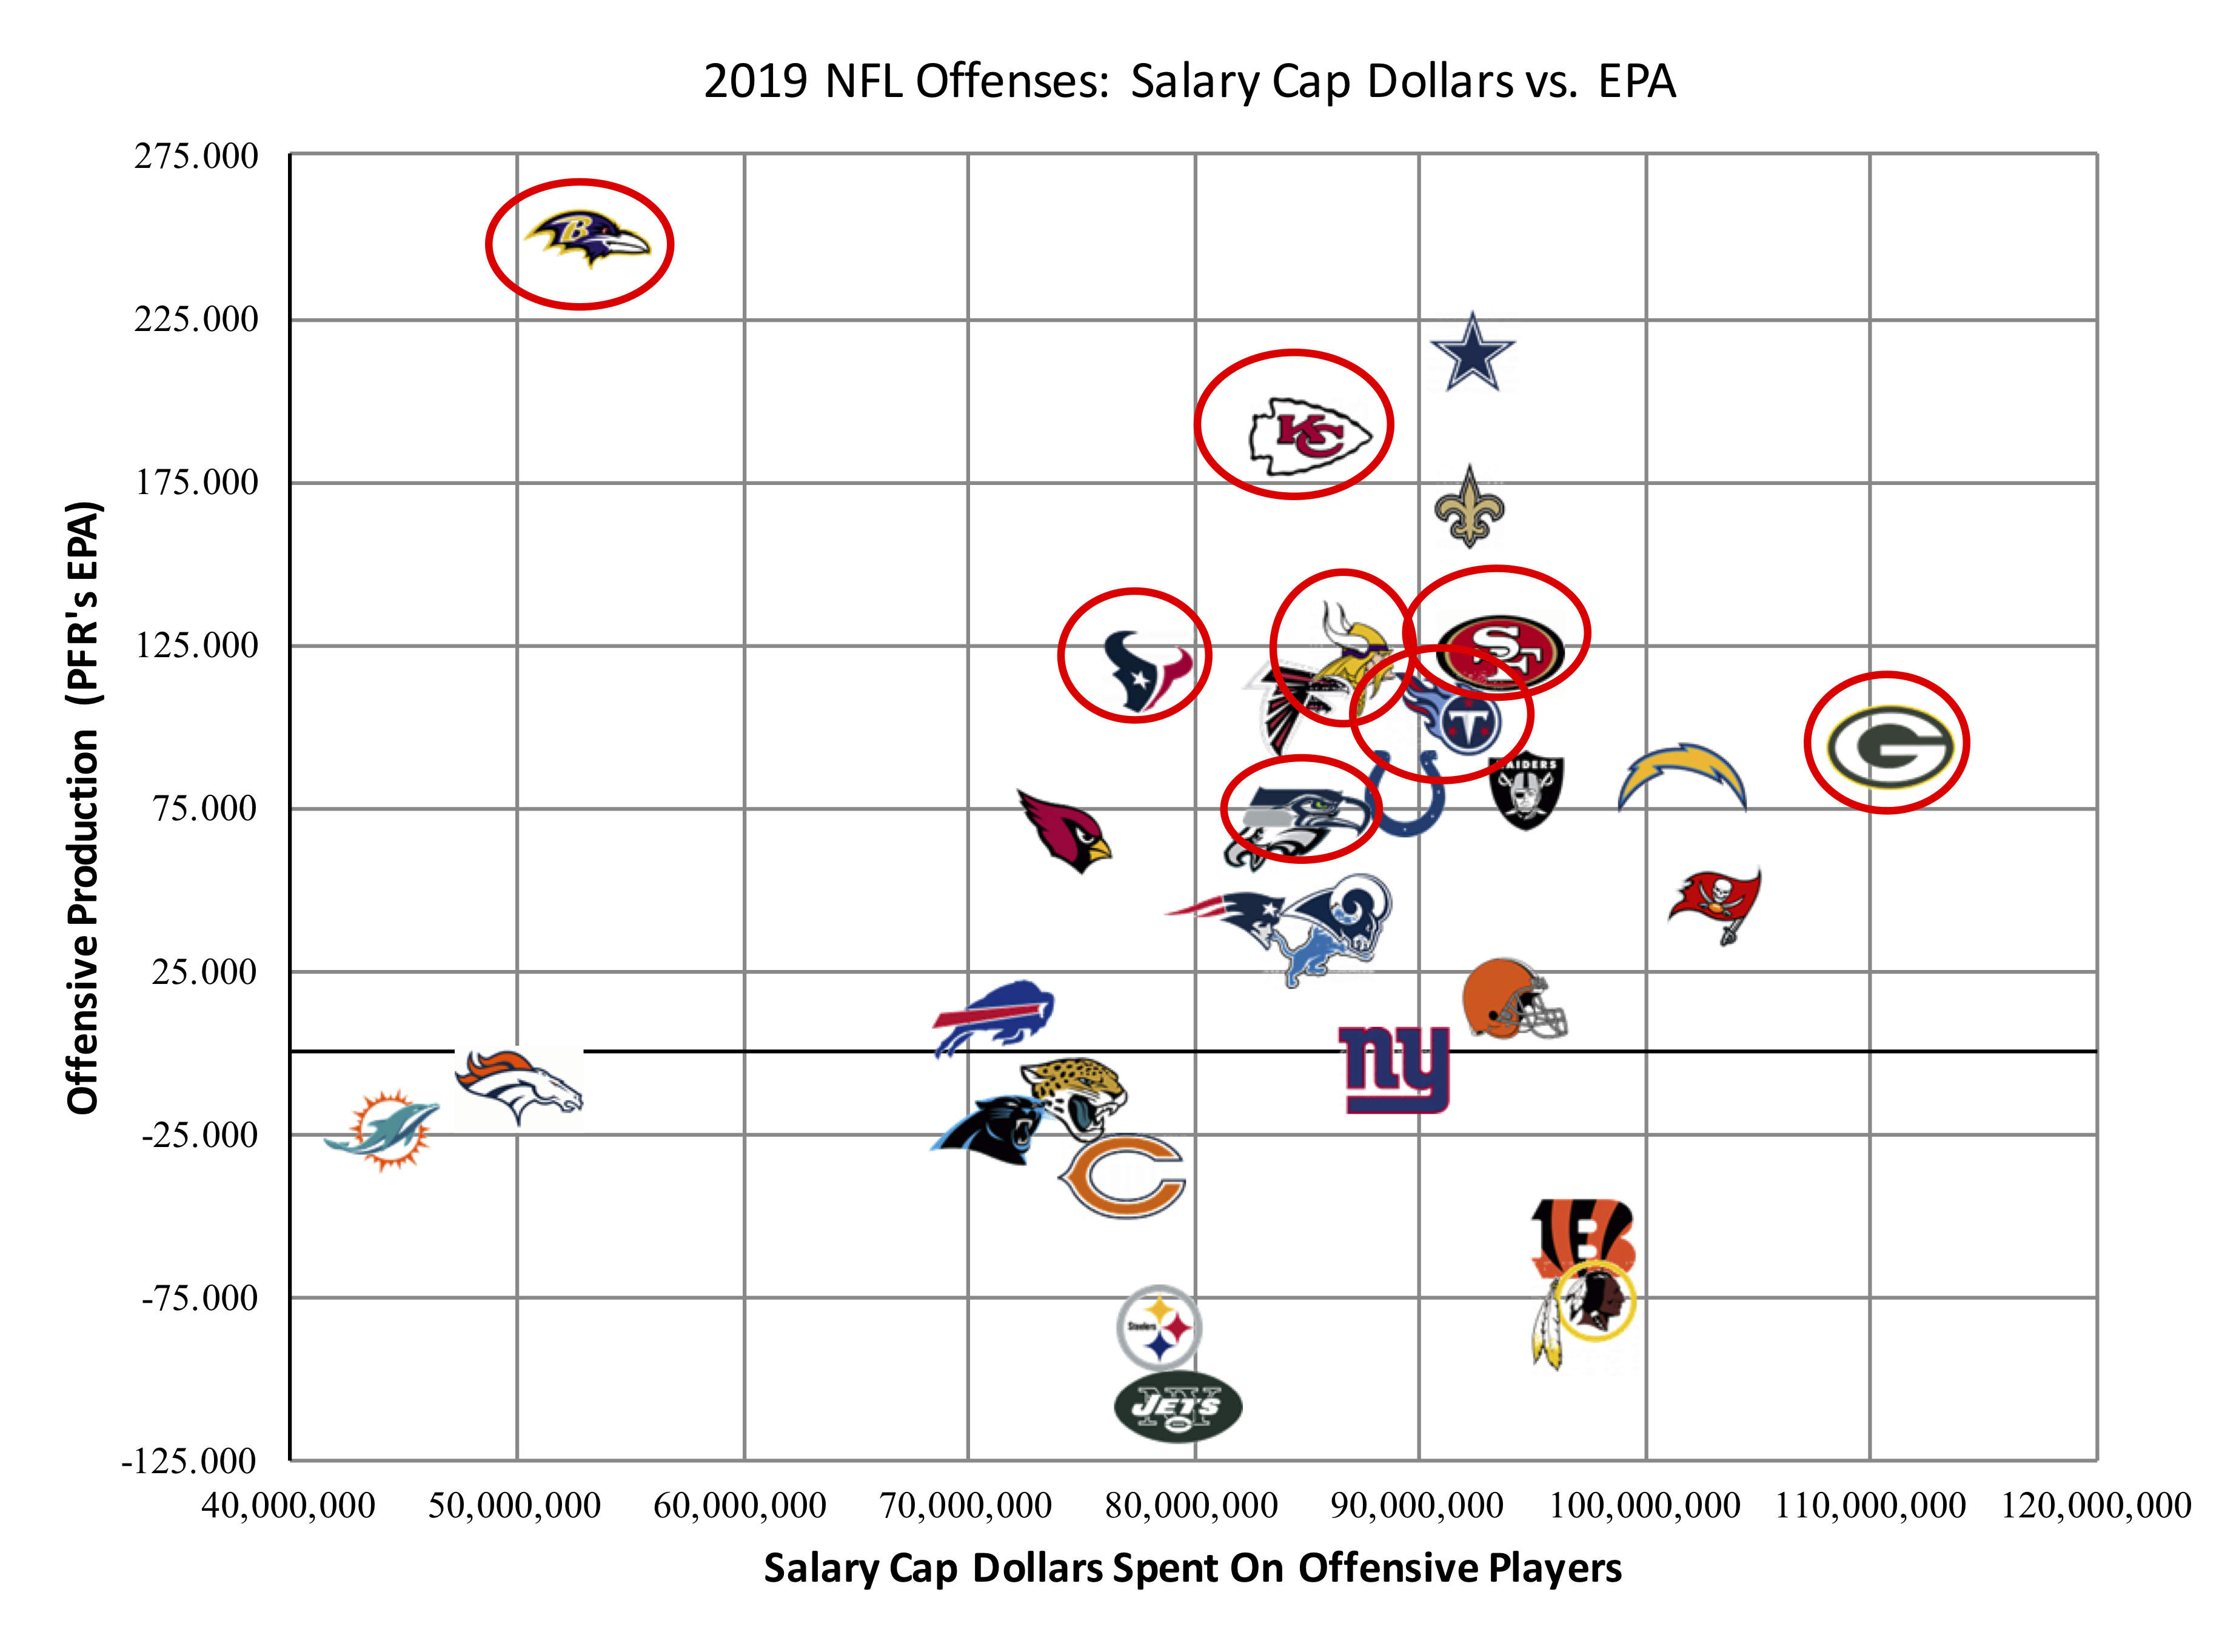
Let’s look at a simple graph today. The X-Axis shows the salary cap dollars each team spent on its offense in 2019, per Over The Cap. The Y-Axis shows how good each offense was in 2019, based on PFR’s Expected Points Added model.
The Packers spent the most money on offense this season, at $111M salary cap dollars. Green Bay finished 10th in EPA.
The Ravens led the way in EPA and did so despite spending just $53M on offense. Quarterback Lamar Jackson has a cap hit of just $2.2M, while G Marshal Yanda ($9.125M) is the team’s most expensive offensive player. In fact, only three offensive players on Baltimore have a cap hit of over five million: Yanda, LT Ronnie Stanley ($6.5M) and WR Willie Snead ($5.6M). Although it’s probably worth noting that Joe Flacco has a dead cap hit of $16.0M in 2019, but dead money is not included in the graph below.
The final 8 teams are in red circles:
Texans quarterback Deshaun Watson and Packers quarterback Aaron Rodgers had the two best games of the season. The quarterbacks had nearly identical stat lines: Watson threw 33 passes for 426 yards with 5 TDs and no sacks (15.94 ANY/A) while Rodgers threw 31 passes for 429 yards and 5 TDs with 1 sack (16.28 ANY/A).
To calculate how much passing value each player provides in a game, we take the player’s ANY/A, subtract league average (6.16) and then multiply that difference by the number of dropbacks. For Watson, that gives him 323 adjusted net yards of value over average; for Rodgers, it’s 324 yards of value. But there was one difference between the two games: Watson played a below-average defense in Atlanta, but Rodgers played a Raiders defense that ranked in the bottom three of the NFL against the pass. Once you adjust for strength of schedule, Watson has the best game of the season.
The worst game of the season? Without adjusting for strength of schedule, that honor belongs to Sam Darnold against the Patriots. In that game, Darnold was awful: not only did he throw 4 interceptions, but he gained just 73 net yards on 33 dropbacks. In that game, Darnold finished at -310 adjusted net yards of value relative to league average, the worst performance of the season. But, of course, the Patriots had the best defense against the pass. After adjusting for SOS, the worst game of the year was … Kyle Allen against the Falcons. It doesn’t help that Atlanta was pretty bad against the pass, but Allen was absolutely awful: he threw 4 interceptions and took 5 sacks against a bottom 8 defense.
The table below shows the every passing performance in 2019, from best to worst. The table below is fully sortable and searchable. [continue reading…]
How much did passing efficiency decline in 2019 compared to a record-setting 2018? That depends, a bit, on how you measure passing efficiency — in more ways than one.
In 2018, all NFL passers combined to average 6.32 Adjusted Net Yards per Attempt. In 2019, all NFL passers combined to average 6.16 ANY/A, a decline of 2.6%. However, there is another way to measure league average, and that’s by taking an average of the average ANY/A stats for each of the 32 teams.
In 2019, while “the NFL” as a whole had a 6.16 ANY/A average, an average of each of the ANY/A rates for the 32 teams comes to 6.19. If that is confusing to you, think of it this way: when we calculate “the league average” in passing stats, we are giving more weight to the Bucs, Panthers, and Falcons than to the Ravens, Titans, and Vikings. Collectively, those three NFC South teams were responsible for 11.0% of all passing plays in 2019; meanwhile, pass plays from Baltimore, Tennessee, and Minnesota account for only 7.7% of NFL passing plays.
When we think of league average, we almost always mean a weighted average that gives more weight to the teams that pass most frequently. But there’s at least an argument to be made that league average would be better defined by taking an average of the averages. And in this case, in 2019, it would mean a higher average: that’s because the wrong passers threw it more often in 2019.
Last year, the right passers threw it more often: an average of the ANY/A produced by each of the 32 teams was 6.29 (which was lower than the normal average of 6.32, since the weaker passing teams threw less frequently last year). By this measure, passing efficiency declined only 1.6% — from 6.29 to 6.19 — from 2018 to 2019, rather than by 2.6%.
Let’s look at each team in 2019. The X-Axis shows the number of dropbacks: the NFC South teams (other than the Saints) are on the far right, because they passed the most. The Y-Axis shows pass efficiency, as measured by ANY/A.
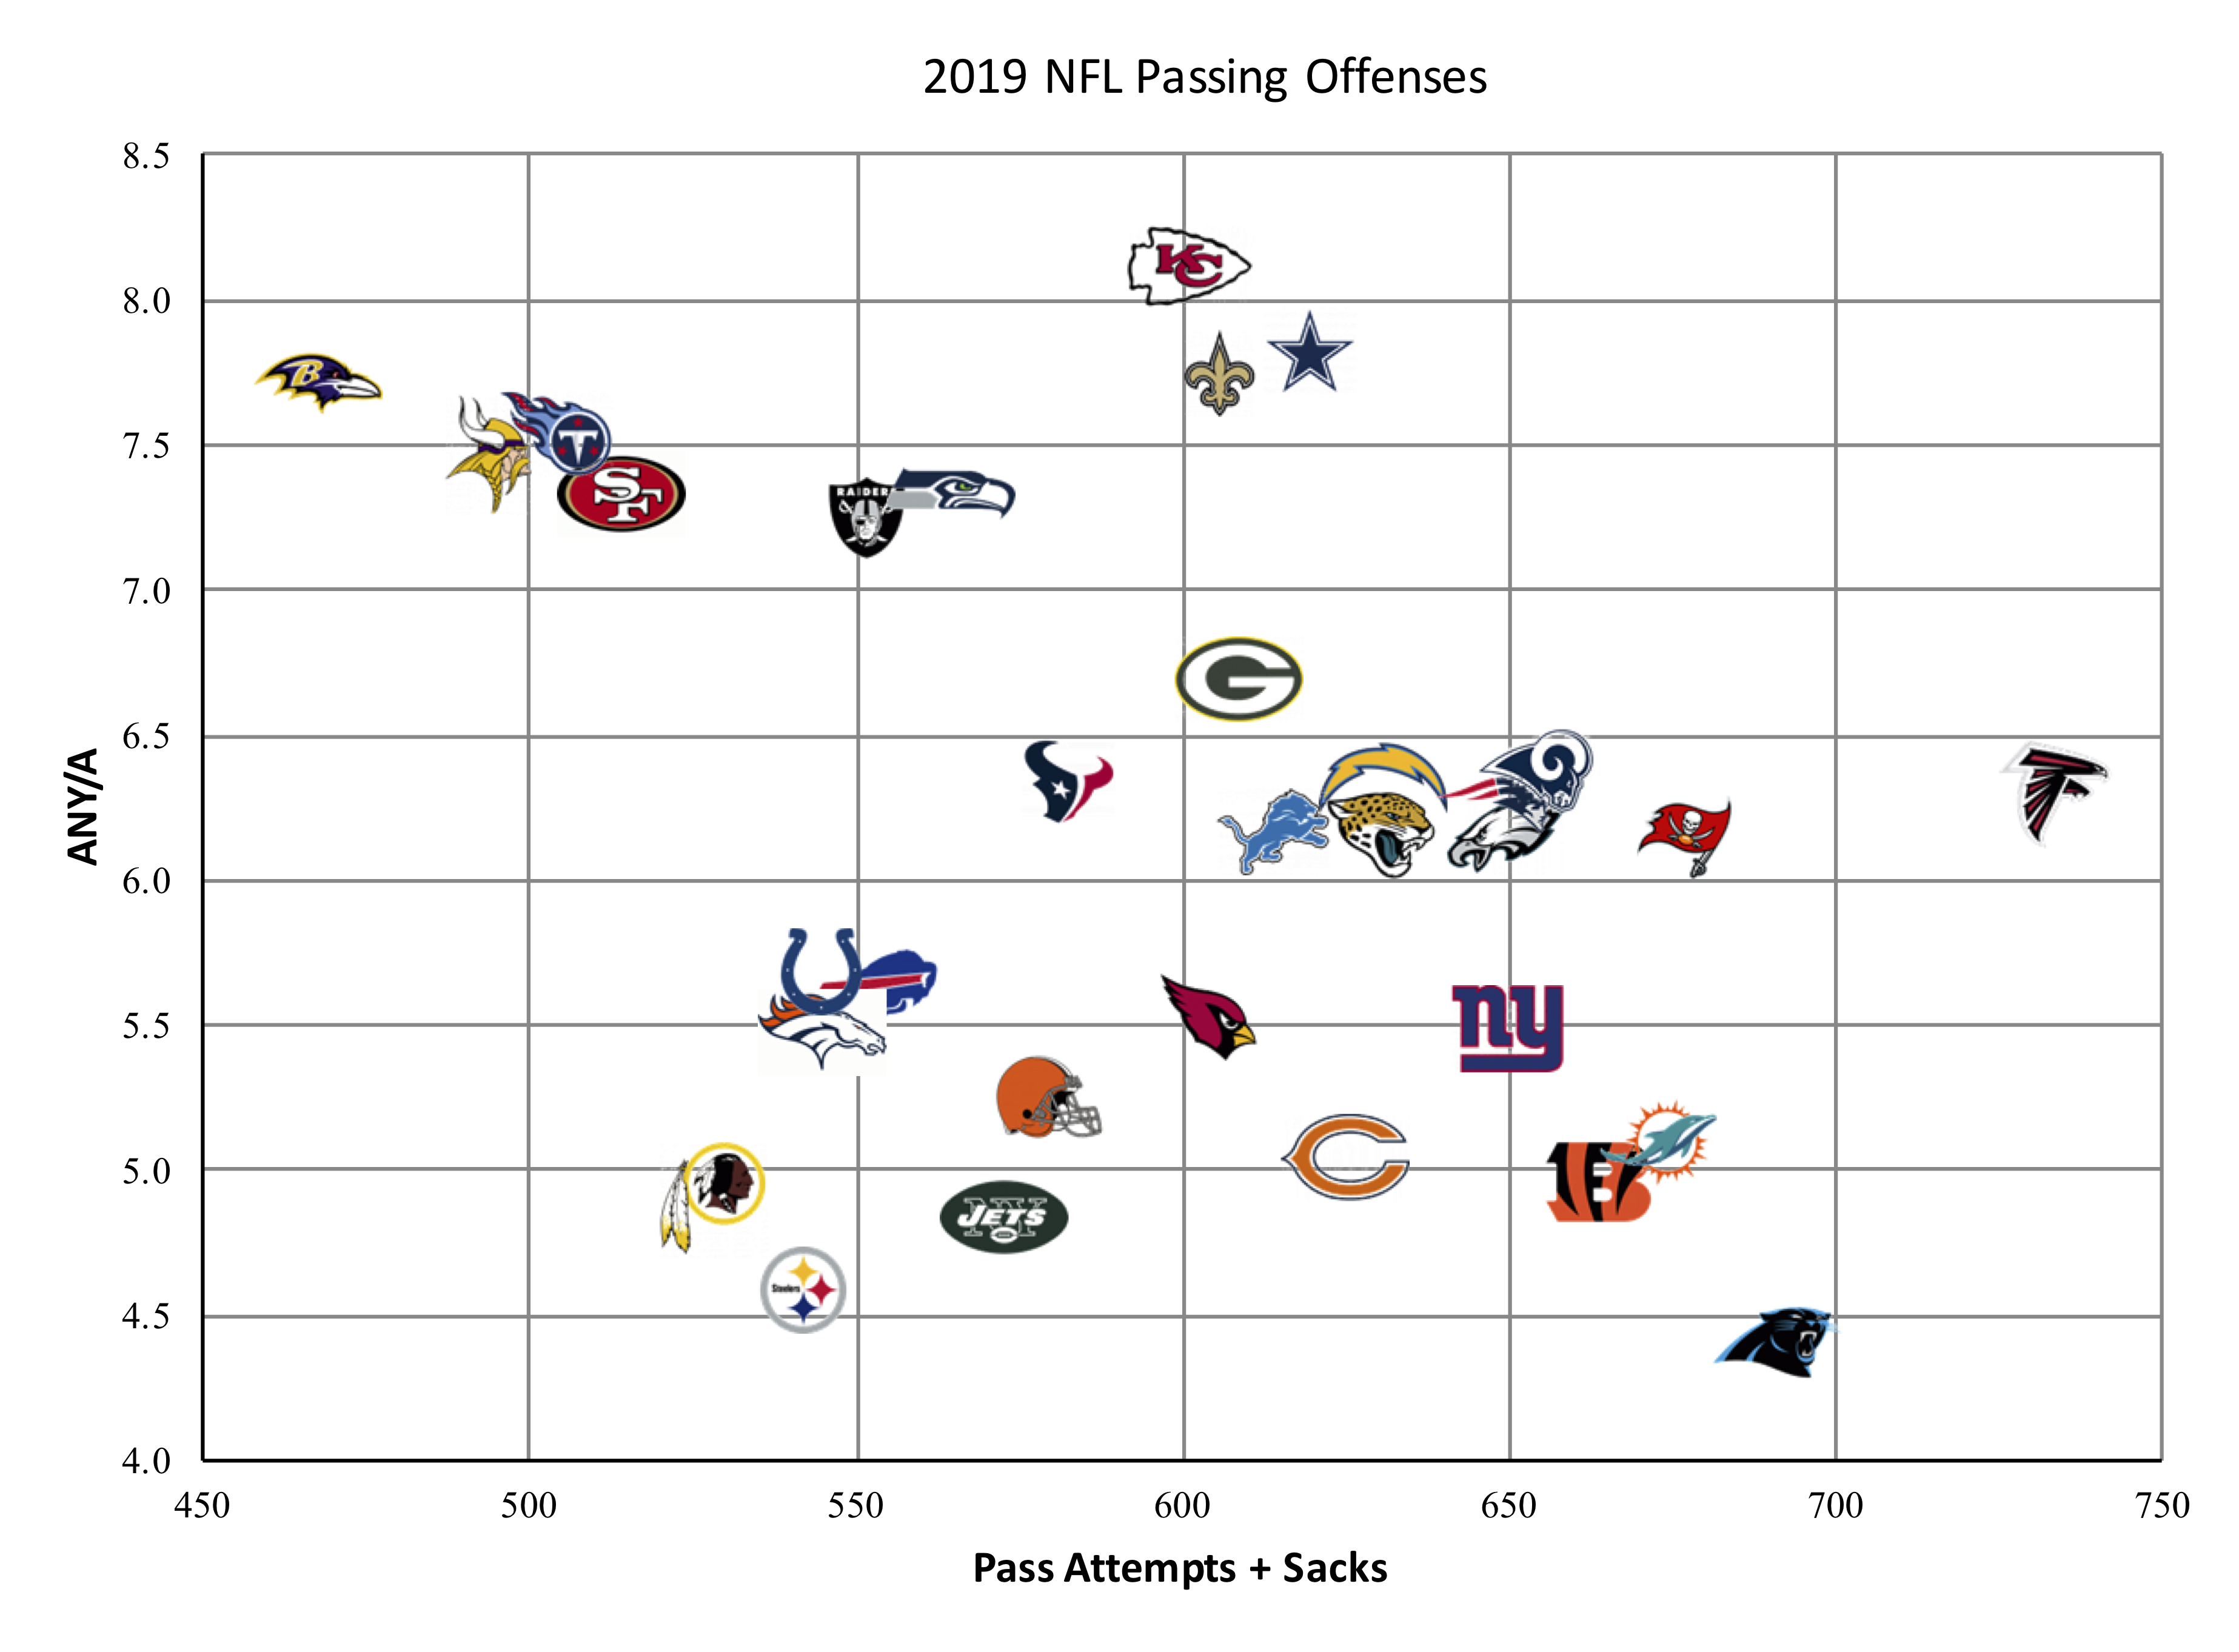
It’s pretty clear that the “wrong teams” passed most often in 2019; the chart has a slope that is down and to the right. This, of course, is why the “NFL ANY/A” was 6.16 but the “average of the ANY/A for the 32 teams” was 6.19; by giving the Ravens and Titans equal weight to the Bucs and Panthers, you raise the average.
You might think this is how things always are: after all, the whole point behind my Game Scripts work is that teams with the lead pass less often, and trailing teams pass more often. But of course we already discussed that last year, the reverse was true: the right teams passed more often. In fact, there isn’t much of a trend in recent years as to whether or not the better passing teams are more likely or less likely to pass more often.
This final graph is a little wonky, but here goes. It shows the league average ANY/A in each season calculated the normal way minus the average of the ANY/A for all of the teams. So in 2019, you get a negative number (6.16 – 6.19 is -0.03); in 2018, it’s positive. Any time the graph is above 0, it means that the right teams are passing more often. Any time it’s below zero — as in 2019 — it means the wrong teams are passing more often.
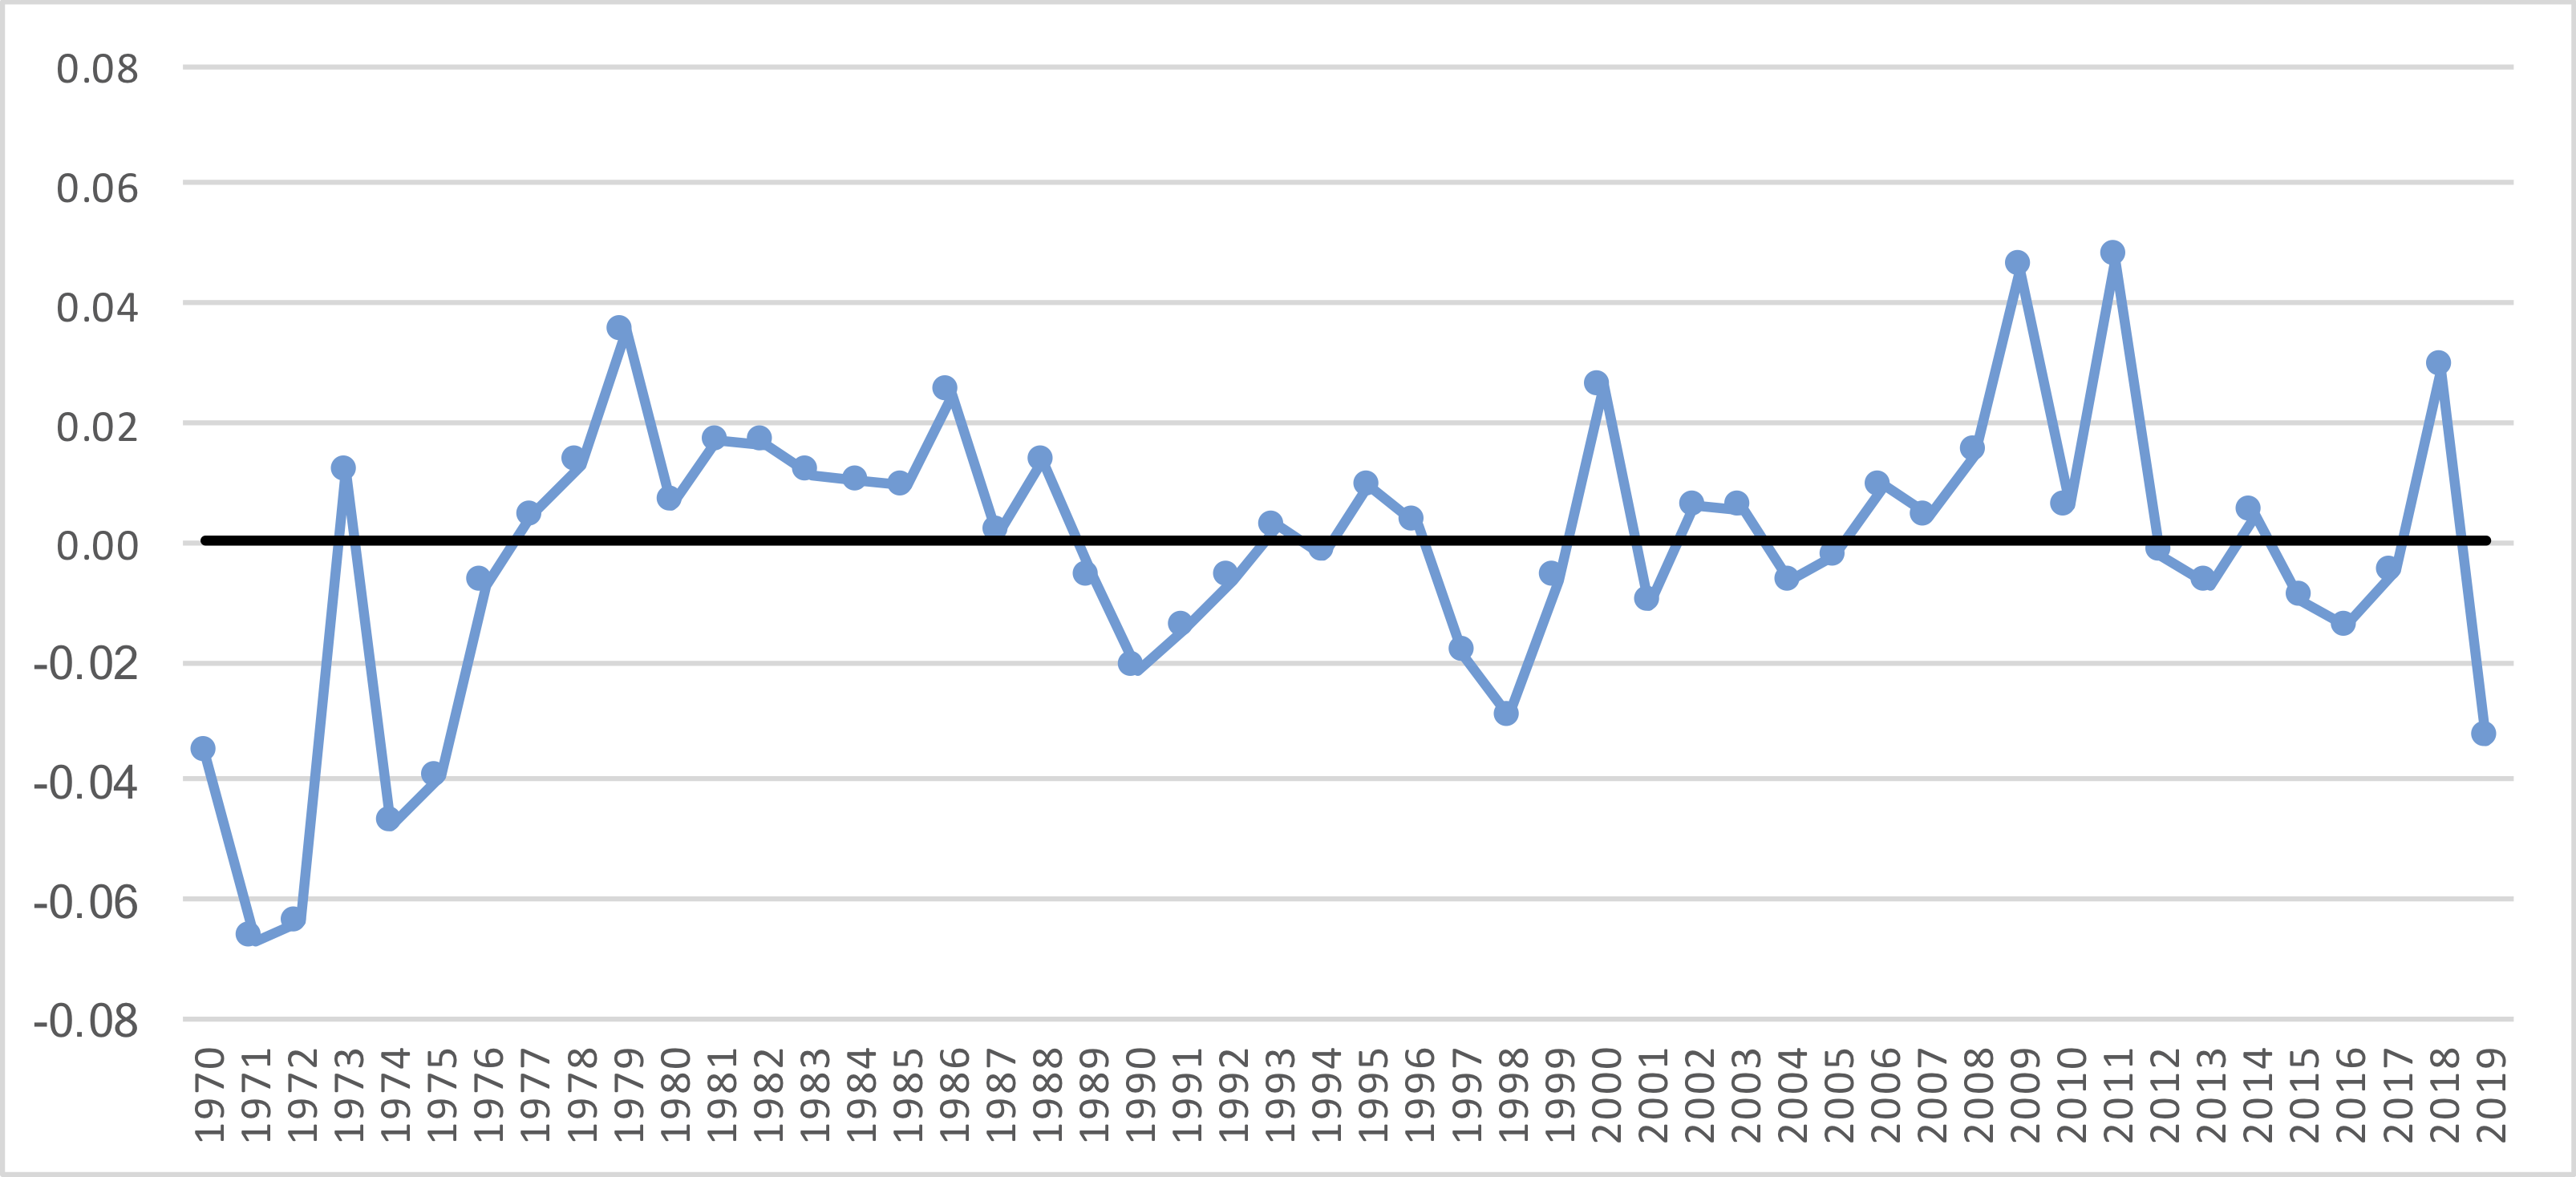
What do you think?
On Sunday, Kirk Cousins became the 19th quarterback to start a game for the Minnesota Vikings in the playoffs. That is, by a large amount, the most quarterbacks to start a playoff game for one franchise since 1950 (the classification of who was the starting quarterback in any given game becomes murkier for several of the seasons prior to 1950).
And just as impressively, Cousins became the 11th different quarterback to start and win a game for the Vikings. Can you guess them all? While you think about that, the table below shows the number of different quarterbacks to start, and the number of different quarterbacks to win, a playoff game for each NFL team since 1950. [continue reading…]
Derrick Henry and the Titans just dethroned the defending Super Bowl champions, in Foxboro, in the Wildcard round of the playoffs. Henry, who led the NFL in rushing yards during the regular season, rushed 34 times for 182 yards and 1 touchdown. Henry also caught one pass for 22 yards, finishing the day with 204 of the Titans 272 yards of offense.
That’s right: Henry himself accounted for exactly 75.0% of the Tennessee offense on Saturday night, the second-largest percentage by a single player in a playoff win in NFL history. Among players with at least 100 yards of offense, only four other players had accounted for even 70% of a team’s total yards in a playoff game:
- In 1981, the Giants beat the Eagles 27-21, as Rob Carpenter rushed 33 times for 161 yards and caught 4 passes for 32 yards. Carpenter had 193 of New York’s 275 yards that day (70.2%).
- In 1976, the Vikings defeated the Rams 24-13, in a game that featured an early special teams touchdown for Minnesota and then a whole lot of Chuck Foreman. The great running back finished with 199 yards from scrimmage on only 20 touches, giving him 74.5% of Minnesota’s 267 yards of offense that day.
- In 1971, Washington lost to the 49ers, 24-21, but don’t blame Larry Brown. The running back would go on to win the AP MVP award the following season, but as a precursor to that performance, Brown rushed 27 times for 84 yards and caught 6 passes for 62 yards and a touchdown, giving him 146 of Washington’s 192 yards of offense. Brown had 76.0% of the team’s output that day in a losing effort.
- In the 1985 playoffs, the Rams shut out the Cowboys, 20-0, in a game that Eric Dickerson dominated. The Hall of Fame back rushed 34 times for 248 times and 2 touchdowns, and while he lost 4 yards on his lone reception, Dickerson still had 244 of Los Angeles’s 316 yards of offense. That gave Dickerson a record 77.2% of his team’s offensive production.