≡ Menu

2019 Team Ratings: Adjusted Yards Per Play

In 2019, the Vikings averaged 7.13 yards per pass play, while the Chargers averaged 7.01 yards per pass play. Yards per pass play here is just Net Yards per Attempt, which is team passing yards (net of sacks) divided by pass attempts (including sacks).

In 2019, the Vikings averaged 4.48 yards per carry, while the Chargers averaged only 3.97 yards per carry.

But in 2019, despite Minnesota being more efficient both at passing and rushing than Los Angeles, the Vikings averaged fewer yards per offensive play than the Chargers: Minnesota averaged 5.83 Y/P, while Los Angeles averaged 5.90 Y/P. Regular readers here know that this is the result of Simpson’s Paradox, a counter-intuitive phenomenon in which a trend appears in different sets of data but reverses when these data are combined.

How does this happen? Because overall, passing is more efficient than running when it comes to yards per play, and the Chargers passed much more frequently than the Vikings. That’s one reason why I don’t like “yards per play” as a statistic to measure offensive production: it’s biased in favor of pass-happy teams.

Instead, I like to use a modified version called adjusted yards per play, which takes 60% of the team’s Yards per Pass average and 40% of the team’s Yards per Carry average. This eliminates any Simpson’s Paradox issues and gives a better sense of which are the most efficient offensive teams.

And here’s your Super Bowl LIV tie-in: the Chiefs averaged more yards per play this year than the 49ers, but San Francisco averaged more adjusted yards per play. Here’s how to read the table below. San Francisco had 514 pass plays for 3,792 yards, averaging 7.38 Net Yards per Attempt. The 49ers had 498 rushing plays for 2,305 yards, averaging 4.63 yards per carry. Overall, this means the 49ers averaged 6.02 yards per play, but San Francisco passed on only 50.8% of plays this season. As a result, the 49ers averaged 6.28 Adjusted Yards per Play (60% of 7.38 plus 40% of 4.63), which was the third-best average this season. The Chiefs rank 5th in this metric: Kansas City averaged 6.22 yards per play and 6.16 adjusted yards per play. And, if you removed the three Matt Moore games (Denver, Green Bay, Minnesota), the Chiefs in the 13 Patrick Mahomes games averaged 6.34 yards per play and 6.29 Adjusted Yards per Play.

[continue reading…]

{ 1 comment }

It has long been established that, on average, winning teams rush for more yards than losing teams. That’s because, among other reasons, the winning team usually has the lead late in the game, causing the winning team to run more frequently and the losing team to run less frequently. Rushing attempts (and therefore, yards) are highly correlated with winning, which is one of the reasons I first started calculating Game Scripts data.

As a result, teams tend to average more rushing yards in victories than defeats. And I’m not breaking any news here when I say that this tenet holds up at the individual player level, too. From 1950 to 2018, there were 69 players who (i) rushed for at least 2,500 yards in games their teams won and also (ii) rushed for at least 2,500 yards in games their teams lost.

And 67 of those players averaged more rushing yards per game in wins than in losses. That, of course, is what you would expect. Earnest Byner is the most extreme player in this regard: in games his team won, Byner averaged 52.2 rushing yards per game; in games his team lost, Byner averaged 25.7 rushing yards per game. And it’s not just the Byners of the world: Hall of Famers with different styles and from different eras — Marshall Faulk (86.0 rushing yards per game in wins, 52.0 in losses), Earl Campbell (107.4, 63.4), O.J. Simpson (112.0, 69.3) and Thurman Thomas (77.6, 44.5) to name a few — have large splits in rushing averages in wins and losses.

But today’s post is about Byner’s teammate on the ’91 Redskins, Gerald Riggs. He is one of just two players (Don Perkins, 56.2, 59.8) in this group who averaged fewer rushing yards per game in wins (60.0) than in losses (66.2). That should be shocking to you as a reader, given that the average running back will have about 40% more rushing yards in wins than losses. So does this mean Riggs actually was a better running back when his team lost the game?

The short answer is, no. Riggs, like every other running back, rushed for more yards when his team won than when his team lost, all else being equal. It’s that last part, though, that is the tricky part.

Riggs had two dominant rushing seasons where he averaged 99 and 107 rushing yards per game: 1984 and 1985. In those two seasons, his Falcons went just 7-24 in the games he played.

Riggs had four strong seasons where he averaged between 50 and 90 rushing yards per game: 1986 to 1989. In those four years, his teams went 20-28-1 in games he played (and I will be ignoring the one tie game for the rest of this article).

Riggs also had four years — two at the beginning of his career and two at the end — where he was a backup and averaged under 50 rushing yards per game. In those four seasons (’82, ’83, ’90, and ’91) his teams went 31-18. Notably, this includes his time on the ’91 Redskins — who went 14-2 and for whom Riggs played every game — when he averaged a career low 15.5 rushing yards per game and retired after the season (after scoring a pair of touchdowns in the Super Bowl, no less).

Regular readers of this site and those familiar with Simpson’s Paradox can surely see what’s coming. During his stud running back days, Riggs played on bad teams that produced just 12% of his career wins but 34% of his career losses. During his days as a solid starter, Riggs played on teams that produced 34% of his career wins and 40% of his career losses. And during his days as a backup, Riggs played on good teams that produced 53% of his career wins and just 26% of his career losses. His time as the third-string running back behind Byner and Ricky Ervins on one of the best teams of all time produced 24% of his career wins but just 3% of his career losses.

So when we look at his career, of course Riggs rushed for more yards in losses than in wins: broadly speaking, he was a reserve in a lot of the games his team won and the center of the offense in many of the games his teams lost.

In 1984, Riggs rushed for 99 yards per game on a 3-12 Falcons team in the games he played. In Atlanta’s three wins, he rushed for 137 yards per game; in the 12 losses, he averaged 90 rushing yards per game. That’s perfectly normal, rushing for significantly more yards per game in wins than losses.

In 1991, Riggs rushed for 16 yards per game on maybe the best team of all time. In wins, he rushed for 17 yards per game, and in losses, he rushed for 2 yards per game. That’s perfectly normal, too: rushing for significantly more yards per game in wins than losses.

But here’s the catch: what if we remove the ’84 and ’91 seasons from Riggs’ career entirely? By removing two years where Riggs rushed for significantly more yards per game in wins than in losses, what happens to his career average? Well, it would mean Riggs would have rushed for 69 yards per game in wins and … 63 yards per game in losses. This, of course, is the heart of Simpson’s Paradox: because of the different sizes of the groups, the results are reversed when we combine the data. It’s counter-intuitive, because Riggs looks better for his career in wins than in losses only after we remove two years where he did much worse in wins than in losses!

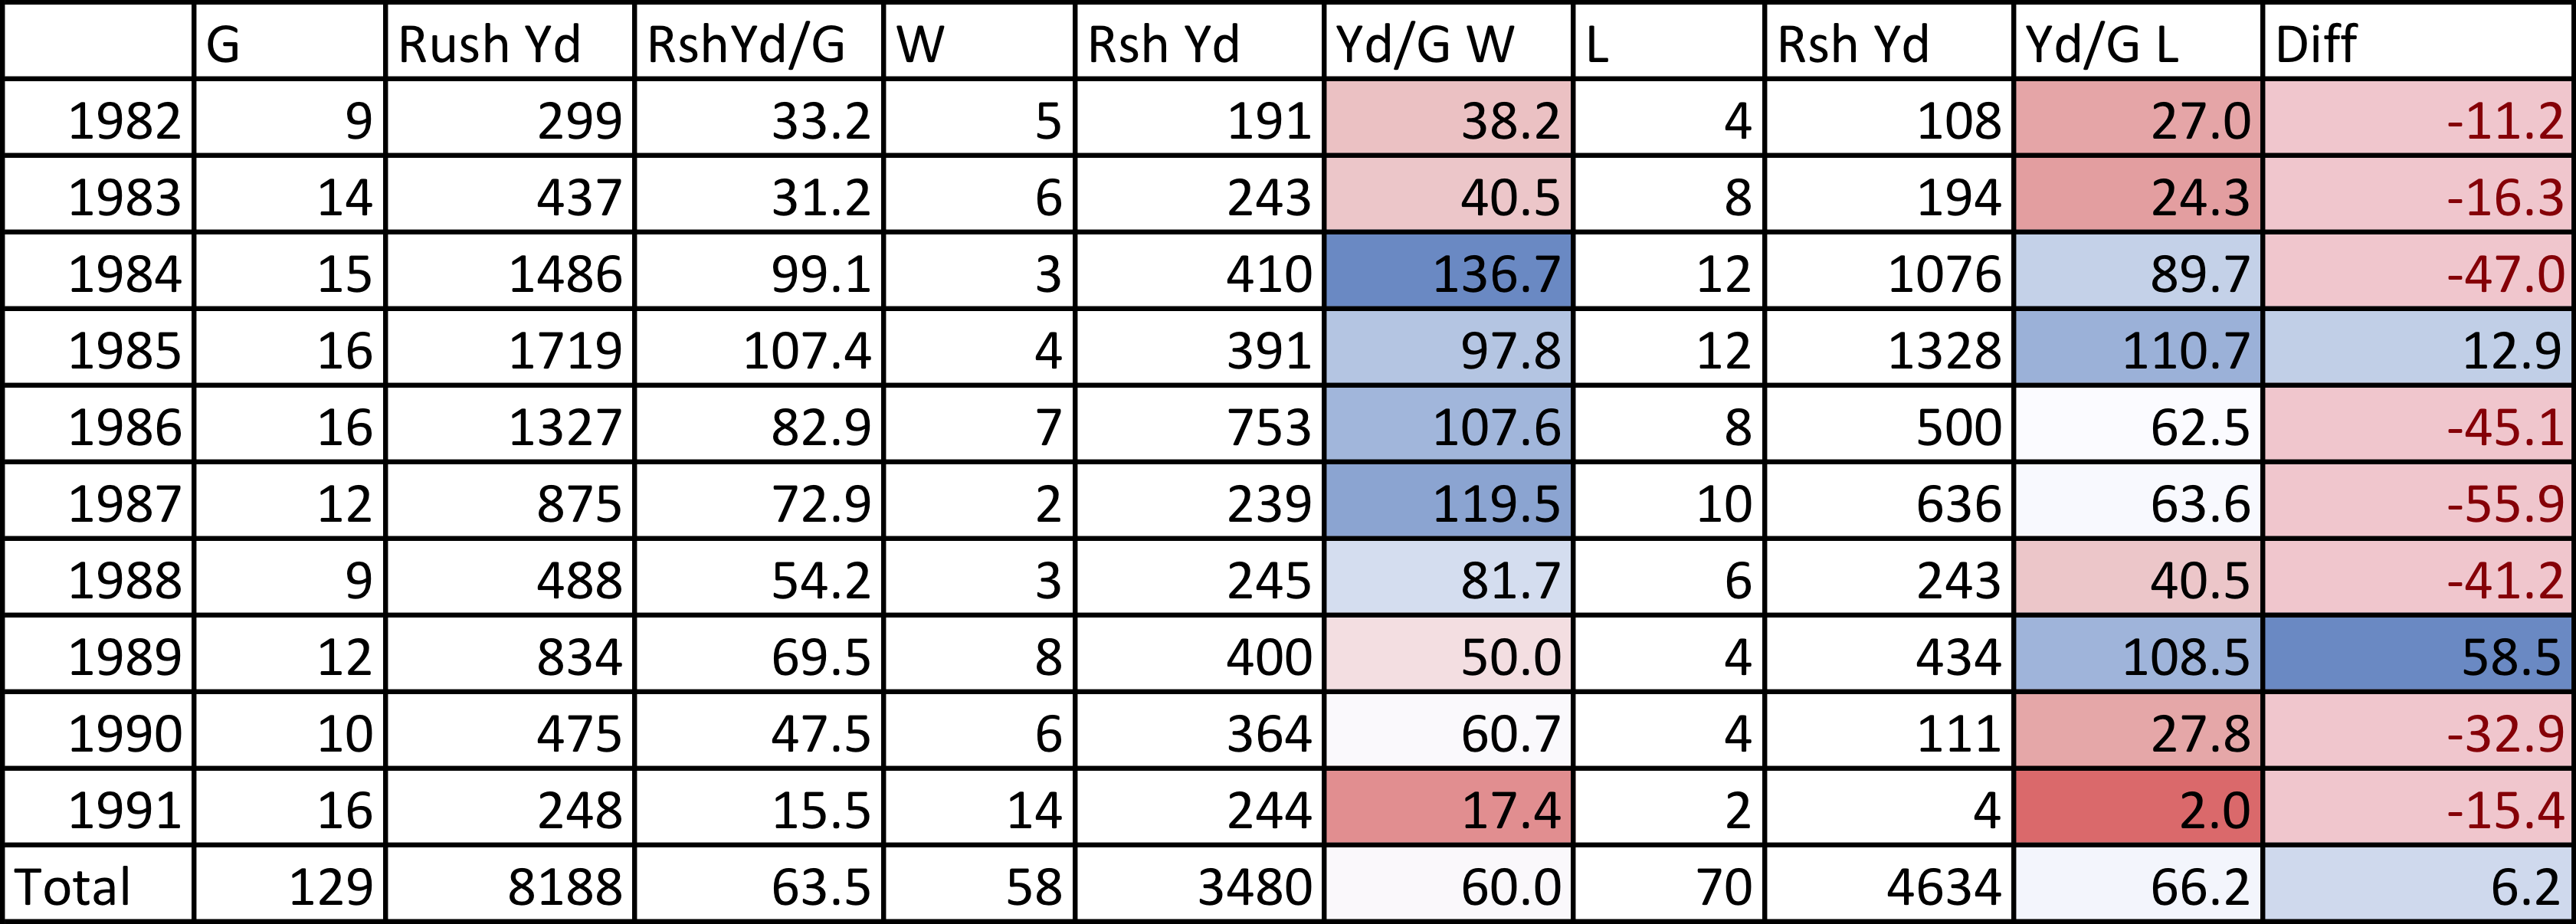
The table below shows Riggs’s career stats by season, and his per-season rushing statistics in wins and losses. The final right column shows how many more rushing yards per game Riggs averaged in losses than in wins each year. As you can see, while this number is a positive 6.2 for his career, in all but two seasons, this number was negative, meaning Riggs averaged more rushing yards per game in wins than losses:

This is what Simpson’s Paradox is all about, and this may be my new favorite example: the 1991 season really deflates his career averages, but it hits his “wins” statistics 8x as powerfully as his “losses” statistics.

And there’s even an easy story to tell about his 1989 season, which looks like a big outlier. After all, Riggs averaged a mediocre 50 rushing yards per game in wins and a superstar-producing 108.5 yards per game in wins. So what happened? In week 2, Riggs rushed for a whopping 211 yards in a win against the Eagles…. except it wasn’t a win; the Redskins led 20-0 early and 37-28 with less than three minutes left in the game, but the Eagles scored two last-minute touchdowns to steal the game and turn this into a great rushing effort in a loss (in part because of Riggs’ game-changing fumble). Had this been a win, Riggs would have averaged 69.0 rushing yards in wins that season, and 71.0 rushing yards per game in losses. And that is only because Riggs lost playing time as the season went along: he was a part-time player by December, when Washington went 4-0 but Riggs averaged only 41 rushing yards per game.

The general rule is that all players average more rushing yards in wins than in losses. And when that’s not true, well, it probably still is true: you just need to figure out how Simpson’s Paradox is mucking up your data.

{ 0 comments }

The Giants, Dolphins, and Simpson’s Paradox

This year, the Giants are averaging 6.35 net yards per pass and 4.18 yards per carry. That’s below-average on both counts, as New York ranks 20th in both categories.

This year, the Dolphins are averaging 6.53 net yards per pass and 4.30 yards per carry. Miami ranks 15th in NY/A and 17th in YPC.

And yet the Giants are averaging more yards per play this year than Miami! How is that possible — after all, plays are just rushes or passes (including sacks), and the Dolphins are averaging more yards per pass and yards per rush. But New York has gained 5.70 yards per play this year, while Miami is averaging only 5.58 yards per play.

The answer, of course, is Simpson’s Paradox. We can also see an example of Simpson’s Paradox with Chicago. This year, the Bears are averaging 6.65 net yards per pass and 4.45 yards per carry. That’s above-average in both categories, as Chicago ranks 12th in both metrics. And yet the Bears rank below the Giants in yards per play, at just 5.65.

This is because the Giants pass a lot, and passes are more effective at gaining yards (even net of sacks) than rushes. The Giants have passed on a league-high 70% of plays, while Miami has passed on 58% of plays and the Bears just 54% of plays.

This happens with a few teams every year. The Jaguars are averaging 6.02 net yards per pass, 4.25 yards per rush, and 5.41 yards per play. The Redskins are averaging 6.12 net yards per pass and 4.33 yards per rush, and yet… Washington is only averaging 5.34 yards per play, a lower average than Jacksonville. That’s because the Jags have passed on 66% of plays, while the Redskins have passed on only 56% of plays. [continue reading…]

{ 0 comments }

Trent Richardson – How Good Is He in Pass Protection?

Richardson exhibiting proper blocking technique

Richardson exhibiting proper blocking technique.

I have some bigger thoughts on the Trent Richardson trade, but I want to first address a statistic I’ve seen cited frequently the past few days. You’ve probably heard some variation on the following, perhaps first reported by ESPN:

Since the start of 2012 with Richardson on the field, Browns quarterbacks were sacked on 4.8 percent of dropbacks. With Richardson off the field, Browns quarterbacks were sacked on 9.4 percent of dropbacks.

Colts quarterbacks have been sacked on 6.2 percent of dropbacks since the start of last season, the ninth-highest rate in the league.

I’ll assume the numbers are accurate, but stats like that don’t mean anything out of context. The conclusion isn’t spelled out, but the reader is asked to connect the dots: Richardson is good at pass protection and Indianapolis could use an upgrade in that department, so this is another reason to like the trade for the Colts. But when is Richardson most likely to be off the field? In obvious passing situations, which happens to be the most likely time the Browns would be sacked.

Brandon Weeden and other Cleveland quarterbacks were sacked 36 times last year and 11 times in the first two games of 2013. First, we should note that Thaddeus Lewis started in week 17 last year against the Steelers — his only start of the year, and the only game Richardson has missed in his pro career. He was sacked four times on 36 dropbacks, an 11.1% rate. So let’s throw that game out, since nobody cares about Lewis’ sack rate.

According to NFLGSIS, Richardson was not on the field for 22 of the 43 sacks of Browns quarterbacks over the last year and two games. But the fine print is the real story: only five of those 22 sacks came on 1st or 2nd down, only seven came when Cleveland had the lead, and only three of those sacks occured when the Browns needed fewer than seven yards for a first down. Take a look:
[continue reading…]

{ 8 comments }

Trent Richardson thinks this guy was an average running back in losses.

Trent Richardson thinks this guy was an average running back in losses.

Yesterday, I noted that Adrian Peterson is averaging nearly two more yards per rush in losses than wins. He’s also averaging a nearly identical number of rushing yards per game in wins and losses.

As you’re about to see, that’s pretty rare. We all know that wins are correlated with rushing yards, so it should come as no surprise that running backs generally gain more rushing yards in wins than in losses.

I looked at all games, including playoffs, from 1960 to 2011, for all players with at least 3,000 rushing yards over that time period. The table below lists the following information for each player:

— His first year (or 1960, if he played before 1960) and his last year (or 2011, if still active)
— All the franchises he played for (which you can search for in the search box)
— His number of career wins, and his career rush attempts, rushing yards, rushing yards per carry, and rushing yards per game in wins
— His number of career losses, and his career rush attempts, rushing yards, rushing yards per carry, and rushing yards per game in losses

The table is sorted by rushing yards per game in wins. Again, for players like Jim Brown or Peterson, they are included but only their stats from 1960 to 2011 are shown. The table only shows the top 50 players, but the search feature works for the entire table, which includes 281 players. In addition, you can click on the drop arrow and change the number of rows shown.

As always, the table is fully sortable. If you click twice on the far right column, you see the career leaders in rushing yards per game in losses. You probably aren’t surprised to see Barry Sanders at the top, but the presence of the running back formerly known as Dom Davis up there is a bit surprising. Steven Jackson is one of the few players who have averaged over 70 rushing yards per game in losses, which jives with the sixth post in Football Perspective history. In addition, Jackson (at least through 2011) and LaDainian Tomlinson form an interesting example of Simpson’s Paradox: Jackson has a higher career rushing yards per game average in both wins (93.9 to 89.9) and losses (71.1 to 63.2), while Tomlinson has the higher career average overall (78.6 to 78.3).

RkPlayerYearsTeamsPosWRsh_WYd_WYPC_WYd/G_WLRsh_LYd_LYPC_LYd/G_L
1Jim Brown1960--1965cleFB55117665905.6119.82538417064.4468.2
2Terrell Davis1995--2001denRB58141568674.85118.42844418804.2367.1
3Barry Sanders1989--1998detRB75167085265.11113.784148371294.8184.9
4Eric Dickerson1983--1993ram-clt-rai-atlRB74177684114.74113.778136855724.0771.4
5O.J. Simpson1969--1979buf-sfoRB4395048185.0711292144263514.469
6Earl Campbell1978--1985oti-norRB50120954094.47108.270111344183.9763.1
7Adrian Peterson2007--2011minRB3879240025.05105.33868530184.4179.4
8Chris Johnson2008--2011otiRB3677237764.89104.92842619414.5669.3
9Clinton Portis2002--2010den-wasRB58128160514.72104.359101940864.0169.3
10Arian Foster2009--2011htxRB2042820774.85103.91628213054.6381.6
11Emmitt Smith1990--2004dal-crdRB1353036131984.3597.8108172267433.9262.4
12Jamal Lewis2000--2009rav-cleRB74165371934.3597.263101938403.7761
13Walter Payton1975--1987chiRB1132460109754.4697.186155863834.174.2
14Larry Johnson2003--2011kan-cin-was-miaRB4081338424.7396.14362724133.8556.1
15Edgerrin James1999--2009clt-crd-seaRB99225194694.2195.66299536293.6558.5
16Billy Sims1980--1984detRB3060328614.7495.43255423784.2974.3
17Curtis Martin1995--2005nwe-nyjRB96223591344.0995.182146557623.9370.3
18Frank Gore2005--2011sfoRB4793944224.7194.15574333664.5361.2
19Jamaal Charles2008--2011kanRB1621815046.9943429016055.5347.2
20Steven Jackson2004--2011ramRB3776934734.5293.980138856884.171.1
21Shaun Alexander2000--2008sea-wasRB73150666074.3990.55985034104.0157.8
22LaDainian Tomlinson2001--2011sdg-nyjRB104204893464.5689.976125748063.8263.2
23Corey Dillon1997--2006cin-nweRB72139164604.6489.786134752893.9361.5
24Rudi Johnson2001--2008cin-detRB4190136724.0889.65262923633.7645.4
25Eddie George1996--2004oti-dalRB90209478633.7687.46097733543.4355.9
26Wilbert Montgomery1977--1985phi-detRB55101647664.6986.75465225133.8546.5
27Fred Taylor1998--2010jax-nweRB89158876744.8386.272107546344.3164.4
28Jamal Anderson1994--2001atlRB3776731894.1686.24763224233.8351.6
29Gale Sayers1965--1971chiRB2942624925.8585.93651021224.1658.9
30Barry Foster1990--1994pitRB3570429974.2685.62327512304.4753.5
31Curt Warner1983--1990sea-ramRB55113347044.1585.54863623893.7649.8
32Matt Forte2008--2011chiRB3566129854.5285.32739513983.5451.8
33Cookie Gilchrist1962--1967buf-den-miaFB3462528714.5984.43137213813.7144.5
34William Andrews1979--1986atlRB4374936094.8283.94258624394.1658.1
35Marshall Faulk1994--2005clt-ramRB99177483074.6883.989122745743.7351.4
36John Henry Johnson1960--1966pit-otiFB-HB3258926824.5583.83843517183.9545.2
37Tony Dorsett1977--1988dal-denRB1212237101374.5383.868100139853.9858.6
38Jerome Bettis1993--2005ram-pitRB111233392743.9883.593134550623.7654.4
39Priest Holmes1997--2007rav-kanRB61109350774.6583.24972933164.5567.7
40Ricky Watters1992--2001sfo-phi-seaRB91182375524.14836396337203.8659
41Jim Nance1965--1973nwe-nyjRB3057124554.381.86268025853.841.7
42Robert Smith1993--2000minRB63103951464.9581.74151722624.3855.2
43George Rogers1981--1987nor-wasRB53100943264.2981.64577231284.0569.5
44Jim Taylor1960--1967gnb-norFB81146865764.4881.23140115823.9551
45Travis Henry2001--2007buf-oti-denRB3667229064.3280.75281631803.961.2
46Willie Parker2004--2009pitRB5597744364.5480.72740314133.5152.3
47Ray Rice2008--2011ravRB4579236274.5880.62227411944.3654.3
48Maurice Jones-Drew2006--2011jaxRB4577636164.6680.45072232864.5565.7
49Deuce McAllister2001--2008norRB5091340174.480.34754322404.1347.7
50Thurman Thomas1988--2000buf-miaRB1302373103784.3779.87184331383.7244.2
51Terry Allen1991--2001min-was-nwe-nor-ravRB69130355044.2279.86589032633.6750.2
52Fred Jackson2007--2011bufRB2539319805.0479.24042418144.2845.4
53Jonathan Stewart2008--2011carRB2841422175.3679.23531412954.1237
54Franco Harris1972--1984pit-seaRB1362553106824.1878.55577629243.7753.2
55John Riggins1971--1985nyj-wasRB103204880883.9578.579111942603.8153.9
56Tiki Barber1997--2006nygRB80127762694.9178.480105446324.3957.9
57Lydell Mitchell1972--1980clt-sdg-ramRB58110344724.0577.14964522803.5346.5
58Ricky Williams1999--2011nor-mia-ravRB81148662214.1976.8709673868455.3
59Greg Bell1984--1990buf-ram-raiRB3559626414.4375.55068426763.9153.5
60Marshawn Lynch2007--2011buf-seaRB3159223373.9575.44356823384.1254.4
61Stephen Davis1996--2006was-car-ramRB72123454224.3975.36380731013.8449.2
62LeSean McCoy2009--2011phiRB2842721004.9275202259964.4349.8
63Domanick Williams2003--2005htxRB122268983.9774.82854422974.2282
64Hoyle Granger1966--1972oti-norRB2744320134.5474.63835815304.2740.3
65DeAngelo Williams2006--2011carRB3855728335.0974.64345122775.0553
66Rodney Hampton1990--1997nygRB56104841223.9373.65182629693.5958.2
67Ahman Green1998--2009sea-gnb-htxRB89141665454.6273.56375931814.1950.5
68Earnest Jackson1983--1988sdg-phi-pitRB3154422794.1973.54451518883.6742.9
69Lawrence McCutcheon1973--1981ram-den-sea-bufRB75124354624.3972.83842216934.0144.6
70Freeman McNeil1981--1992nyjRB71113251094.51727578233644.344.9
71Rashard Mendenhall2008--2011pitRB3764626434.0971.4172289544.1856.1
72Warrick Dunn1997--2008tam-atlRB98161869964.3271.492116743713.7547.5
73Cedric Benson2005--2011chi-cinRB5092535683.8671.44564724463.7854.4
74Natrone Means1993--1999sdg-jaxRB55100439173.971.23954919483.5549.9
75Gary Brown1991--1999oti-sdg-nygRB4061928414.59713542414763.4842.2
76Michael Turner2004--2011sdg-atlRB76113053914.7770.93837614573.8838.3
77Christian Okoye1987--1992kanRB447803120470.93544717713.9650.6
78Karim Abdul-Jabbar1996--2000mia-cle-cltRB3365123393.5970.93138811883.0638.3
79Garrison Hearst1993--2004crd-cin-sfo-denRB76121053854.4570.95568128404.1751.6
80Joe Morris1982--1991nyg-cleRB63110344604.0470.85044816783.7533.6
81Johnny Johnson1990--1994crd-nyjRB2442816853.9470.24761823933.8750.9
82Thomas Jones2000--2011crd-tam-chi-nyj-kanRB88154161543.9969.999126249503.9250
83Chuck Muncie1976--1984nor-sdgRB5181735544.3569.76585436644.2956.4
84Chuck Foreman1973--1980min-nweRB77132453184.0269.13842614093.3137.1
85Ottis Anderson1979--1992crd-nygRB94163064893.986980103342174.0852.7
86Larry Csonka1968--1979mia-nygRB91138762234.4968.46469125873.7440.4
87Randy McMillan1981--1986cltRB2028213654.8468.36669524843.5737.6
88John Brockington1971--1977gnb-kanRB3663724563.8668.25465123083.5542.7
89Ryan Grant2007--2011gnbRB4567030524.5667.82231312914.1258.7
90Willis McGahee2004--2011buf-rav-denRB66104244154.2466.96185933593.9155.1
91Ron A. Johnson1969--1975cle-nygRB3762924263.8665.64153317293.2442.2
92Joe Cribbs1980--1988buf-sfo-miaRB5583435804.2965.14952319613.7540
93Marcus Allen1982--1997rai-kanRB145222194334.2565.191106841573.8945.7
94Antowain Smith1997--2005buf-nwe-oti-norRB75124848723.9656167425593.842
95Larry Brown1969--1976wasRB69117144413.7964.43546417803.8450.9
96Kevin Jones2004--2008det-chiRB2232614154.3464.34146917613.7543
97Floyd Little1967--1975denRB4573828803.9646782031873.8947.6
98Wendell Tyler1977--1986ram-sfoRB7193145104.8463.54655024434.4453.1
99Ricky Bell1977--1982tam-sdgRB253971588463.53846215913.4441.9
100Abner Haynes1960--1967kan-den-mia-nyjHB4860130465.0763.56043915923.6326.5
101Cadillac Williams2005--2011tam-ramRB3350520944.1563.55056819933.5139.9
102Clem Daniels1960--1968kan-rai-sfoRB5168932364.763.54940116694.1634.1
103Pete Johnson1977--1984cin-sdg-miaRB64102839953.8962.45053818793.4937.6
104Leonard Russell1991--1996nwe-den-ram-sdgRB3154919343.5262.45161520393.3240
105Bam Morris1994--1999pit-rav-chi-kanRB396052423462.13744416363.6844.2
106Rueben Mayes1986--1993nor-seaRB3655522334.02624031412624.0231.6
107Errict Rhett1994--2000tam-rav-cleRB3663522133.4961.54253919303.5846
108Anthony Thomas2001--2007chi-dal-nor-bufRB3962823953.8161.44943115323.5531.3
109James Wilder1981--1990tam-detRB3248119644.0861.486112341603.748.4
110Joseph Addai2006--2011cltRB6294338044.0361.42631012704.148.8
111Marion Butts1989--1995sdg-nwe-otiRB507663067461.35560122623.7641.1
112Matt Snell1964--1972nyjRB4264125734.0161.33543518494.2552.8
113Delvin Williams1974--1980sfo-miaRB5174531154.1861.14758825254.2953.7
114James Brooks1981--1992sdg-cin-cle-tamRB8397650605.18618676731184.0736.3
115Kevin Mack1985--1993cleRB5175331094.13615464524383.7845.1
116Mike Thomas1975--1980was-sdgRB5279631633.9760.82831911483.641
117Neal Anderson1986--1993chiRB6899241304.1660.74960423153.8347.2
118Paul Lowe1960--1969sdg-kanHB6676739985.2160.62822810754.7138.4
119DeShaun Foster2003--2008car-sfoRB4768928334.1160.33332311383.5234.5
120Napoleon Kaufman1995--2000raiRB4651227605.39604646720364.3644.3
121Mike Garrett1966--1973kan-sdgRB6282337124.5159.94147717033.5741.5
122Dave Hampton1969--1976gnb-atl-phiRB3654721443.9259.65558322963.9441.7
123Leroy Kelly1964--1973cleRB92126854654.3159.44953821453.9943.8
124Sam Cunningham1973--1982nweRB5380031333.9259.15261524303.9546.7
125Duce Staley1997--2006phi-pitRB6692338814.258.85262123683.8145.5
126Charlie Garner1994--2004phi-sfo-rai-tamRB6983040354.8658.58278435034.4742.7
127Mike Rozier1985--1991oti-atlRB4565426224.0158.35256020223.6138.9
128Brian Westbrook2002--2010phi-sfoRB8097146604.858.34952922064.1745
129Mark van Eeghen1974--1983rai-nweRB96139355613.9957.94143217143.9741.8
130Julius Jones2004--2010dal-sea-norRB4868427754.0657.84863624723.8951.5
131Marion Barber2005--2011dal-chiRB5978334074.3557.74441415243.6834.6
132James Stewart1995--2002jax-detRB5482831083.7557.65368128954.2554.6
133Eddie Lee Ivery1979--1986gnbRB3540720144.9557.5342448913.6526.2
134Ken Willard1965--1974sfo-crdRB69100339553.9457.35857919633.3933.8
135Mike Pruitt1976--1986cle-buf-kanRB6794438404.0757.37692136053.9147.4
136Marv Hubbard1969--1977rai-detRB6676737734.9257.2242258673.8536.1
137Gerald Riggs1982--1991atl-wasRB6289435443.9657.272111046904.2365.1
138Ronnie Brown2005--2011mia-phiRB4359624484.1156.95058625224.350.4
139Adrian Murrell1993--2003nyj-crd-was-dalRB4463724943.9256.77276528623.7439.8
140Don Perkins1961--1968dalFB-HB5575831074.156.55175430794.0860.4
141Lamar Smith1994--2003sea-nor-mia-carRB5481130433.7556.45856520303.5935
142Mike Anderson2000--2007den-ravRB5871632544.5456.1402509763.924.4
143J.D. Smith1960--1966sfo-dalFB-HB3345118504.156.13641115643.8143.4
144Ted Brown1979--1986minRB5066027994.24565649919073.8234.1
145Dick Bass1960--1969ramFB-HB4759026124.4355.65956725044.4242.4
146Sammy Winder1982--1990denRB80119544433.7255.55242313563.2126.1
147Emerson Boozer1966--1975nyjRB5477429843.8655.35851820924.0436.1
148Ed Podolak1969--1977kanRB4865526304.0254.84742314823.531.5
149Earnest Byner1984--1997cle-was-ravRB111152260643.9854.610275730344.0129.7
150Brandon Jacobs2005--2011nygRB7186238694.4954.53933614414.2936.9
151Roger Craig1983--1993sfo-rai-minRB127165868734.1554.15352921063.9839.7
152Mel Farr1967--1973detRB3137716774.4554.1272929603.2935.6
153Bobby Humphrey1989--1992den-miaRB3342217814.22542234213383.9160.8
154Jim Otis1970--1978nor-kan-crdRB5778230573.9153.65139113353.4126.2
155Chris Warren1990--2000sea-dal-phiRB7087237434.2953.59194840614.2844.6
156Ahmad Bradshaw2007--2011nygRB5256527804.9253.5272469173.7334
157John Stephens1988--1993nwe-gnb-kanRB2841014773.652.85953519633.6733.3
158Gary W. Anderson1985--1993sdg-tam-detRB3642018994.5252.87344915103.3620.7
159Otis Armstrong1973--1980denRB5872130554.2452.73932114084.3936.1
160Mercury Morris1969--1976mia-sdgRB7473738965.2952.6331616824.2420.7
161Kevan Barlow2001--2006sfo-nyjRB3745119464.3152.65058320743.5641.5
162Tom Sullivan1972--1978phi-cleRB2637513593.6252.35148316833.4833
163Reggie Cobb1990--1996tam-gnb-jax-nyjRB2940715143.7252.26267022553.3736.4
164Hewritt Dixon1963--1970den-raiRB-TE5567728614.2352381615533.4314.6
165Altie Taylor1969--1976det-otiRB5471827943.8951.74541714063.3731.2
166Tony Collins1981--1990nwe-miaRB5668228854.2351.55355619623.5337
167Sherman Smith1976--1983sea-sdgRB3540317924.4551.25343117284.0132.6
168Justin Fargas2003--2009raiFB2528712784.4551.16554020913.8732.2
169Edgar Bennett1992--1999gnb-chiRB6489932643.63514737912893.427.4
170Terry Metcalf1973--1981crd-wasRB-WR4649923414.6950.93628212164.3133.8
171Calvin Hill1969--1981dal-was-cleRB96114548844.2750.95439515593.9528.9
172Michael Vick2001--2011atl-phiQB6545932877.1650.65129721657.2942.5
173MacArthur Lane1968--1978crd-gnb-kanRB5260226204.3550.46755118843.4228.1
174Larry Kinnebrew1983--1990cin-bufRB3745818634.0750.44032812873.9232.2
175Gerry Ellis1980--1986gnbRB4647923144.8350.35435014994.2827.8
176Barry Word1987--1993nor-kan-minRB4554122354.1349.7242238593.8535.8
177Johnny Roland1966--1973crd-nygRB4050119683.9349.24742714583.4131
178Herschel Walker1986--1997dal-min-phi-nygRB8496241224.2849.1106102042354.1540
179Curtis Dickey1980--1986clt-cleRB3038314673.8348.95155325454.649.9
180Keith Lincoln1961--1968sdg-bufFB-HB4744022945.2148.83830812554.0733
181Boobie Clark1973--1980cin-otiRB4860123113.8548.1312258373.7227
182Clarence Davis1971--1978raiRB7375935114.6348.1251666253.7725
183Michael Pittman1998--2008crd-tam-denRB6978233154.24488166524993.7630.9
184Tom Woodeshick1963--1972phi-crdRB3134614834.2947.85045619224.2138.4
185Tyrone Wheatley1995--2004nyg-raiRB6781831853.8947.56149218783.8230.8
186Charley Tolar1960--1966otiFB4657621733.7747.24235411833.3428.2
187Frank Pollard1980--1988pitRB5255124484.4447.15044717723.9635.4
188Lorenzo White1988--1995oti-cleRB5461225384.15475952619683.7433.4
189Ron Dayne2000--2007nyg-den-htxRB5469325373.66474232012713.9730.3
190Walter Abercrombie1982--1988pit-phiRB4551621134.09474236914233.8633.9
191Harvey Williams1991--1998kan-raiRB5363224873.9446.95541115283.7227.8
192Don Calhoun1974--1981buf-nweRB5557725324.39463928810443.6326.8
193Greg Hill1994--1999kan-ram-detRB5357924394.2146281967954.0628.4
194Roland Harper1975--1982chiRB3439815543.945.74036415014.1237.5
195Rob Carpenter1977--1986oti-nyg-ramRB7690434493.8245.44835412463.5226
196Dexter Bussey1974--1984detRB5757825714.4545.17662825514.0633.6
197Wray Carlton1960--1967bufHB-FB4347219354.1453833814024.1536.9
198John David Crow1960--1968crd-sfoHB-TE5253923244.3144.74535514254.0131.7
199Mike Alstott1996--2006tamRB89100239483.9444.47946914813.1618.7
200Dalton Hilliard1986--1993norRB6576228643.7644.14438313643.5631
201Joe Washington1977--1985sdg-clt-was-atlRB6467228194.19446254220763.8333.5
202Wilbur Jackson1974--1982sfo-wasRB3637115744.2443.76060823053.7938.4
203Nick Pietrosante1960--1967det-cleFB5052021854.243.73630612414.0634.5
204Mario Bates1994--2000nor-crd-detRB3844016443.7443.35341614393.4627.2
205Les Josephson1964--1974ramRB5855225014.5343.1352006283.1417.9
206Reggie Bush2006--2011nor-miaRB4542919384.5243.13634914384.1239.9
207Rocky Bleier1968--1980pitRB8586136024.1842.4362077403.5720.6
208Chris Brown2003--2009oti-htxRB3230213524.4842.33844217814.0346.9
209James R. Jones1983--1992det-seaFB-TE3742915553.62427557520243.5227
210Charlie H. Smith1968--1975rai-sdgRB6672127513.8241.7221737154.1332.5
211Don Woods1974--1980sdg-sfoRB2933812053.5741.64042518824.4347.1
212Wayne Morris1976--1984crd-sdgRB4749619513.9341.56439914323.5922.4
213LaMont Jordan2001--2009nyj-rai-nwe-denRB5346721804.6741.16046917703.7729.5
214Ernie Green1962--1968cleHB-FB6455626214.7141271346544.8824.2
215Doug Kotar1974--1981nygRB3132412533.8740.45857621273.6936.7
216Dorsey Levens1994--2004gnb-phi-nygRB104102841824.0740.24838014753.8830.7
217Charles White1980--1988cle-ramRB5148720394.19405130310683.5220.9
218Craig Heyward1988--1998nor-chi-atl-ram-cltRB7164728374.38407240715183.7321.1
219Reuben Droughns2001--2008det-den-cle-nygRB5047819934.1739.94745916383.5734.9
220Johnny Hector1983--1992nyjRB5856923064.0539.86348920074.131.9
221Harold Green1990--1998cin-ram-atlRB4744218664.2239.77872025543.5532.7
222Amos Marsh1961--1967dal-detHB-FB3126412224.6339.45241216554.0231.8
223Dave Osborn1965--1976min-gnbRB8288632323.6539.44735213123.7327.9
224Cid Edwards1968--1975crd-sdg-chiRB2923511434.8639.4494181670434.1
225Tom Matte1961--1972cltRB9494237003.9339.44329811473.8526.7
226John L. Williams1986--1995sea-pitFB8173931724.2939.27553119393.6525.9
227Ladell Betts2002--2010was-norRB5248120164.1938.86035613553.8122.6
228Walt Garrison1966--1974dalRB8777733194.2738.1372369754.1326.4
229Michael Bennett2001--2010min-kan-tam-sdg-raiRB4742417884.22386044020084.5633.5
230Wendell Hayes1963--1974dal-den-kanRB625872349437.95840114453.624.9
231Willie Ellison1967--1974ram-kanRB5549020624.2137.52624810164.139.1
232Essex Johnson1968--1976cin-tamRB4839917894.4837.36532914614.4422.5
233Jim Kiick1968--1977mia-denRB8079129723.7637.23431310563.3731.1
234Stump Mitchell1981--1989crdRB5143918904.3137.16451425735.0140.2
235John Fuqua1969--1976nyg-pitRB5752421014.0136.93723910874.5529.4
236Robert Newhouse1972--1983dalRB115103042374.1136.84230411983.9428.5
237Curtis McClinton1962--1968kanFB-TE5851721344.1336.8322429784.0430.6
238Leroy Hoard1990--1999cle-rav-car-minRB7667727964.1336.87039213973.5620
239Merril Hoge1987--1994pit-chiRB5650520274.0136.25435913593.7925.2
240Charlie Harraway1966--1973cle-wasRB6258822403.8136.1342759213.3527.1
241Larry Garron1960--1968nweHB-FB5245718774.1136.1372609193.5324.8
242Correll Buckhalter2001--2010phi-denRB6249022224.5335.8482229594.3220
243Erric Pegram1991--1997atl-pit-sdg-nygRB5856420673.6635.64132714504.4335.4
244Carl Garrett1969--1977nwe-chi-nyj-raiRB5043517524.03356460424784.138.7
245Rickey Young1975--1983sdg-minRB5852820323.85357347216053.422
246Greg Pruitt1973--1984cle-raiRB8861430785.01357157725174.3635.5
247Darrin Nelson1982--1992min-sdgRB7358325454.3734.97648320674.2827.2
248Lenny Moore1960--1967cltRB-WR5846720114.3134.7332479863.9929.9
249Donny Anderson1966--1974gnb-crdRB6859423493.9534.55758922563.8339.6
250Kenneth Davis1986--1994gnb-bufRB7760326564.434.55433313714.1225.4
251Tommy Mason1961--1971min-ram-wasRB6154421023.8634.55542418554.3833.7
252Chester Taylor2002--2011rav-min-chi-crdRB8672629534.0734.37047019324.1127.6
253Tony Nathan1979--1987miaRB8963630474.7934.2452149504.4421.1
254Dominic Rhodes2001--2010clt-raiRB7057823874.1334.14033413063.9132.7
255Timmy Brown1960--1968phi-cltRB5139017244.4233.85346320054.3337.8
256Dick Hoak1961--1970pitRB-WR4341314203.44337963823073.6229.2
257Bill Mathis1960--1969nyjFB-HB6661521643.5232.86041713803.3123
258Earl Gros1962--1970gnb-phi-pit-norFB4434814414.1432.85245516733.6832.2
259Bill Brown1961--1974chi-minRB9689331383.5132.77770924613.4732
260Anthony Johnson1990--2000clt-nyj-chi-car-jaxRB5348217123.5532.37437113893.7418.8
261Jess Phillips1968--1977cin-nor-rai-nweRB6244419804.4631.96145116013.5526.2
262Terry Kirby1993--2002mia-sfo-cle-raiRB6853821564.0131.75130510193.3420
263Ronnie Bull1962--1971chi-phiRB6052018963.6531.64932712483.8225.5
264Norm Bulaich1970--1979clt-phi-miaRB7255222754.1231.64630011953.9826
265John Cappelletti1974--1983ram-sdgRB7767624103.5731.3341836243.4118.4
266Sammy Morris2000--2011buf-mia-nwe-dalRB6544319894.4930.66529410733.6516.5
267Pete Banaszak1966--1978raiRB11386734533.9830.6401856373.4415.9
268Cullen Bryant1973--1987ram-seaRB9571827463.8228.9522449653.9518.6
269Maurice Morris2002--2011sea-detRB7653521694.0528.57637416004.2821.1
270Randall Cunningham1985--2001phi-min-dal-ravQB9848627015.5627.67333424757.4133.9
271Tony Galbreath1976--1987nor-min-nygRB7950421244.2126.99054420213.7222.5
272Matt Suhey1980--1989chiRB8460222573.7526.9592698453.1414.3
273Kordell Stewart1995--2005pit-chi-ravQB7641019924.8626.25420411645.7121.6
274Steve Young1985--1999tam-sfoQB12555032365.8825.96026815975.9626.6
275Steve McNair1995--2007oti-ravQB10047924885.1924.97224514575.9520.2
276Donovan McNabb1999--2011phi-was-minQB10645823915.2222.67422914886.520.1
277Kevin Faulk1999--2011nweRB12565327434.221.95429912894.3123.9
278Preston Pearson1968--1980clt-pit-dalRB11860723803.9220.25837713313.5322.9
279Keith Byars1986--1998phi-mia-nwe-nyjFB-TE11953718933.5315.97931811543.6314.6
280John Elway1983--1998denQB16359822793.81149226615535.8416.9
281Fran Tarkenton1961--1978min-nygQB13139017104.3813.111729219346.6216.5

[continue reading…]

{ 4 comments }

One of my law school professors was very quirky, even by law school professor standards. His preferred examination method was multiple choice, but with a twist. After grading each exam, he would then divide the students into quarters based on their test score. He would then re-examine each question, and measure how the top quarter of students performed on each question relative to the bottom quarter. Any question that more bottom-quarter students answered correctly than top-quarter students would be thrown out, and the exam would be re-graded. As he delicately put out, ‘if the wrong students are getting the question right, and the right students are getting the question wrong, it’s a bad question.’

NFL passing records are falling for a variety of reasons these days, including rules changes and league policies that make the passing game more effective. But there’s another reason: for the first time in awhile, the right people are throwing the most passes in the league. And there’s no better example of that than Drew Brees. Since coming to the Saints in 2006, he’s ranked 1st or 2nd in pass attempts four times, and ranked in the top three in net yards per attempt four times. But even since ’06, we’ve seen the passing game evolve, as the best quarterbacks are now the most likely ones to finish near the top of the leaderboard in pass attempts. In 2010, Peyton Manning had his first 600-attempt season… when he threw 679 passes for the Colts. Tom Brady threw 611 passes last year for the 13-3 Patriots, making New England one of just three teams to threw 600 pass attempts and win 13 or more games in a season. The other two teams? The ’09 Colts and the ’11 Saints.

At various points in the history of the NFL, passing was viewed as an alternative to running, and the high-attempt game was the province of the trailing team. But times are changing in the NFL. I calculated each team’s net yards per attempt (NY/A) and total pass attempts (attempts plus sacks) for every year since 1970. Then, I measured the correlation coefficient between NY/A and pass attempts for the league for each of the last 42 seasons. The chart below shows the correlation coefficient between those two variables (NY/A and pass attempts) for the league as a whole for each year since the merger:
[continue reading…]

{ 1 comment }