
In 2019, the Vikings averaged 7.13 yards per pass play, while the Chargers averaged 7.01 yards per pass play. Yards per pass play here is just Net Yards per Attempt, which is team passing yards (net of sacks) divided by pass attempts (including sacks).
In 2019, the Vikings averaged 4.48 yards per carry, while the Chargers averaged only 3.97 yards per carry.
But in 2019, despite Minnesota being more efficient both at passing and rushing than Los Angeles, the Vikings averaged fewer yards per offensive play than the Chargers: Minnesota averaged 5.83 Y/P, while Los Angeles averaged 5.90 Y/P. Regular readers here know that this is the result of Simpson’s Paradox, a counter-intuitive phenomenon in which a trend appears in different sets of data but reverses when these data are combined.
How does this happen? Because overall, passing is more efficient than running when it comes to yards per play, and the Chargers passed much more frequently than the Vikings. That’s one reason why I don’t like “yards per play” as a statistic to measure offensive production: it’s biased in favor of pass-happy teams.
Instead, I like to use a modified version called adjusted yards per play, which takes 60% of the team’s Yards per Pass average and 40% of the team’s Yards per Carry average. This eliminates any Simpson’s Paradox issues and gives a better sense of which are the most efficient offensive teams.
And here’s your Super Bowl LIV tie-in: the Chiefs averaged more yards per play this year than the 49ers, but San Francisco averaged more adjusted yards per play. Here’s how to read the table below. San Francisco had 514 pass plays for 3,792 yards, averaging 7.38 Net Yards per Attempt. The 49ers had 498 rushing plays for 2,305 yards, averaging 4.63 yards per carry. Overall, this means the 49ers averaged 6.02 yards per play, but San Francisco passed on only 50.8% of plays this season. As a result, the 49ers averaged 6.28 Adjusted Yards per Play (60% of 7.38 plus 40% of 4.63), which was the third-best average this season. The Chiefs rank 5th in this metric: Kansas City averaged 6.22 yards per play and 6.16 adjusted yards per play. And, if you removed the three Matt Moore games (Denver, Green Bay, Minnesota), the Chiefs in the 13 Patrick Mahomes games averaged 6.34 yards per play and 6.29 Adjusted Yards per Play.
| Rk | Tm | Pass Plays | Pass Yards | NY/A | Att | Yds | YPC | Y/P | Pass Ratio | Adj Y/P |
|---|---|---|---|---|---|---|---|---|---|---|
| 1 | DAL | 620 | 4751 | 7.66 | 449 | 2153 | 4.80 | 6.46 | 58% | 6.52 |
| 2 | BAL | 468 | 3225 | 6.89 | 596 | 3296 | 5.53 | 6.13 | 44% | 6.35 |
| 3 | SFO | 514 | 3792 | 7.38 | 498 | 2305 | 4.63 | 6.02 | 50.8% | 6.28 |
| 4 | TEN | 504 | 3582 | 7.11 | 445 | 2223 | 5.00 | 6.12 | 53.1% | 6.26 |
| 5 | KAN | 601 | 4498 | 7.48 | 375 | 1569 | 4.18 | 6.22 | 61.6% | 6.16 |
| 6 | MIN | 494 | 3523 | 7.13 | 476 | 2133 | 4.48 | 5.83 | 50.9% | 6.07 |
| 7 | OAK | 552 | 3926 | 7.11 | 437 | 1893 | 4.33 | 5.88 | 55.8% | 6.00 |
| 8 | NOR | 606 | 4244 | 7.00 | 405 | 1738 | 4.29 | 5.92 | 59.9% | 5.92 |
| 9 | SEA | 565 | 3791 | 6.71 | 481 | 2200 | 4.57 | 5.73 | 54% | 5.86 |
| 10 | LAC | 631 | 4426 | 7.01 | 366 | 1453 | 3.97 | 5.90 | 63.3% | 5.80 |
| 11 | TAM | 677 | 4845 | 7.16 | 409 | 1521 | 3.72 | 5.86 | 62.3% | 5.78 |
| 12 | HOU | 583 | 3783 | 6.49 | 434 | 2009 | 4.63 | 5.70 | 57.3% | 5.74 |
| 13 | LAR | 654 | 4499 | 6.88 | 401 | 1499 | 3.74 | 5.69 | 62% | 5.62 |
| 14 | CLE | 580 | 3554 | 6.13 | 393 | 1901 | 4.84 | 5.61 | 59.6% | 5.61 |
| 15 | ARI | 604 | 3477 | 5.76 | 396 | 1990 | 5.03 | 5.47 | 60.4% | 5.46 |
| 16 | DET | 614 | 3900 | 6.35 | 407 | 1649 | 4.05 | 5.43 | 60.1% | 5.43 |
| 17 | GNB | 609 | 3733 | 6.13 | 411 | 1795 | 4.37 | 5.42 | 59.7% | 5.42 |
| 18 | ATL | 734 | 4714 | 6.42 | 362 | 1361 | 3.76 | 5.54 | 67% | 5.36 |
| 19 | JAX | 631 | 3760 | 5.96 | 389 | 1708 | 4.39 | 5.36 | 61.9% | 5.33 |
| 20 | NYG | 650 | 3731 | 5.74 | 362 | 1685 | 4.65 | 5.35 | 64.2% | 5.31 |
| 21 | BUF | 553 | 3229 | 5.84 | 465 | 2054 | 4.42 | 5.19 | 54.3% | 5.27 |
| 22 | PHI | 650 | 3833 | 5.90 | 454 | 1939 | 4.27 | 5.23 | 58.9% | 5.25 |
| 23 | IND | 545 | 3108 | 5.70 | 471 | 2130 | 4.52 | 5.16 | 53.6% | 5.23 |
| 24 | NWE | 648 | 3961 | 6.11 | 447 | 1703 | 3.81 | 5.17 | 59.2% | 5.19 |
| 25 | DEN | 545 | 3115 | 5.72 | 409 | 1662 | 4.06 | 5.01 | 57.1% | 5.05 |
| 26 | CAR | 691 | 3650 | 5.28 | 386 | 1819 | 4.71 | 5.08 | 64.2% | 5.05 |
| 27 | WAS | 529 | 2812 | 5.32 | 356 | 1583 | 4.45 | 4.97 | 59.8% | 4.97 |
| 28 | CIN | 664 | 3652 | 5.50 | 385 | 1517 | 3.94 | 4.93 | 63.3% | 4.88 |
| 29 | PIT | 542 | 2981 | 5.50 | 395 | 1447 | 3.66 | 4.73 | 57.8% | 4.77 |
| 30 | MIA | 673 | 3804 | 5.65 | 349 | 1156 | 3.31 | 4.85 | 65.9% | 4.72 |
| 31 | CHI | 625 | 3291 | 5.27 | 395 | 1458 | 3.69 | 4.66 | 61.3% | 4.64 |
| 32 | NYJ | 573 | 3111 | 5.43 | 383 | 1257 | 3.28 | 4.57 | 59.9% | 4.57 |
We can also perform the same analysis on defense. San Francisco had the 2nd best defense by this measure, allowing just 4.66 Adjusted Yards per Play. Kansas City ranked 13th. And for you Simpson’s Paradox fans, the Chargers provide an example here, too. Los Angeles had a slightly worse pass defense and a slightly worse rush defense than Philadelphia, but allowed fewer yards per play than the Eagles! That’s because the Chargers didn’t face many passing plays, while the Eagles faced a lot of them.
| Rk | Tm | Pass Plays | Pass Yards | NY/A | Att | Yds | YPC | Y/P | Pass Ratio | Adj Y/P |
|---|---|---|---|---|---|---|---|---|---|---|
| 1 | NWE | 583 | 2886 | 4.95 | 365 | 1528 | 4.19 | 4.66 | 61.5% | 4.64 |
| 2 | SFO | 567 | 2707 | 4.77 | 401 | 1802 | 4.49 | 4.66 | 58.6% | 4.66 |
| 3 | PIT | 568 | 3113 | 5.48 | 462 | 1753 | 3.79 | 4.72 | 55.1% | 4.81 |
| 4 | BUF | 597 | 3123 | 5.23 | 388 | 1649 | 4.25 | 4.84 | 60.6% | 4.84 |
| 5 | TAM | 711 | 4322 | 6.08 | 362 | 1181 | 3.26 | 5.13 | 66.3% | 4.95 |
| 6 | NYJ | 620 | 3779 | 6.10 | 417 | 1391 | 3.34 | 4.99 | 59.8% | 4.99 |
| 7 | CHI | 603 | 3554 | 5.89 | 414 | 1632 | 3.94 | 5.10 | 59.3% | 5.11 |
| 8 | DAL | 608 | 3576 | 5.88 | 407 | 1656 | 4.07 | 5.15 | 59.9% | 5.16 |
| 9 | MIN | 649 | 3737 | 5.76 | 404 | 1728 | 4.28 | 5.19 | 61.6% | 5.17 |
| 10 | BAL | 581 | 3315 | 5.71 | 340 | 1494 | 4.39 | 5.22 | 63.1% | 5.18 |
| 11 | LAR | 612 | 3625 | 5.92 | 444 | 1809 | 4.07 | 5.15 | 58% | 5.18 |
| 12 | NOR | 654 | 3868 | 5.91 | 345 | 1461 | 4.23 | 5.33 | 65.5% | 5.24 |
| 13 | KAN | 627 | 3543 | 5.65 | 416 | 2051 | 4.93 | 5.36 | 60.1% | 5.36 |
| 14 | PHI | 614 | 3865 | 6.29 | 353 | 1442 | 4.08 | 5.49 | 63.5% | 5.41 |
| 15 | DEN | 577 | 3609 | 6.25 | 426 | 1783 | 4.19 | 5.38 | 57.5% | 5.43 |
| 16 | TEN | 641 | 4080 | 6.37 | 415 | 1672 | 4.03 | 5.45 | 60.7% | 5.43 |
| 17 | LAC | 494 | 3204 | 6.49 | 429 | 1805 | 4.21 | 5.43 | 53.5% | 5.57 |
| 18 | IND | 603 | 3982 | 6.60 | 383 | 1567 | 4.09 | 5.63 | 61.2% | 5.60 |
| 19 | GNB | 587 | 3721 | 6.34 | 411 | 1921 | 4.67 | 5.65 | 58.8% | 5.67 |
| 20 | CAR | 597 | 3696 | 6.19 | 445 | 2296 | 5.16 | 5.75 | 57.3% | 5.78 |
| 21 | CLE | 551 | 3470 | 6.30 | 463 | 2315 | 5.00 | 5.71 | 54.3% | 5.78 |
| 22 | WAS | 586 | 3823 | 6.52 | 493 | 2339 | 4.74 | 5.71 | 54.3% | 5.81 |
| 23 | NYG | 592 | 4225 | 7.14 | 469 | 1812 | 3.86 | 5.69 | 55.8% | 5.83 |
| 24 | ATL | 564 | 3918 | 6.95 | 421 | 1775 | 4.22 | 5.78 | 57.3% | 5.85 |
| 25 | DET | 639 | 4551 | 7.12 | 455 | 1855 | 4.08 | 5.86 | 58.4% | 5.90 |
| 26 | OAK | 558 | 4107 | 7.36 | 405 | 1570 | 3.88 | 5.90 | 57.9% | 5.97 |
| 27 | ARI | 641 | 4510 | 7.04 | 439 | 1922 | 4.38 | 5.96 | 59.4% | 5.97 |
| 28 | SEA | 626 | 4223 | 6.75 | 388 | 1883 | 4.85 | 6.02 | 61.7% | 5.99 |
| 29 | JAX | 564 | 3778 | 6.70 | 435 | 2229 | 5.12 | 6.01 | 56.5% | 6.07 |
| 30 | HOU | 617 | 4276 | 6.93 | 403 | 1937 | 4.81 | 6.09 | 60.5% | 6.08 |
| 31 | MIA | 568 | 4198 | 7.39 | 485 | 2166 | 4.47 | 6.04 | 53.9% | 6.22 |
| 32 | CIN | 530 | 3917 | 7.39 | 504 | 2382 | 4.73 | 6.09 | 51.3% | 6.32 |
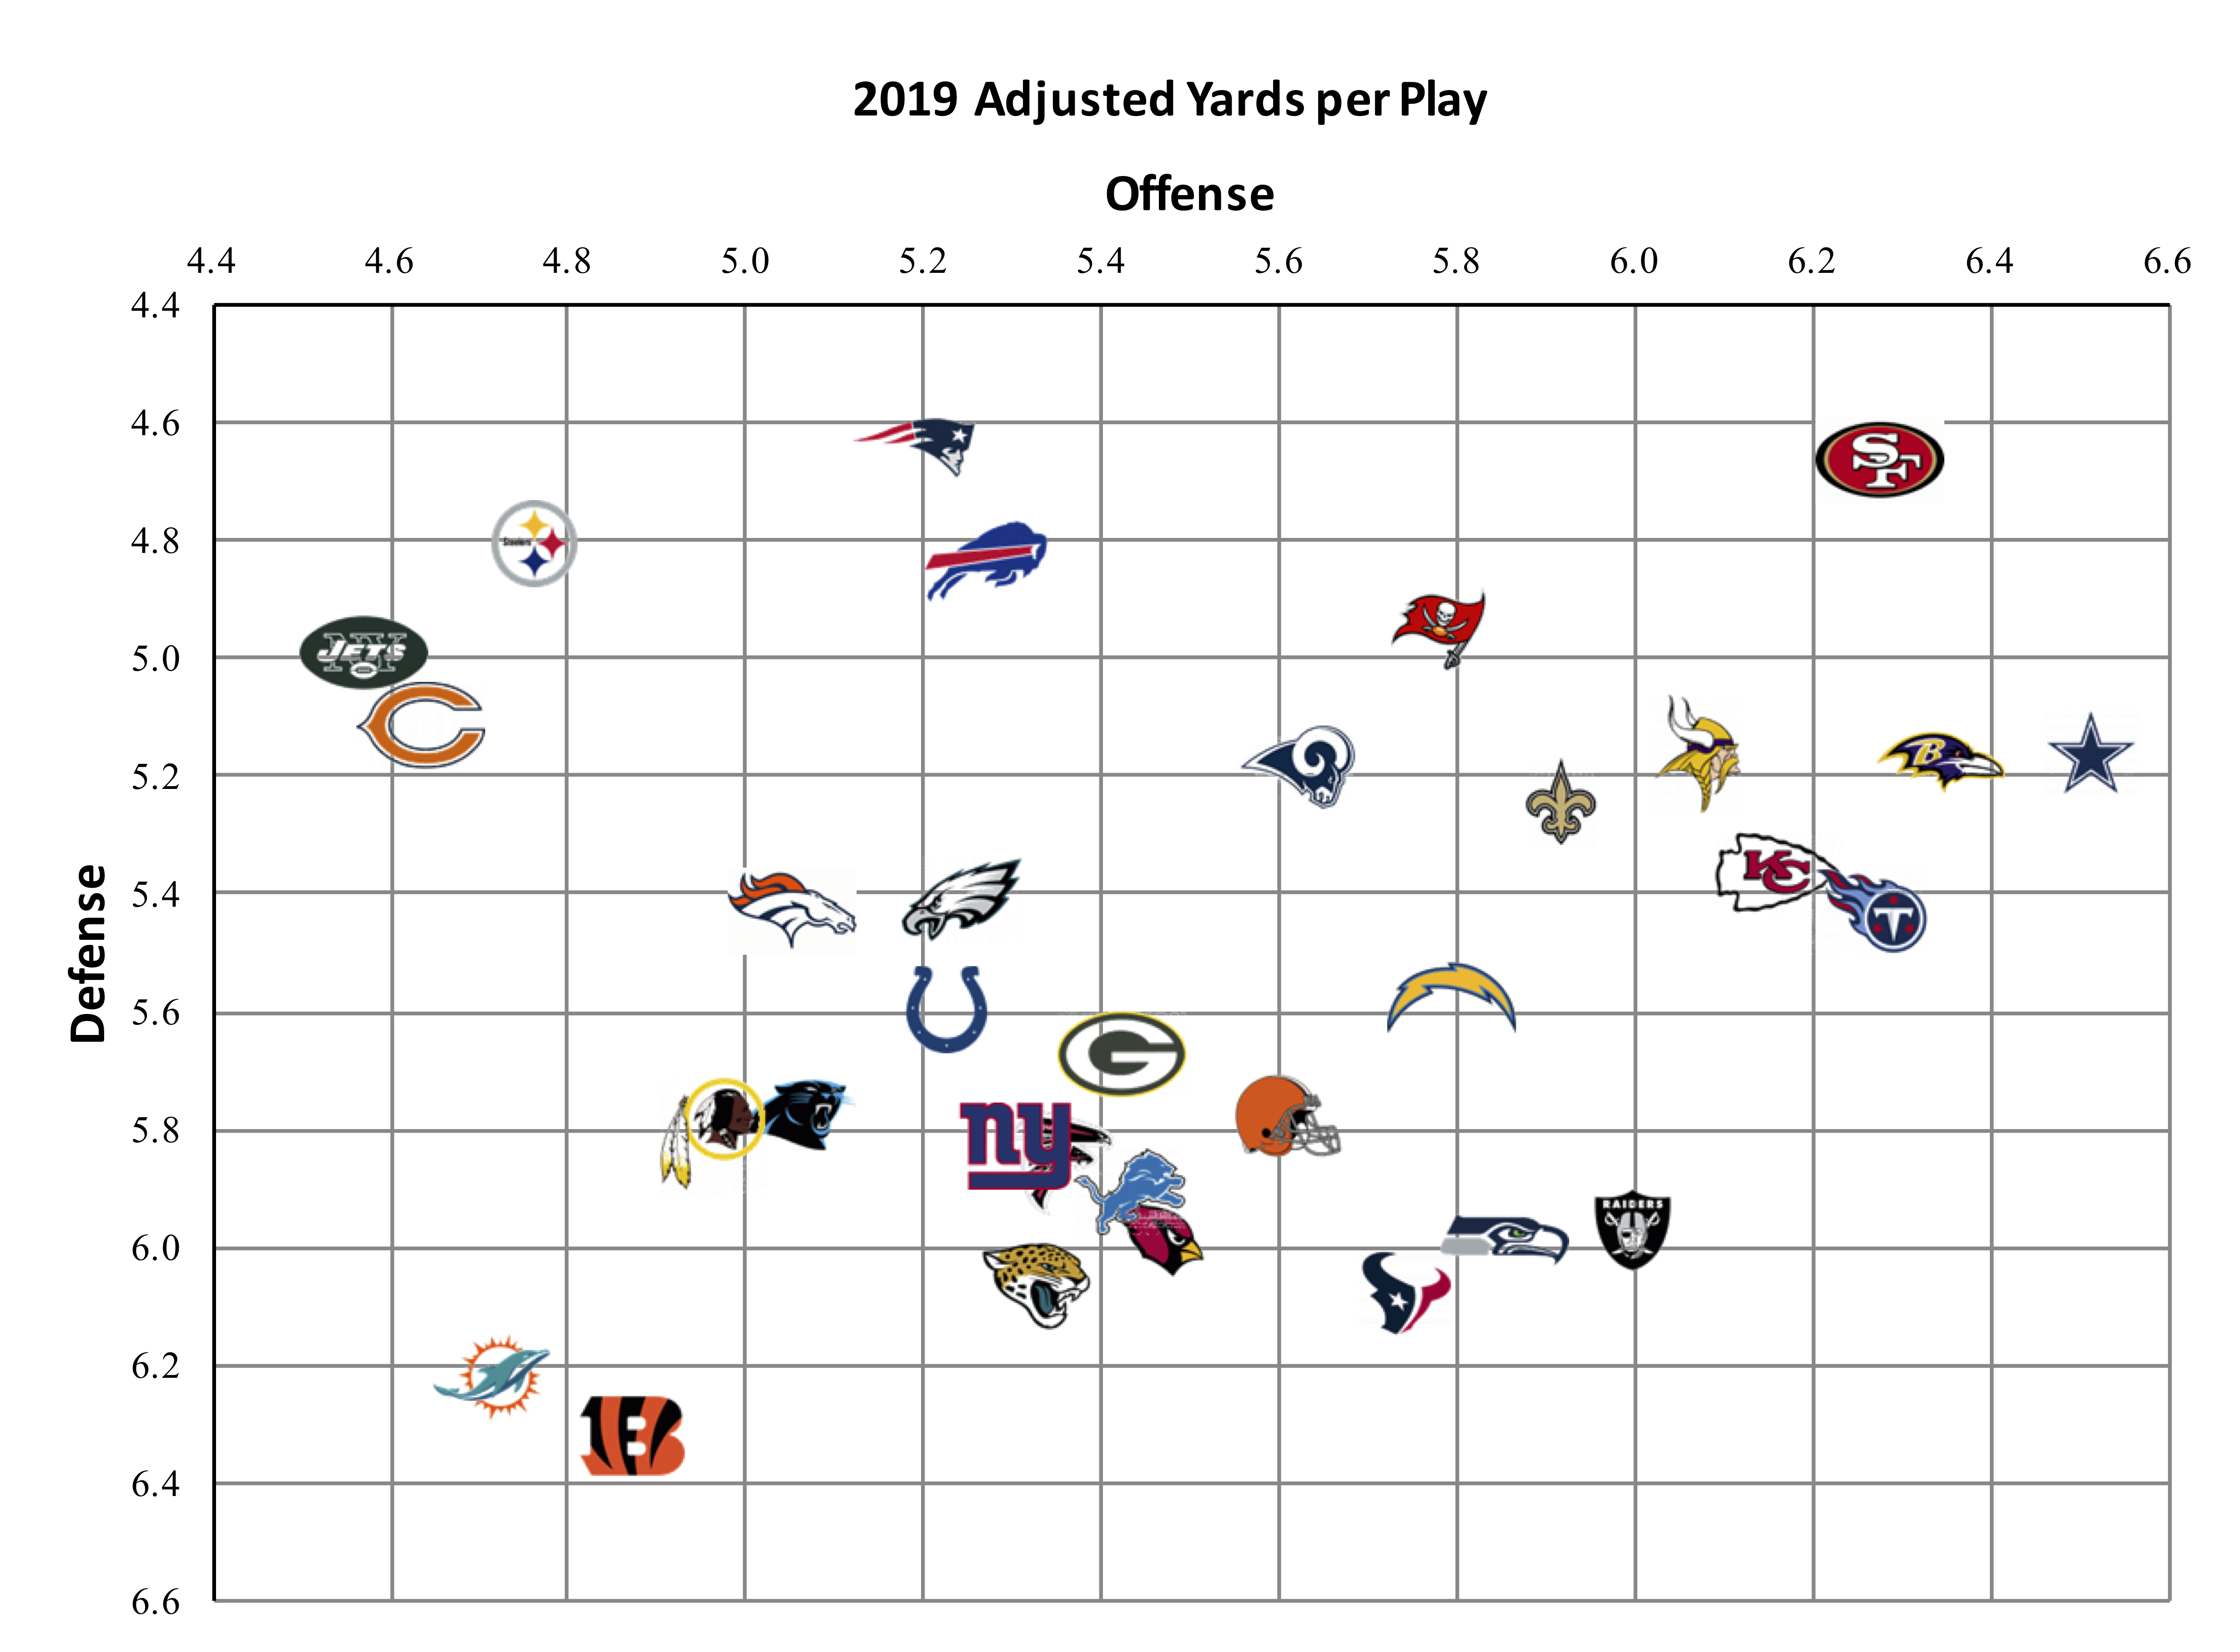
Now that we have each team’s offensive and defensive grade, let’s put them on a graph. To make “up and to the right” the best quadrant, I have plotted the defensive grades in reverse order. Offensive Adjusted Yards per Play is on the X-Axis, and Defensive Adjusted Yards per Play is on the Y-Axis.
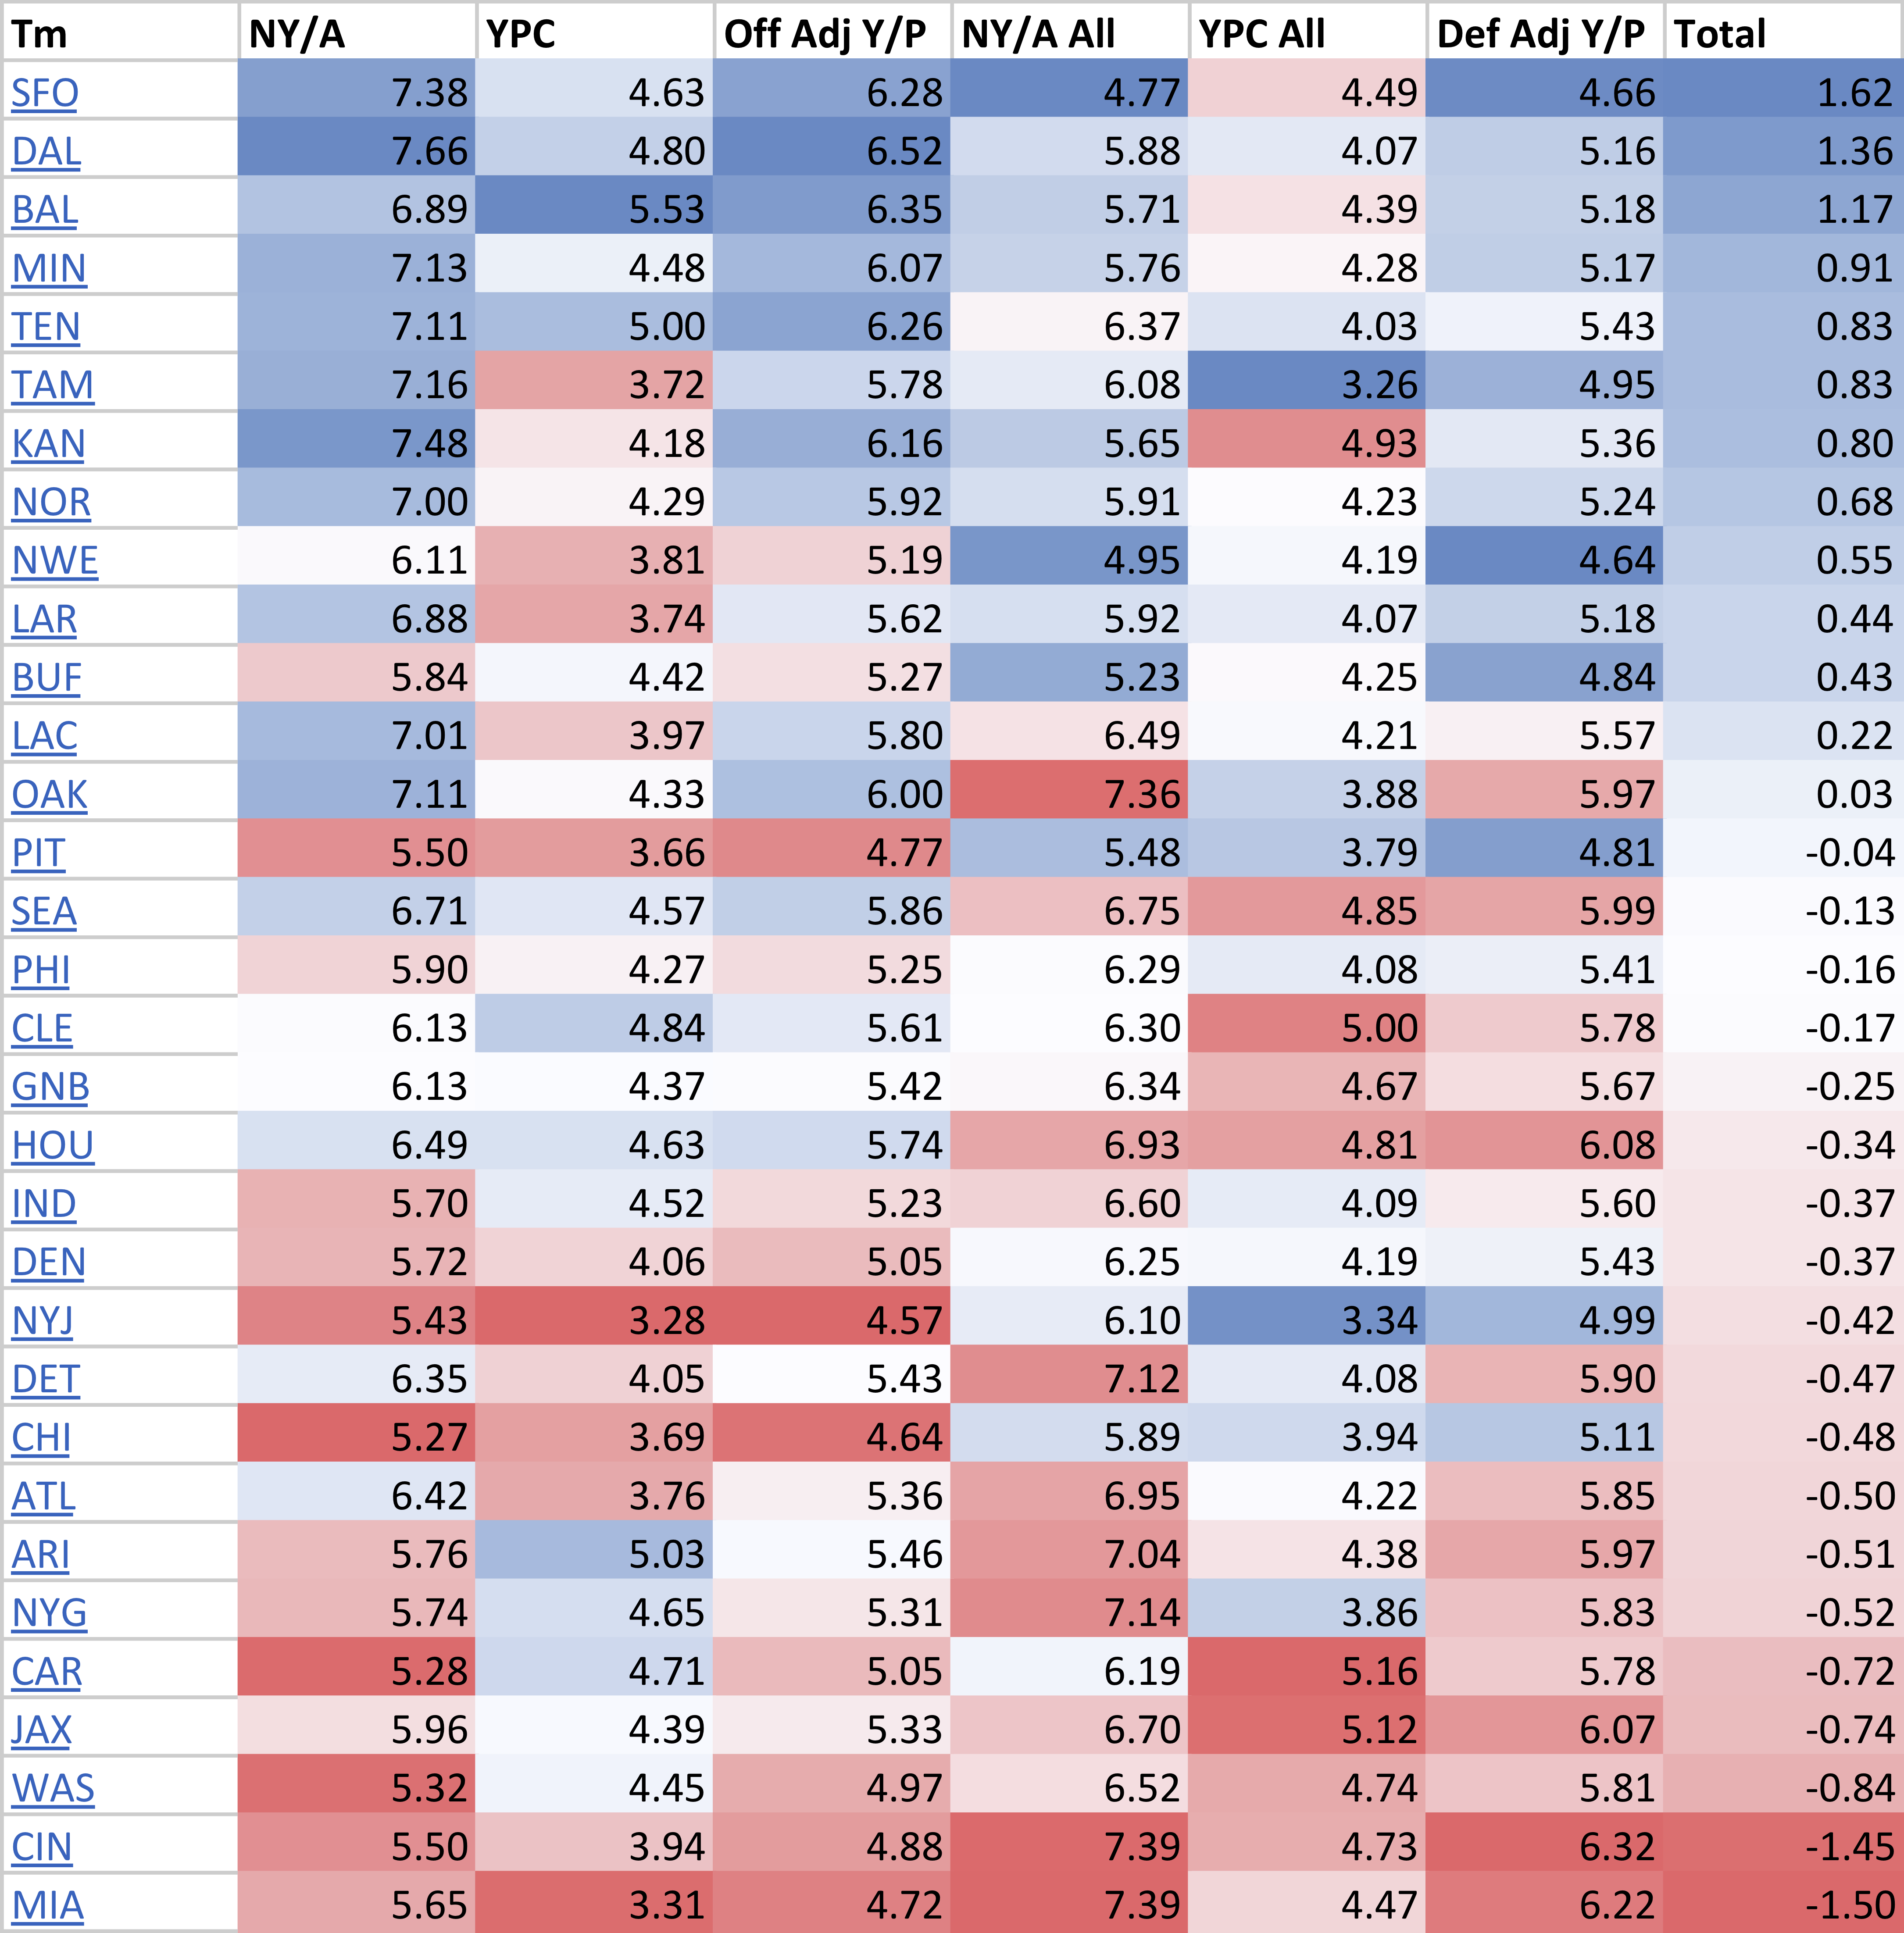
And if you just prefer the numbers in one place, here’s one last graph. This can be thought of as a team rating: it is sorted by each team’s Offensive Adj Y/P average minus its Defensive Adj Y/P average. The 49ers stand out as the best team in the NFL.
What do you think?