≡ Menu

Brees is probably not about to throw an incomplete pass or take a sack.

In 1996 and 1997, Steve Young led the NFL in completion percentage each year. But in ’96, Young took a sack on 1 out of every 10 dropbacks and ranked 30th in the NFL in sack rate; in ’97, he had a 9.0% sack rate, which ranked 25th among qualifying passers.

In 1984, Steve Bartkowski ranked 1st in completion percentage but 28th in sack rate (12.9%!).

In 1991,Dave Krieg ranked 29th in sack rate when he led the NFL in completion percentage.

More often than you think, players trade low-probability passes for sacks, and vice-versa. Last year, when Brees led the NFL in completion percentage, the next 6 players in that metric — Kirk Cousins, Carson Wentz, Matt Ryan, Derek Carr, Marcus Mariota, and Deshaun Watson — all ranked outside of the top 15 in sack rate. (And to be clear, a low sack rate gives you a high ranking, just like interception rate, since sacks are a bad thing.) The last player to lead the league in completion percentage that wasn’t Brees was Sam Bradford in 2016; that year, he ranked 21st in sack rate. It recalled David Carr leading the NFL in completion percentage in 2006 when he ranked 26th in sack rate.

To have an excellent sack rate, you need to throw the ball quickly no matter what, even if nobody is open; that carries with it a high risk of lowering your completion percentage. Which makes it really impressive when a player ranks well in both categories. (And if you want to create a statistic that includes sacks in the denominator when calculating completion percentage, I approve!)

Brees is going to lead the NFL in completion percentage in 2019. With one week left in the season, Brees has a 4% lead on the rest of the NFL. The only interesting question is whether Brees will set yet another single-season record; right now, he is at 75.3%, and the current record is 74.4%, set by Brees last year.  He’s got a good chance to do it: even if he went 21-of-32 today (which is worse than he’s done in 8 of 9 games this year), he would still beat last year’s mark. [continue reading…]

{ 0 comments }

Previous Passing Stats:

It finally happened: last night, Drew Brees threw 4 touchdown passes, to pass Peyton Manning and to move into first place on the all-time passing touchdowns list. A few years ago, Bryan Frye detailed the history of the passing TD crown, from Benny Friedman to Manning.  Manning held the record for a little over 5 years, while Brees may not hold the record for very long at all if Tom Brady gets his way.  The shortest reign belongs to Bobby Layne, who held it for just over a year.

Oh, and Brees also set a record for the best completion in NFL history by a quarterback with more than 10 passes (trivia note: Kurt Warner holds the record, at 10, for most passes in a game without an incompletion).  Brees completed 29 of 30 passes, and he did that without taking a sack, either (Warner took two in his 10/10 game).  In the list of games with just one incompletion, everyone with more than 18 pass attempts had at least four sacks.  To complete 29 passes on 30 dropbacks is remarkable.  Only Steve Young (here)  and Warner (here) have had a game with 20+ attempts and less than three combined sacks and incomplete passes.

The table below shows the week 15 passing stats. The top passers of the week were Jameis Winston, Drew Brees, Lamar Jackson, and Russell Wilson, which is hardly surprising… but Dwayne Haskins also cracked the top group, along with Dak Prescott and Patrick Mahomes. The full week 15 passing stats below. [continue reading…]

{ 0 comments }

Drew Brees Has The Most Touchdowns In NFL History

Drew Brees had yet another remarkable game today. The 40-year-old threw five touchdown passes and rushed for another on a sneak from the 1-yard line. The future Hall of Famer has now thrown 537 touchdowns in his regular season career, rushed for another 23, and even caught one (from LaDainian Tomlinson back in 2003).

That gives Brees 561 career touchdowns, the most in regular season history.

Most career total touchdowns:

1. 561 – Brees (537 passing, 23 rushing, 1 receiving)
2. 558 – Tom Brady (536 passing, 22 rushing)
3. 557 – Peyton Manning (539 passing, 18 rushing)

Back in the 2018 offseason, I wrote that Brady and Brees were in a close race to dethrone Manning as the all-time career passing touchdowns king. Both players finished the 2015 season tied with 428 career touchdown passes. They finished the 2017 season tied again with 488 career touchdown passes. And after week 14 of the 2019 season, Brees is up on Brady 537-536. Brees is about year and a half younger than Brady, and is playing better this season; the odds are Brees will be the one who ultimately retires as the all-time passing touchdowns king. But it’s still a toss-up as to who breaks Manning’s record first, even if today Brees set a similar record that almost nobody noticed.

Coming up next: Brees and the Saints host the Colts on Monday Night Football in week 15, and Brees will be a strong favorite to throw passing touchdowns 539 and 540 in that game.  A home game on primetime? Yes, Brees will be gunning for the record books. That said, the Patriots face the Bengals the day before, and I wouldn’t put it past Brady to throw 4 touchdowns in that game, too, being the first to break the record.  This may turn into a McGwire/Sosa race after all.

{ 0 comments }

I calculated the Adjusted Net Yards per Attempt averages for every quarterback for every season in NFL history. I then calculated each quarterback’s Relative ANY/A, which is their ANY/A relative to league average. I wanted to then plot the big four quarterbacks of this era — Peyton Manning, Tom Brady, Drew Brees, and Aaron Rodgers — to see how they fared (after excluding seasons where the quarterback didn’t have enough pass attempts to qualify for the passing crown). I’ll leave the commentary to you guys, and I’ll just present the data in three different graphs.

First, let’s do it by chronological year. This means Manning’s graph starts early but ends, while Rodgers doesn’t get started until 2008. I have used blue/white for Manning, red/blue for Brady, gold/black for Brees, and green/gold for Rodgers.

[continue reading…]

{ 1 comment }

Rivers, Brees, and The Elusive Quest For An MVP Award

Drew Brees and Philip Rivers are two of the best quarterbacks of the last dozen years. Brees joined the Saints in 2006, paving the way for Rivers to become the Chargers starting quarterback that season. Since then, they are the only two players who threw for 50,000 yards from 2006 to 2017, and they  have been just a hair behind Tom Brady, Aaron Rodgers, and Peyton Manning in terms of efficiency.

But despite over a decade of great play, neither Brees nor Rivers have won the AP MVP award. The main reason? The triumvirate of Manning, Brady, and Rodgers have won 8 of the 12 AP MVP awards from ’06 to ’17. In the other years, the award went to Matt Ryan in 2016, Cam Newton in 2015, and running backs Adrian Peterson in 2012 and LaDainian Tomlinson in 2006.  In 2012, if Peterson didn’t win the award, Manning would have won it (Peterson beat Manning 30.5 votes to 19.5 votes, and Manning lapped the field for the AP All-Pro QB vote), so neither Brees not Rivers were denied that season.

But in 2006, it probably would have gone to Brees, it not for the historic year that Tomlinson had.  Brees was the AP first-team All-Pro choice at QB, largely because of how he transformed the Saints offense from one of the worst to one of the best in a single offseason.  Tomlinson ran away with the vote, capturing 44 of 50 votes, but Brees was the runner-up with 4 votes to Manning’s two.  That said, I’m not sure I feel particularly bad for Brees on this point: advanced statistics point to Manning as having been the best quarterback that year, and by a decent margin.  The ’06 Colts were historically great at picking up first downs, Manning led in ANY/A, and Manning lapped the field in Total QBR.  Brees would have won the award based on factors other than pure merit, had it not been for Tomlinson’s performance.

Still, it’s hard not to feel bad for these teammates on the ’04 and ’05 Chargers.  For the last 12 years, Brees and Rivers have been behind Manning/Brady/Rodgers in 10 of 12 years, and also behind historically great single seasons from Brees’s NFC South rivals.   I went ahead and calculated how many Adjusted Net Yards each quarterback has provided, relative to league average, for each season since 2006.  The formula is simple.  In 2009, for example, Brees averaged 8.31 ANY/A (Adjusted Net Yards/Attempt, of course, is yards per attempt, with a 45-yard penalty for interceptions, deductions for sacks, and a 20-yard bonus for touchdown passes) and Rivers averaged 8.30 ANY/A, while the league average that season was 5.65.  Brees had 534 dropbacks, so he is credited with 1,422 Adjusted Net Yards of value added over average (8.31 – 5.65, multiplied by 534).  Rivers had 511 dropbacks, so he is credited with 1,356 ANY of value added over average.

In both 2008 and 2009, Brees and Rivers ranked 1st and 2nd in value added over average.  In ’08, both the Saints and Chargers finished 8-8; Manning, who led the NFL with 6 game-winning drives, won the AP MVP on the 12-4 Colts.  In ’09, Manning’s Colts began the year 14-0 before shutting things down for the season; Manning was always a shoe-in for that award, thanks to a whopping 7 fourth quarter comebacks in those 14 games; no other quarterback had more than 3 that season.  But in terms of ANY/A (and Value), Rivers and Brees were better choices than Manning both years.

In addition, Brees had three seasons where he ranked 2nd in value (’06, ’11, ’17) and two more where he ranked 3rd (’12, ’13). Rivers had a third 2nd-place finish in value in 2010 (behind MVP Brady), and also had a 3rd (2017), 4th (2013), and 5th (2006) place finish.

This year, both players are having remarkable seasons, but Rivers ranks 3rd in Value and Brees ranks 6th in Value. Yes, it looks like Patrick Mahomes or Jared Goff or even Todd Gurley could be what stops Brees and Rivers from that elusive first AP MVP Award.

The graph below shows Brees, Rivers, and the leader in Adjusted Net Yards over average for each year since 2006. The NFL leader is in red; Rivers is in Chargers colors, and Brees is in Saints colors.  Both Rivers and Brees have had a lot of great seasons, but seasons that fall just shy of MVP-level  great.

Rivers and Brees both were victims of Manning in ’08 and ’09, but the biggest snake eyes either of them rolled was in 2011. That year, Rodgers had his best season and was historically great — the only better seasons since ’06, by value, were Manning ’13 and Brady ’07. But Brees 2011 was also great — in fact, it’s the 5th-best season since ’06, with Ryan ’16 being the only other season ahead of him. It just so happens that Brees picked a bad time to have a career season.

{ 0 comments }

Brad Oremland is a longtime commenter and a fellow football historian. Brad is also a senior NFL writer at Sports Central. There are few who have given as much thought to the history of quarterbacks and quarterback ranking systems as Brad has over the years. What follows is Brad’s latest work on quarterback statistical production.


Brees threw a lot in garbage time

What I thought was an off-hand musing about Drew Brees’ production in low-leverage situations (for my ongoing series about the greatest statistical QBs in history) sparked a surprisingly contentious debate about whether Brees had padded his stats in garbage time.

I tried to align this with a very conservative definition of “garbage time” … all data are from 2004-17 — 2004 was Brees’ first good season — and none of the game/score situations below produced any wins by any team during those years. “P/B/R” indicates the combined total of Peyton Manning, Tom Brady, and Aaron Rodgers.

Please pardon the informal prose and formatting; this was originally composed as a comment, not an article. [continue reading…]

{ 1 comment }

Will Drew Brees Pull A Sammy Sosa In 2019?

If you were a baseball fan and alive in 1961, you probably remember where you were when Roger Maris broke Babe Ruth’s single-season home run record with his 61st home run of the season.

One of the most memorable sports moments of the ’90s was on September 8th, 1998, when Mark McGwire his hit 62nd home run of the season, breaking Maris’s record.

And there was no shortage of fan fare when Barry Bonds broke McGwire’s record, hitting his 71st home run of the season on October 6th, 2001.

But Ruth, Maris, McGwire, and Bonds aren’t the only players in the last century to hold the single-season home run record.  Because Sammy Sosa was once held the record for most home runs in a season, and he did it without any fanfare at all.  That’s because it happened on September 25th, 1998 in a game between the Cubs and Astros.. Sosa hit his 66th home run of the season that night, breaking McGwire’s record of 65 home runs. Of course, there were still a few games left, and McGwire had just broken the record with his 62nd home run… and his 63rd, and his 64th, and his 65th home runs. And 45 minutes later, in a Cardinals/Expos game, McGwire hit hit 65th home run of the season, and Sosa would never again stand alone as the single-season record holder but for those 45 minutes.

So why the baseball detour today? Because Tom Brady and Drew Brees may re-create the McGwire/Sosa race in a couple of years.  Two years ago, I noted that both Brady and Brees finished the 2015 season tied with 428 career touchdown passes. Now, both players are tied again with 488 career touchdown passes! So who will finish as the career record-holder?

Right now, Peyton Manning is the passing touchdown king with 539 touchdowns, so Brees and Brady need 52 more touchdown passes to set the mark. Brees will pass Manning as the all-time leader in career passing yards with his 1,496th passing yard of the 2018 season, but it is very unlikely that Brees or Brady challenges Manning’s touchdown mark until 2019.

So how did we get here? The graph below shows how many career touchdowns Brady (in dark blue) and Brees (in gold) had after each week of each season since 2001, the year they both threw their first touchdown pass. [continue reading…]

{ 0 comments }

Drew Brees Loses Another Playoff Game Drew Brees Style

In his first playoff game, Drew Brees threw a game-tying touchdown pass to Antonio Gates with 11 seconds remaining to force overtime against the Jets. In overtime, Brees and the Chargers drove 48 yards down the field, and converted two third downs, to set up a game-winning 40-yard field goal. Unfortunately for Brees, Nate Kaeding missed the kick, and the Jets won in overtime.

In his second playoff game, Brees had an efficient performance in a win over the Eagles. The next week, New Orleans faced an excellent Bears team in frigid conditions in Chicago. Brees’ teammates lost two fumbles, rushed for a total of 48 yards, and allowed 37 points in an NFCCG loss.

Brees’ next three playoff games were all in 2009, when he threw 8 touchdowns and no interceptions as the Saints won the Super Bowl.

His next playoff game? That was the BeastQuake game when Marshawn Lynch rumbled for a 67-yard touchdown in the 4th quarter. The Saints lost 41-36, despite Brees throwing for 404 yards and 2 touchdowns with no interceptions.  This would not be the last time Brees would lose a game despite his team scoring over 30 points.

The next playoff game of his career was his best, at least statistically.  Even with era and defensive adjustments, it ranked as one of the 10 best passing games in postseason history: He threw for 466 yards and 3 TDs on 43 attempts in a 45-28 win over the Lions.

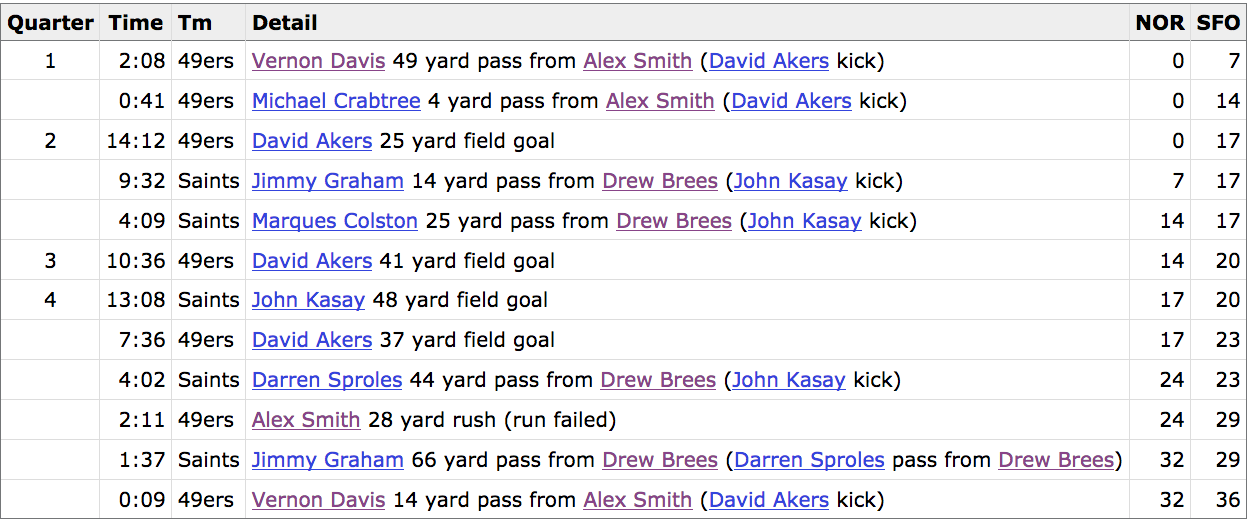
The next week Brees lost in one of the classic games in modern postseason history. Take a look at the boxscore:

This was the first game in playoff history with four lead changes in the final five minutes. Brees had a monster game against a great 49ers pass defense, and gave his team the lead in the final two minutes. Alas, that was not enough. This would not be the last time that would happen, either.

Two years later, Brees and the Saints won in Philadelphia as underdogs. This was, statistically, the worst playoff game of his postseason career. On the other hand, he and the Saints were a dome team playing a night game in Philadelphia in freezing conditions, and after a rough first half, the Saints scored two touchdowns and two field goals in five second half possessions. On the final drive, he picked up two first downs to set up the game-winning field goal.

The next week wasn’t good: he was 24/43 for 309 yards and 1 TD which oh wait it was against the 2013 Seahawks. In Seattle. So yeah, that was a pretty good game in a losing effort.

That brings us to 2017. In the first round of the playoffs, Brees went 23/33 for 376 yards and 1 TDs in a 31-26 win over Carolina. And then yesterday against the Vikings? After a miserable first half, Brees and the Saints scored three touchdowns on the team’s first four drives of the second half. The final touchdown put New Orleans ahead by 1 point with 2:20 to go.

Minnesota answered with a 9-play, 40-yard drive that culminated with a 53-yard field goal. New Orleans got the ball back, down 2 with 89 seconds left and one timeout, and drove 50 yards for the field goal. The Saints took a 24-23 lead with 25 seconds remaining.

With 10 seconds remaining, the Vikings had the ball at their own 39 yard line with no timeouts left. And then this happened:

Well, this happened:

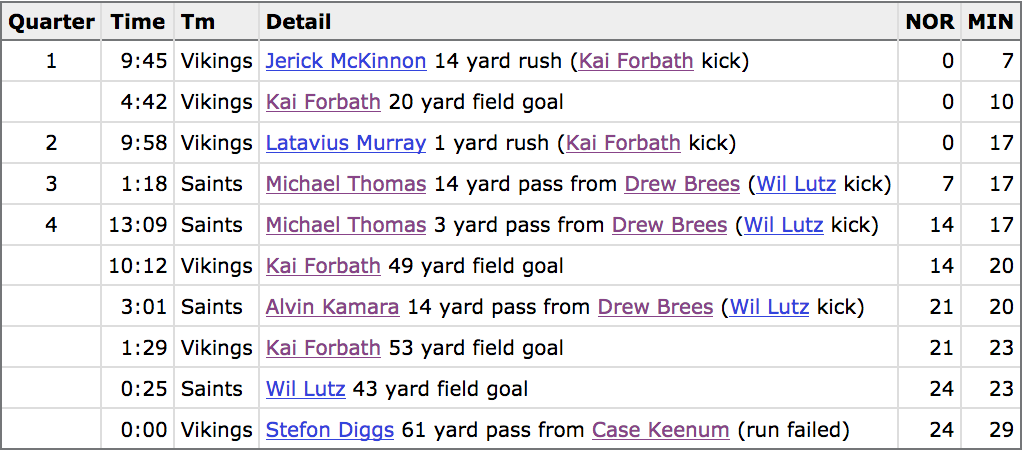
One of the greatest plays in playoff history. An instant classic. And yet, once again, Brees was left holding the short straw. Does this boxscore look familiar?

There have been two games in NFL postseason history with four lead changes [1]I am excluding ties, but if you include them, only one other game gets in there. in the final five minutes. And Brees was on the losing end in both of them.

As a reminder, in 13 playoff games:

  • The other team has scored 28+ points 6 times, and Brees is 2-4 in those games This includes the only two games in playoff history with four lead changes in the final five minutes and the BeastQuake game where the Saints scored 36 points.
  • Brees’ teams are 5-2 when the opponent scores under 28 points. The two losses include a game against one of the best pass defenses in NFL history and a game where his kicker missed a 40-yard field goal in overtime.
  • The average score of a Drew Brees playoff game is 28.8 to 26.8. While with the Saints, that jumps to 29.8 to 27.4.

In the last 10 postseasons, there have been 27 games with at least 56 points combined (i.e., an average of 28 points per team). Brees’s Saints have been involved in six of those 27 games. Keep in mind that there have been 214 playoff games over that stretch, and New Orleans has only been in 10 of them.

That means 60% of all Drew Brees playoff games see 56+ points scored, compared to 10% of all other games.

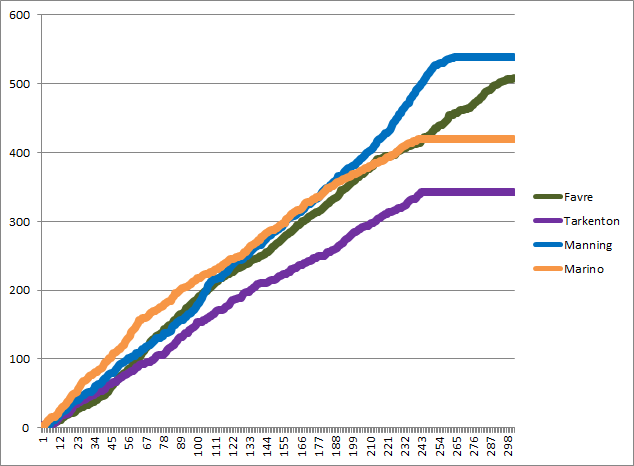
Brees is one of just four quarterbacks with a career passer rating in the playoffs over 100 and has averaged 324 passing yards per game in the playoffs, easily the most of all time. His stat line — 354/537, 4,209 yards, 29 TDs, 9 INTs, 100.7 passer rating, 22 sacks — looks like that of an MVP candidate, especially when you consider that’s in only 13 games. Pro-rated to 16 games, and it’s 5,180 yards with 36 TDs and 11 INTs on 661 attempts. Those are nearly identical to the numbers he put up in an MVP caliber 2013 season.

In other words, Drew Brees in the playoffs plays like the best version of Drew Brees in the regular season, which is pretty darn incredible. But what’s even more incredible is the string of events that have left him with just a 7-6 record. For that 7-6 record, he can thank Kaeding, Lynch, Vernon Davis, Stefon Diggs, and going up against two of the best defenses of the last 15 years.

References

References
1 I am excluding ties, but if you include them, only one other game gets in there.
{ 116 comments }

In 5 years, one of Tom Brady, Peyton Manning, and Drew Brees will be the all-time leader in passing touchdowns. Currently, Manning is the passing touchdown king with 539 touchdowns, but will Brees or Brady catch him?

A year ago, I wrote about the fascinating touchdown race between Brady and Brees: at the end of the 2015 season, both had thrown 428 career touchdown passes. Last year, Brees threw 37 while Brady threw 28 in 12 games, so Brees is currently up 9 on Brady, 465-456.

But when I measured Brees and Brady last year, I measured them by calendar year. Both threw their first touchdown pass in 2001, so I thought a calendar year-by-year chart would be cool. But it probably makes more sense to compare the passers year-by-year by age, as I did yesterday with Brees and Manning for passing yards. That’s because Brees is about a year and a half younger than Brady (in turn, Brady is about a year and a third younger than Manning, but we haven’t compared them by calendar year).

So if we plot their passing touchdowns by age, Brees appears to have a huge leg up on Brady. That is, unless Brady plays until he’s 45: [continue reading…]

{ 107 comments }

Drew Brees didn’t get much of a headstart on his way to becoming the NFL’s all-time leader in passing yards. As you know, Peyton Manning is the current leader in that category, having retired with 71,940 passing yards.  Manning and Brees both entered the NFL at the age of 22, but Manning started 16 games as a rookie, while Brees played in just one game.  Young Manning was also a bit better than young Brees: that fact, combined with Manning’s 3,518-yard edge as rookies, and Brees missing 5 games at the age of 24 gave Manning a huge early lead.

Thru ages 26, 27, and 28, Manning had a lead of over 8,000 yards on Brees.  But beginning at age 29, Brees started to fight back.  Through age 34, Manning’s lead had dwindled to 3,747 passing yards, though they remain the only two players with over 50,000 passing yards through age 34.  Manning would miss all of his age 35 season with his neck injury, which allowed Brees to finally pass him and become the career leader in passing yards through age 35.

Since then? Well, Brees continues to match Manning, even putting up his own 5,000-yard season at age 37, which is what Brees was in 2016.  For Manning, age 37 was his last great season, age 38 was his last good season, and age 39 was his final year, where he threw for just 2,249 yards.  In other words, if Brees has made it this far, the tough stuff is done: exceeding Manning’s production through age 37 was the hard part.

The graph below shows each player’s career passing yards through X. It’s color-coded by team, showing Brees’ time with the Chargers and Saints, and Manning’s with the Colts and Broncos.  As you can see, Brees has had the edge on Manning over the last three seasons: [continue reading…]

{ 19 comments }

Drew Brees and Spreading It Around

In 2016, Odell Beckham gained 34% of all Giants receiving yards, the highest share in the NFL. For 31 of 32 teams, at least one player gained 20% of their team’s receiving yards, but for the Bills, Robert Woods led the team in receiving despite being responsible for only 19% of Buffalo’s receiving yards.

But since Drew Brees came to the Saints in 2006, no team has spread it around more than New Orleans. On average, Brees’ leading receiving has been responsible for only 22% of the Saints receiving yards each year. The table below shows the average percentage of team receiving yards gained by the top receiver (RB, WR, or TE) for each team in each season over the last 11 years. The Falcons, buoyed by long runs of success by Roddy White and then Julio Jones, have been the most WR1-heavy passing game, while the Saints have been the most diverse: [continue reading…]

{ 14 comments }

Saints wide receiver Michael Thomas is in about as good a situation as it gets. Here’s what he has in his favor:

  • The Saints pass the ball a ton. The last three years, New Orleans ranked 2nd each season in pass attempts, finishing 2 attempts behind the Colts in 2014, 9 attempts behind the Ravens in 2015, and 5 attempts behind the Ravens last year. The Saints have an even 2,000 attempts over the last three seasons, the Ravens are 2nd with 1,909, and the Colts are 3rd with 1,864. It’s true that New Orleans did just add Adrian Peterson, but the Saints are well-established as the league’s preeminent pass-heavy team.
  • Thomas, unlike players on the Ravens, gets to play with a superstar quarterback in Drew Brees. Because more important than the 2,000 attempts is that New Orleans has thrown for 14,808 gross passing yards the last 3 years, more than 1,000 yards more than anyone else. Only the Falcons, Steelers, and Patriots have even 13,000 passing yards.
  • As a rookie, Thomas and Brandin Cooks were essentially WR1A and WR1B in New Orleans. Cooks had 117 targets, 1,173 receiving yards, and 8 TDs in 16 games, while Thomas had 121 targets, 1,137 yards, and 9 TDs despite missing one game. But here’s where it gets exciting for Thomas: Cooks was traded in the offseason, and will be replaced with 32-year-old Ted Ginn.

Is there a more favorable situation for a WR to produce massive stats? Unless you just think Thomas will be harmed by all the attention — and that’s where Peterson should help — this is basically as good as it gets. He’s on the league’s most pass-happy offense, with a top-3 quarterback, and he is likely going to get fed a significant amount of targets. As a rookie, Thomas was targeted on 18.2% of passes. That number is almost certainly going to rise this year. The most targets any Saint has had with Brees is 149, set by Jimmy Graham in 2011.

But there is one other thing that helped Thomas last year. The Saints threw 59% of their passes to wide receivers last year, a new high in the Brees era. That coincided with just 17% — a record low since 2008 — of passes going to tight ends. In 2006 and 2007, Reggie Bush was a target monster while Mark Campbell and Eric Johnson were the top tight ends. But beginning in ’08, the Saints had Jeremy Shockey and then Jimmy Graham and a breakout season from Ben Watson in 2015. Last year, Coby Fleener was the tight end, and he was underwhelming. Fleener had a lower catch rate than any Saints wide receiver last year, and that’s not exactly how its supposed to work.

In 2014, Siants receivers had 47% of targets, then 54% in 2015 and 59% last year. Meanwhile, TE targets dropped from 27% with Graham to 24% with Watson and then 17% with Fleener. Take a look: the graph below shows the percentage of targets in New Orleans by position since 2006: [continue reading…]

{ 7 comments }

There have been four passing touchdown kings in the last 40 years: Fran Tarkenton, Dan Marino, Brett Favre, and Peyton Manning.  I thought it would be fun to plot the number of career touchdown passes each player had on the Y-Axis after each game of their career (shown on the X-Axis):

td pass leaders
[continue reading…]

{ 7 comments }

Tom Brady and Drew Brees ended the 2015 season in a pretty remarkable place: both have 428 touchdown passes, tied for the third most in NFL history.  Both threw their first touchdown pass in 2001, which makes it easy — and fun! — to compare the two players.  The graph below shows the number of career touchdown passes for each player over every week since 2001:

brady brees td

Brady took an early edge, both because he started earlier (he had 18 touchdowns in 2001; Brees had 1) and played better earlier (Brees had 28 touchdowns in ’02 and ’03 combined; Brady had that many just in ’03).  And, of course, Brady’s scorched-earth 2007 season helped see him take his biggest lead.  Consider that through 2007, Brees had thrown fewer than 30 touchdown passes in each of his first seven seasons. Since then? Brees has thrown more than 30 touchdowns in all eight seasons! [continue reading…]

{ 7 comments }

Brees may not be throwing for awhile

Brees may not be throwing for awhile

Ian Rapoport is reporting that Drew Brees may miss several games with a shoulder injury. That’s tough news for all involved, including those who will now have to watch a bad Saints team led by Luke McCown (or Garrett Grayson). But it also could mark the end of a weird bit of trivia.

Believe it or not, Marques Colston and Brees have connected for 72 touchdowns, tied with Philip Rivers and Antonio Gates for the 5th most in NFL history by any receiver/quarterback combination. I’ve written about that streak before, but here’s something else unique to consider: Colston has never caught a touchdown pass from anyone other than Brees. [continue reading…]

{ 4 comments }

Division Preview: New Orleans at Seattle

Brees and Wilson scheming to get on an amusement park ride

Brees and Wilson scheming to get on an amusement park ride.

On the surface, this does not appear to be a very even matchup. In home games in 2013, Seattle outscored opponents by 15.4 points per game, an average that includes the loss to Arizona. In road games during the regular season, the Saints were outscored by 4.6 points per game. Both of those averages, of course, include Seattle’s 27-point demolition of the Saints in Seattle just six weeks ago. The 20-point difference between Seattle’s average home margin and the New Orleans’ average road margin — which, for brevity’s sake, I’m going to call the “projected MOV” — is very high, even by historical standards.  In fact, only 20 playoff games since 1950 featured a game with a larger projected MOV.

The table below shows the 50 playoff games with the largest projected MOV since 1950, measured from the perspective of the home team. For games since 1978, I’ve also shown the pre-game points spread. The largest projected MOV came in 1998, when the Vikings hosted the Cardinals in the playoffs. That year, Minnesota outscored teams by 23.6 points per game at home, while Arizona was outscored by 9.1 PPG on the road. Those numbers combine for a projected MOV for Minnesota of nearly 33 points! The game took place during the division round of the playoffs and the Vikings were 16.5-point favorites. You can click on the boxscore link to see the PFR boxscore for the game, which Minnesota won, 41-21.

YearHomeRoadHm PD/GRd PD/GProj MOVRdSpreadBoxscorePFPAW/L
1998MINARI23.63-9.1332.75D-16.5Boxscore4121W
1991WASDET22.88-7.530.38C-14Boxscore4110W
1973MIACIN21.86-6.7128.57DBoxscore3416W
1991WASATL22.88-426.88D-11.5Boxscore247W
1999STLTAM24.63-226.63C-14Boxscore116W
1969MINCLE24.29-1.8626.14CBoxscore277W
1978DALATL14.75-11.2526D-15Boxscore2720W
1987SFOMIN20.29-4.1324.41D-11Boxscore2436L
1979PITHOU20.38-424.38C-9.5Boxscore2713W
1950RAMCHI23.5-0.1723.67DBoxscore2414W
2008CARARI15.38-7.8823.25D-10Boxscore1333L
1999STLMIN24.631.3823.25D-7Boxscore4937W
1977RAMMIN18.86-422.86DBoxscore714L
1997DENJAX22-0.3822.38W-6.5Boxscore4217W
2011NORDET23.25122.25W-10.5Boxscore4528W
2007NWEJAX21.5120.5D-13.5Boxscore3120W
1996PITIND15-5.3820.38W-8Boxscore4214W
1996CARDAL16.5-3.7520.25D3.5Boxscore2617W
1996DENJAX14.38-5.8820.25D-12.5Boxscore2730L
1979PITMIA20.380.2520.13D-9.5Boxscore3414W
2004ATLSTL6.88-12.8819.75D-6.5Boxscore4717W
2011GNBNYG18.75-0.8819.63D-8Boxscore2037L
2007NWESDG21.51.8819.63C-14Boxscore2112W
1989SFOMIN14.88-4.3819.25D-7.5Boxscore4113W
1985CHIRAM19.50.2519.25C-10.5Boxscore240W
1969MINRAM24.295.1419.14DBoxscore2320W
1969DALCLE17.29-1.8619.14DBoxscore1438L
2009NWEBAL18.38-0.6319W-4Boxscore1433L
1973MIAOAK21.862.8619CBoxscore2710W
1998NYJJAX16.38-2.518.88D-9Boxscore3424W
2012DENBAL16.13-2.6318.75D-9Boxscore3538L
2005SEAWAS16.75-1.8818.63D-8.5Boxscore2010W
1985MIACLE13-5.6318.63D-10.5Boxscore2421W
1979SDGHOU14.63-418.63D-8Boxscore1417L
1977DALMIN14.57-418.57CBoxscore236W
1998MINATL23.635.2518.38C-11Boxscore2730L
1998DENMIA14.63-3.2517.88D-13.5Boxscore383W
2011SFONYG16.75-0.8817.63C-2Boxscore1720L
1999JAXMIA13.63-3.8817.5D-8Boxscore627W
1954CLEDET21.674.1717.5CBoxscore5610W
1991HOUNYJ15.63-1.7517.38W-9Boxscore1710W
2001PITBAL14.5-2.7517.25D-5.5Boxscore2710W
1963SDGBOS12.86-4.2917.14CBoxscore5110W
2012BALIND9.38-7.6317W-7Boxscore249W
1997SFOMIN15.38-1.6317D-11.5Boxscore3822W
1998DALARI7.75-9.1316.88W-7Boxscore720L
1969OAKHOU13.71-3.1416.86DBoxscore567W
1967OAKHOU21.714.8616.86CBoxscore407W
1996GNBCAR18.882.1316.75C-12Boxscore3013W
1988CINSEA15.38-1.3816.75D-6.5Boxscore2113W

[continue reading…]

{ 3 comments }

Brees and Wilson scheming to get on an amusement park ride

Brees and Wilson scheming to get on an amusement park ride.

New Orlean’s Drew Brees is officially listed as six feet tall. Seattle’s Russell Wilson is officially listed as 5’11. That means the average height of the starting quarterbacks in tonight’s game is 71.5 inches, tied for the shortest average in any game since 1964. In fact, it’s been twelve years since a game has featured two quarterbacks of such short stature, when in week two of the 2001 season, Doug Flutie (5’10) and the Chargers beat Anthony Wright (6’1) and the Cowboys.

The other two games since 1990 where the average height of the starting quarterbacks was below six feet also involved Flutie facing a 73-inch quarterback: a 24-21 win in 1999 against Pittsburgh and Kordell Stewart and a 17-16 win year earlier against Mark Brunell and the Jags.

Twenty-five years ago, two other Flutie vs. 6’1 Quarterback games make the list: this game against Jim McMahon and this one against Dave Krieg.

You have to go back to 1978 to find a game before tonight where (1) the average height of the starting quarterbacks was under six feet and (2) Doug Flutie was not involved. Fran Tarkenton (6’0) and Pat Haden (5’11) met five times in the mid-to-late ’70s, and Billy Kilmer (6’0) also faced Haden in the final game of the 1977 season.

Kilmer and 5’11 Bob Berry met three times in the early ’70s, and Sonny Jurgensen (5’11) faced Gary Cuozzo (6’0) and Tarkenton twice each. The only other games of the post-merger era were Len Dawson (6’0) vs. Berry in 1972 and Bill Nelsen and Edd Hargett in 1971. [continue reading…]

{ 7 comments }

Is there a harder award to predict in football? It would have been impossible to predict who would win the award this time last year, as eventual winner Bruce Arians wasn’t even a head coach until October. Of course, that doesn’t excuse my terrible selection. As I said last year, predicting in the pre-season which coach will ultimately win the award is so difficult that Vegas doesn’t even offer odds on the event. For reference, below is a look at every coach to ever be selected by the Associated Press as NFL Head Coach of the Year: for what it’s worth, Arians saw the biggest increase in winning percentage of any COTY winner. Arians also broke a tenure deadlock: until last season, both 1st and 2nd-year coaches had won the award 15 times, but now first-year head coaches are in the lead having won the award 16 out of 57 times (28%).

[continue reading…]

{ 2 comments }

The man with the second longest TD streak played for the Chargers...

Last year, I noted that Drew Brees had thrown a touchdown in 37 consecutive games and examined his chances of breaking the NFL record. The current mark is held by Johnny Unitas, who threw a touchdown in 47 consecutive games from 1956 to 1960. By the end of the 2011 season, Brees had upped his streak to 43 games, which positions Brees to break the record in week 5 of this season, against his former team, the San Diego Chargers, on Sunday Night Football.

Assuming Brees breaks the record, we can expect a four-hour telecast devoted to the greatness of Drew Brees, which is largely warranted. Brees is a future Hall of Famer and one of the most accurate quarterbacks in the history of the game. And he’ll be breaking one of the oldest records in football, one currently held by the standard bearer at the position.

If you’ve been at Football Perspective for long, you probably know where this is going. How impressive will it be for Brees to break this record? The short answer is, probably not as impressive as you might think.

What are the odds of throwing a touchdown in 47 straight games [1]Assuming independence and a consistent rate per game? Brees deserves all of the credit and praise he gets for being an elite quarterback, and a Blaine Gabbert-type is obviously not going to be the one to break this record. But the real question we want to ask is what are the odds of a star quarterback throwing a touchdown in 47 consecutive games. We can get a pretty good estimate of that.

In 44 games from 2002 to 2005, Marc Bulger threw a touchdown in 93% of his games, or 41 of 44 games. And in two of the games where he did not throw a touchdown, he threw fewer than five passes. In 73 games from 2000 to 2004, Daunte Culpepper threw a touchdown in 86% of his games. Brett Favre, from 2001 to 2004, threw a touchdown in 95% of his games. Eli Manning, from 2005 to 2011, threw a touchdown in 86% of his starts and was booed by Giants fans in just as many. Peyton Manning, excluding his rookie year, threw a touchdown in 87% of his games with the Colts. Philip Rivers once threw a touchdown in 50 of 54 straight games. Aaron Rodgers has thrown a touchdown in 50 of his last 53 games, with one of his zeroes coming in a partial game against the Lions. Tony Romo has thrown a touchdown in 90% of his games since 2007, and 92% of those games if you exclude two games he did not finish. Matt Ryan has thrown a touchdown in 30 of his last 31 games. Matthew Stafford has thrown a touchdown in 28 of his last 30 games, with one of his shutouts coming in a game he did not finish due to injury. From ’99 to ’01, Kurt Warner threw a touchdown in 93% of his games.

And then there’s Tom Brady. Since 2007, Brady has thrown a touchdown in 92% of his starts, or 94% if you exclude his game against the Chiefs when he tore his ACL in the first quarter. Brady has also thrown a touchdown in each regular season game the past two seasons, which means he could also break Unitas’ mark in 2012.

There is obviously an upper limit to the question ‘what is the likelihood of an elite quarterback playing at an elite level throwing a touchdown in any given game?’ Last year, I speculated that Brees’ likelihood was around 89-91%, which in retrospect, might be a little low. The upper limit is probably closer to 96 or 97%, although obviously very few quarterbacks could get there. If we assume complete games — i.e., that the quarterback won’t get injured or get benched or rested — maybe a star quarterback in today’s game has a 94% chance of throwing a touchdown in any given game.

... as did the man with the longest streak

In that case, such a quarterback has a 5% chance of throwing a touchdown in 48 consecutive games. In some ways, of course, this is a “what are the odds of that” sort of question. Yes, Brees is at 43 in a row, but he’s not alone. Brady has thrown a touchdown in every game the last two seasons. Stafford has done it in 18 straight games, Rodgers for 17, and Ryan is at 15. And, of course, players like Kurt Warner and Brett Favre and Peyton Manning have played at elite levels for stretches just like Brees.

Perhaps the better question is, assuming 14 elite quarterbacks playing at elite levels play in 48 straight games, and each has a 94% chance of throwing a touchdown in any given game, what are the odds that none of them go 48/48? The answer to that: 48%. In other words, it is more likely than not that some quarterback would break the record.

Brees deserves all the praise in the world for essentially putting himself at the upper limit of elite quarterback play. He deserves credit for having a quick release and excelling at pre-snap coverage, which limits the amount of hits he takes. On the other hand, he’s fortunate to have almost entirely avoided playing in poor weather. He’s fortunate to have avoided injury on the hits he has taken, and to have not played for a coach that chose to bench him for a meaningless game after a drive or two (in fact, he missed week 17 of the 2009 season entirely, keeping his streak alive). He’s also fortunate that he’s thrown a touchdown in 43 games and not 41 or 42 out of 43, like many other elite quarterbacks. Brees has had bad games during this streak — in 7 of them, he’s averaged 4.8 AY/A or fewer — but he always managed to throw at least one touchdown. That’s less skill than luck, and you can read about some of Brees’ near misses here.

The skill involved for Brees is getting himself to that upper limit. Given enough quarterbacks playing at elite levels for enough years, Unitas’ record was bound to fall. Brees happens to be one of those quarterbacks.

References

References
1 Assuming independence and a consistent rate per game
{ 7 comments }

One of my law school professors was very quirky, even by law school professor standards. His preferred examination method was multiple choice, but with a twist. After grading each exam, he would then divide the students into quarters based on their test score. He would then re-examine each question, and measure how the top quarter of students performed on each question relative to the bottom quarter. Any question that more bottom-quarter students answered correctly than top-quarter students would be thrown out, and the exam would be re-graded. As he delicately put out, ‘if the wrong students are getting the question right, and the right students are getting the question wrong, it’s a bad question.’

NFL passing records are falling for a variety of reasons these days, including rules changes and league policies that make the passing game more effective. But there’s another reason: for the first time in awhile, the right people are throwing the most passes in the league. And there’s no better example of that than Drew Brees. Since coming to the Saints in 2006, he’s ranked 1st or 2nd in pass attempts four times, and ranked in the top three in net yards per attempt four times. But even since ’06, we’ve seen the passing game evolve, as the best quarterbacks are now the most likely ones to finish near the top of the leaderboard in pass attempts. In 2010, Peyton Manning had his first 600-attempt season… when he threw 679 passes for the Colts. Tom Brady threw 611 passes last year for the 13-3 Patriots, making New England one of just three teams to threw 600 pass attempts and win 13 or more games in a season. The other two teams? The ’09 Colts and the ’11 Saints.

At various points in the history of the NFL, passing was viewed as an alternative to running, and the high-attempt game was the province of the trailing team. But times are changing in the NFL. I calculated each team’s net yards per attempt (NY/A) and total pass attempts (attempts plus sacks) for every year since 1970. Then, I measured the correlation coefficient between NY/A and pass attempts for the league for each of the last 42 seasons. The chart below shows the correlation coefficient between those two variables (NY/A and pass attempts) for the league as a whole for each year since the merger:
[continue reading…]

{ 1 comment }