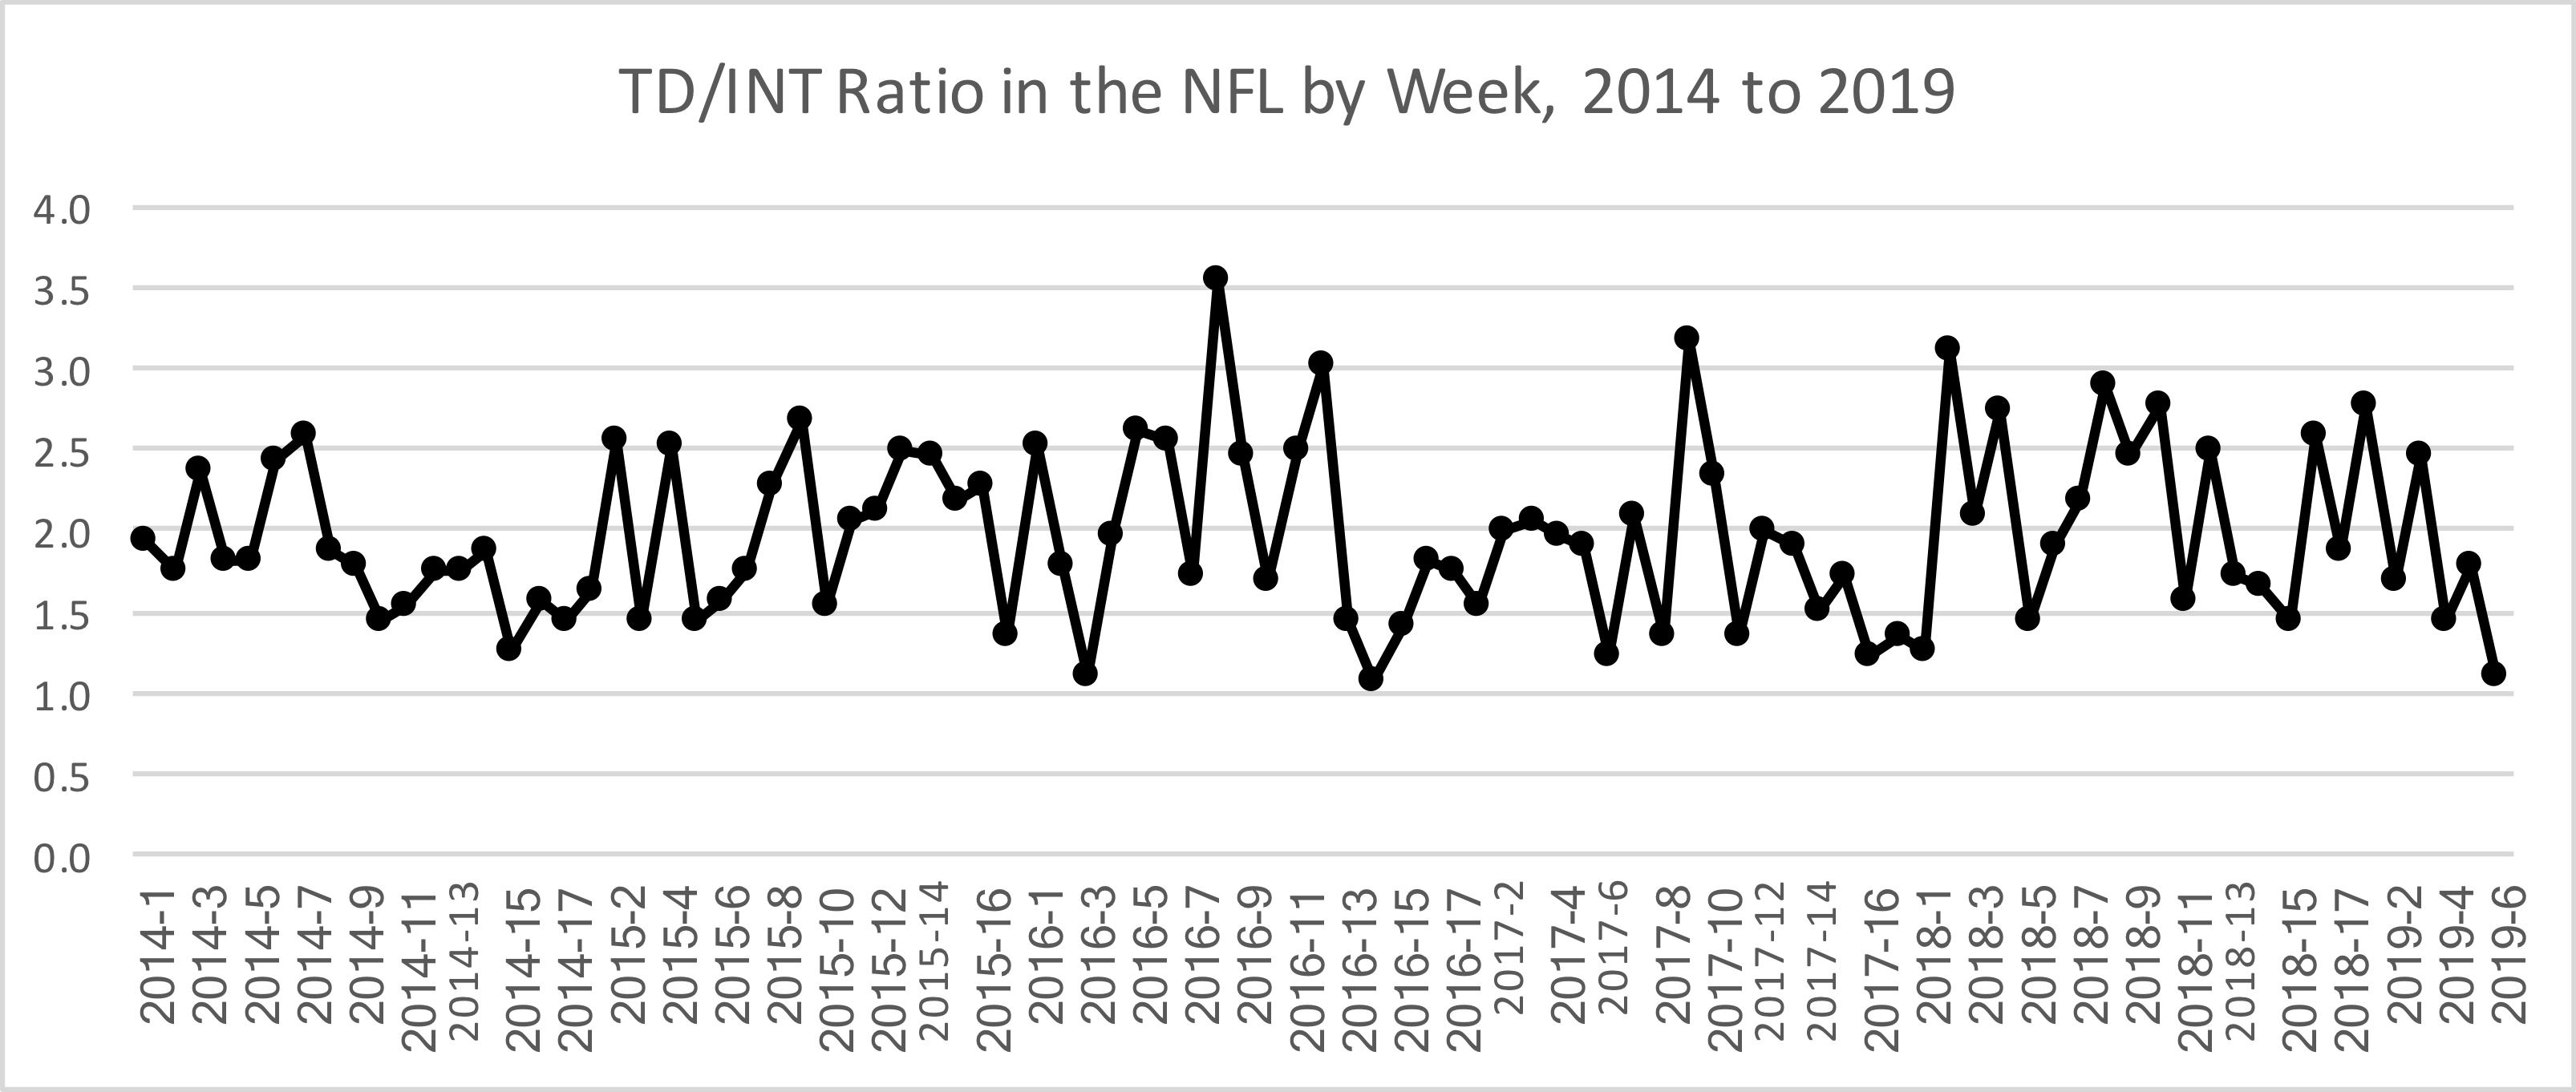
This was another rough week for passers, at least by 2019 standards. The most remarkable stat was the TD/INT ratio, which was just 35/32 in week six. The graph below shows the TD/INT ratio for each week since the start of the 2014 season; other than week 14 of 2016 (38 TDs, 36 INTs), this was the worst week of this period:
And if you weren’t watching the Falcons/Cardinals game, you probably thought week 6 was really ugly. Outside of that game, NFL teams threw for just 28 touchdowns across 26 teams, but the story of the week was in Arizona. Because once again, Matt Ryan in a losing effort is becoming a thing. Since the start of the 2018 season, Ryan has lost while averaging over 12.0 ANY/A and throwing for over 350 yards, lost while averaging over 11.0 ANY/A and throwing for over 400 yards, and now lost while averaging over 11.0 ANY/A and throwing for over 350 yards. Since the start of the 2018 season, there have been just 17 times when a quarterback has hit the 11.00 ANY/A and 350-yard thresholds; Ryan is 0-3 in these games, while the rest of the NFL is 14-0.
The reason Ryan lost, of course, was his defense, but some (much?) of the credit must go to Kyler Murray and the Cardinals, too (and some of the rest of the blame should go on the missed extra point at the end of the game). The number one overall pick had the best game of his young career on Sunday, and finished with the third best passing performance of the week. The full week 6 passing stats are below:
| Rk | Quarterback | Tm | Opp | Result | Att | Yds | TD | Int | Sk | Yds | ANY/A | VALUE |
|---|---|---|---|---|---|---|---|---|---|---|---|---|
| 1 | Matt Ryan | ATL | ARI | L 33-34 | 36 | 356 | 4 | 0 | 2 | 15 | 11.08 | 200 |
| 2 | Kirk Cousins | MIN | PHI | W 38-20 | 29 | 333 | 4 | 1 | 1 | 8 | 12 | 186 |
| 3 | Kyler Murray | ARI | ATL | W 34-33 | 37 | 340 | 3 | 0 | 0 | 0 | 10.81 | 185 |
| 4 | Sam Darnold | NYJ | DAL | W 24-22 | 32 | 338 | 2 | 1 | 2 | 12 | 9.44 | 123 |
| 5 | Russell Wilson | SEA | CLE | W 32-28 | 33 | 295 | 2 | 0 | 3 | 11 | 9 | 115 |
| 6 | Patrick Mahomes | KAN | HOU | L 24-31 | 35 | 273 | 3 | 1 | 1 | 17 | 7.53 | 62 |
| 7 | Case Keenum | WAS | MIA | W 17-16 | 25 | 166 | 2 | 0 | 0 | 0 | 8.24 | 61 |
| 8 | Kyle Allen | CAR | TAM | W 37-26 | 32 | 227 | 2 | 0 | 2 | 18 | 7.32 | 51 |
| 9 | Ryan Fitzpatrick | MIA | WAS | L 16-17 | 18 | 132 | 1 | 0 | 0 | 0 | 8.44 | 47 |
| 10 | Carson Wentz | PHI | MIN | L 20-38 | 40 | 306 | 2 | 1 | 2 | 14 | 6.83 | 43 |
| 11 | Matthew Stafford | DET | GNB | L 22-23 | 32 | 265 | 0 | 0 | 3 | 22 | 6.94 | 40 |
| 12 | Aaron Rodgers | GNB | DET | W 23-22 | 39 | 283 | 2 | 1 | 1 | 6 | 6.8 | 40 |
| 13 | Dak Prescott | DAL | NYJ | L 22-24 | 40 | 277 | 0 | 0 | 1 | 8 | 6.56 | 31 |
| 14 | Lamar Jackson | BAL | CIN | W 23-17 | 33 | 236 | 0 | 0 | 1 | 8 | 6.71 | 30 |
| 15 | Teddy Bridgewater | NOR | JAX | W 13-6 | 36 | 240 | 1 | 0 | 3 | 18 | 6.21 | 15 |
| 16 | Tom Brady | NWE | NYG | W 35-14 | 41 | 334 | 0 | 1 | 3 | 21 | 6.09 | 12 |
| 17 | Philip Rivers | LAC | PIT | L 17-24 | 44 | 320 | 2 | 2 | 1 | 4 | 5.91 | 4 |
| 18 | Devlin Hodges | PIT | LAC | W 24-17 | 20 | 132 | 1 | 1 | 0 | 0 | 5.35 | -9 |
| 19 | Jimmy Garoppolo | SFO | LAR | W 20-7 | 33 | 243 | 0 | 1 | 2 | 11 | 5.34 | -16 |
| 20 | Deshaun Watson | HOU | KAN | W 31-24 | 42 | 280 | 1 | 2 | 0 | 0 | 5 | -34 |
| 21 | Joe Flacco | DEN | TEN | W 16-0 | 28 | 177 | 0 | 1 | 1 | 10 | 4.21 | -47 |
| 22 | Jake Elliott | PHI | MIN | L 20-38 | 1 | 0 | 0 | 1 | 0 | 0 | -45 | -51 |
| 23 | Ryan Tannehill | TEN | DEN | L 0-16 | 16 | 144 | 0 | 1 | 4 | 35 | 3.2 | -52 |
| 24 | Andy Dalton | CIN | BAL | L 17-23 | 39 | 235 | 0 | 1 | 2 | 18 | 4.2 | -66 |
| 25 | Gardner Minshew | JAX | NOR | L 6-13 | 29 | 163 | 0 | 1 | 2 | 12 | 3.42 | -74 |
| 26 | Baker Mayfield | CLE | SEA | L 28-32 | 37 | 249 | 1 | 3 | 0 | 0 | 3.62 | -81 |
| 27 | Jared Goff | LAR | SFO | L 7-20 | 24 | 78 | 0 | 0 | 4 | 30 | 1.71 | -115 |
| 28 | Daniel Jones | NYG | NWE | L 14-35 | 31 | 161 | 1 | 3 | 1 | 0 | 1.44 | -140 |
| 29 | Marcus Mariota | TEN | DEN | L 0-16 | 18 | 63 | 0 | 2 | 3 | 7 | -1.62 | -156 |
| 30 | Jameis Winston | TAM | CAR | L 26-37 | 54 | 400 | 1 | 5 | 7 | 35 | 2.62 | -195 |
| 31 | Josh Rosen | MIA | WAS | L 16-17 | 25 | 85 | 0 | 2 | 5 | 30 | -1.17 | -209 |
| Total | 979 | 7131 | 35 | 32 | 57 | 370 | 5.81 | 0 |
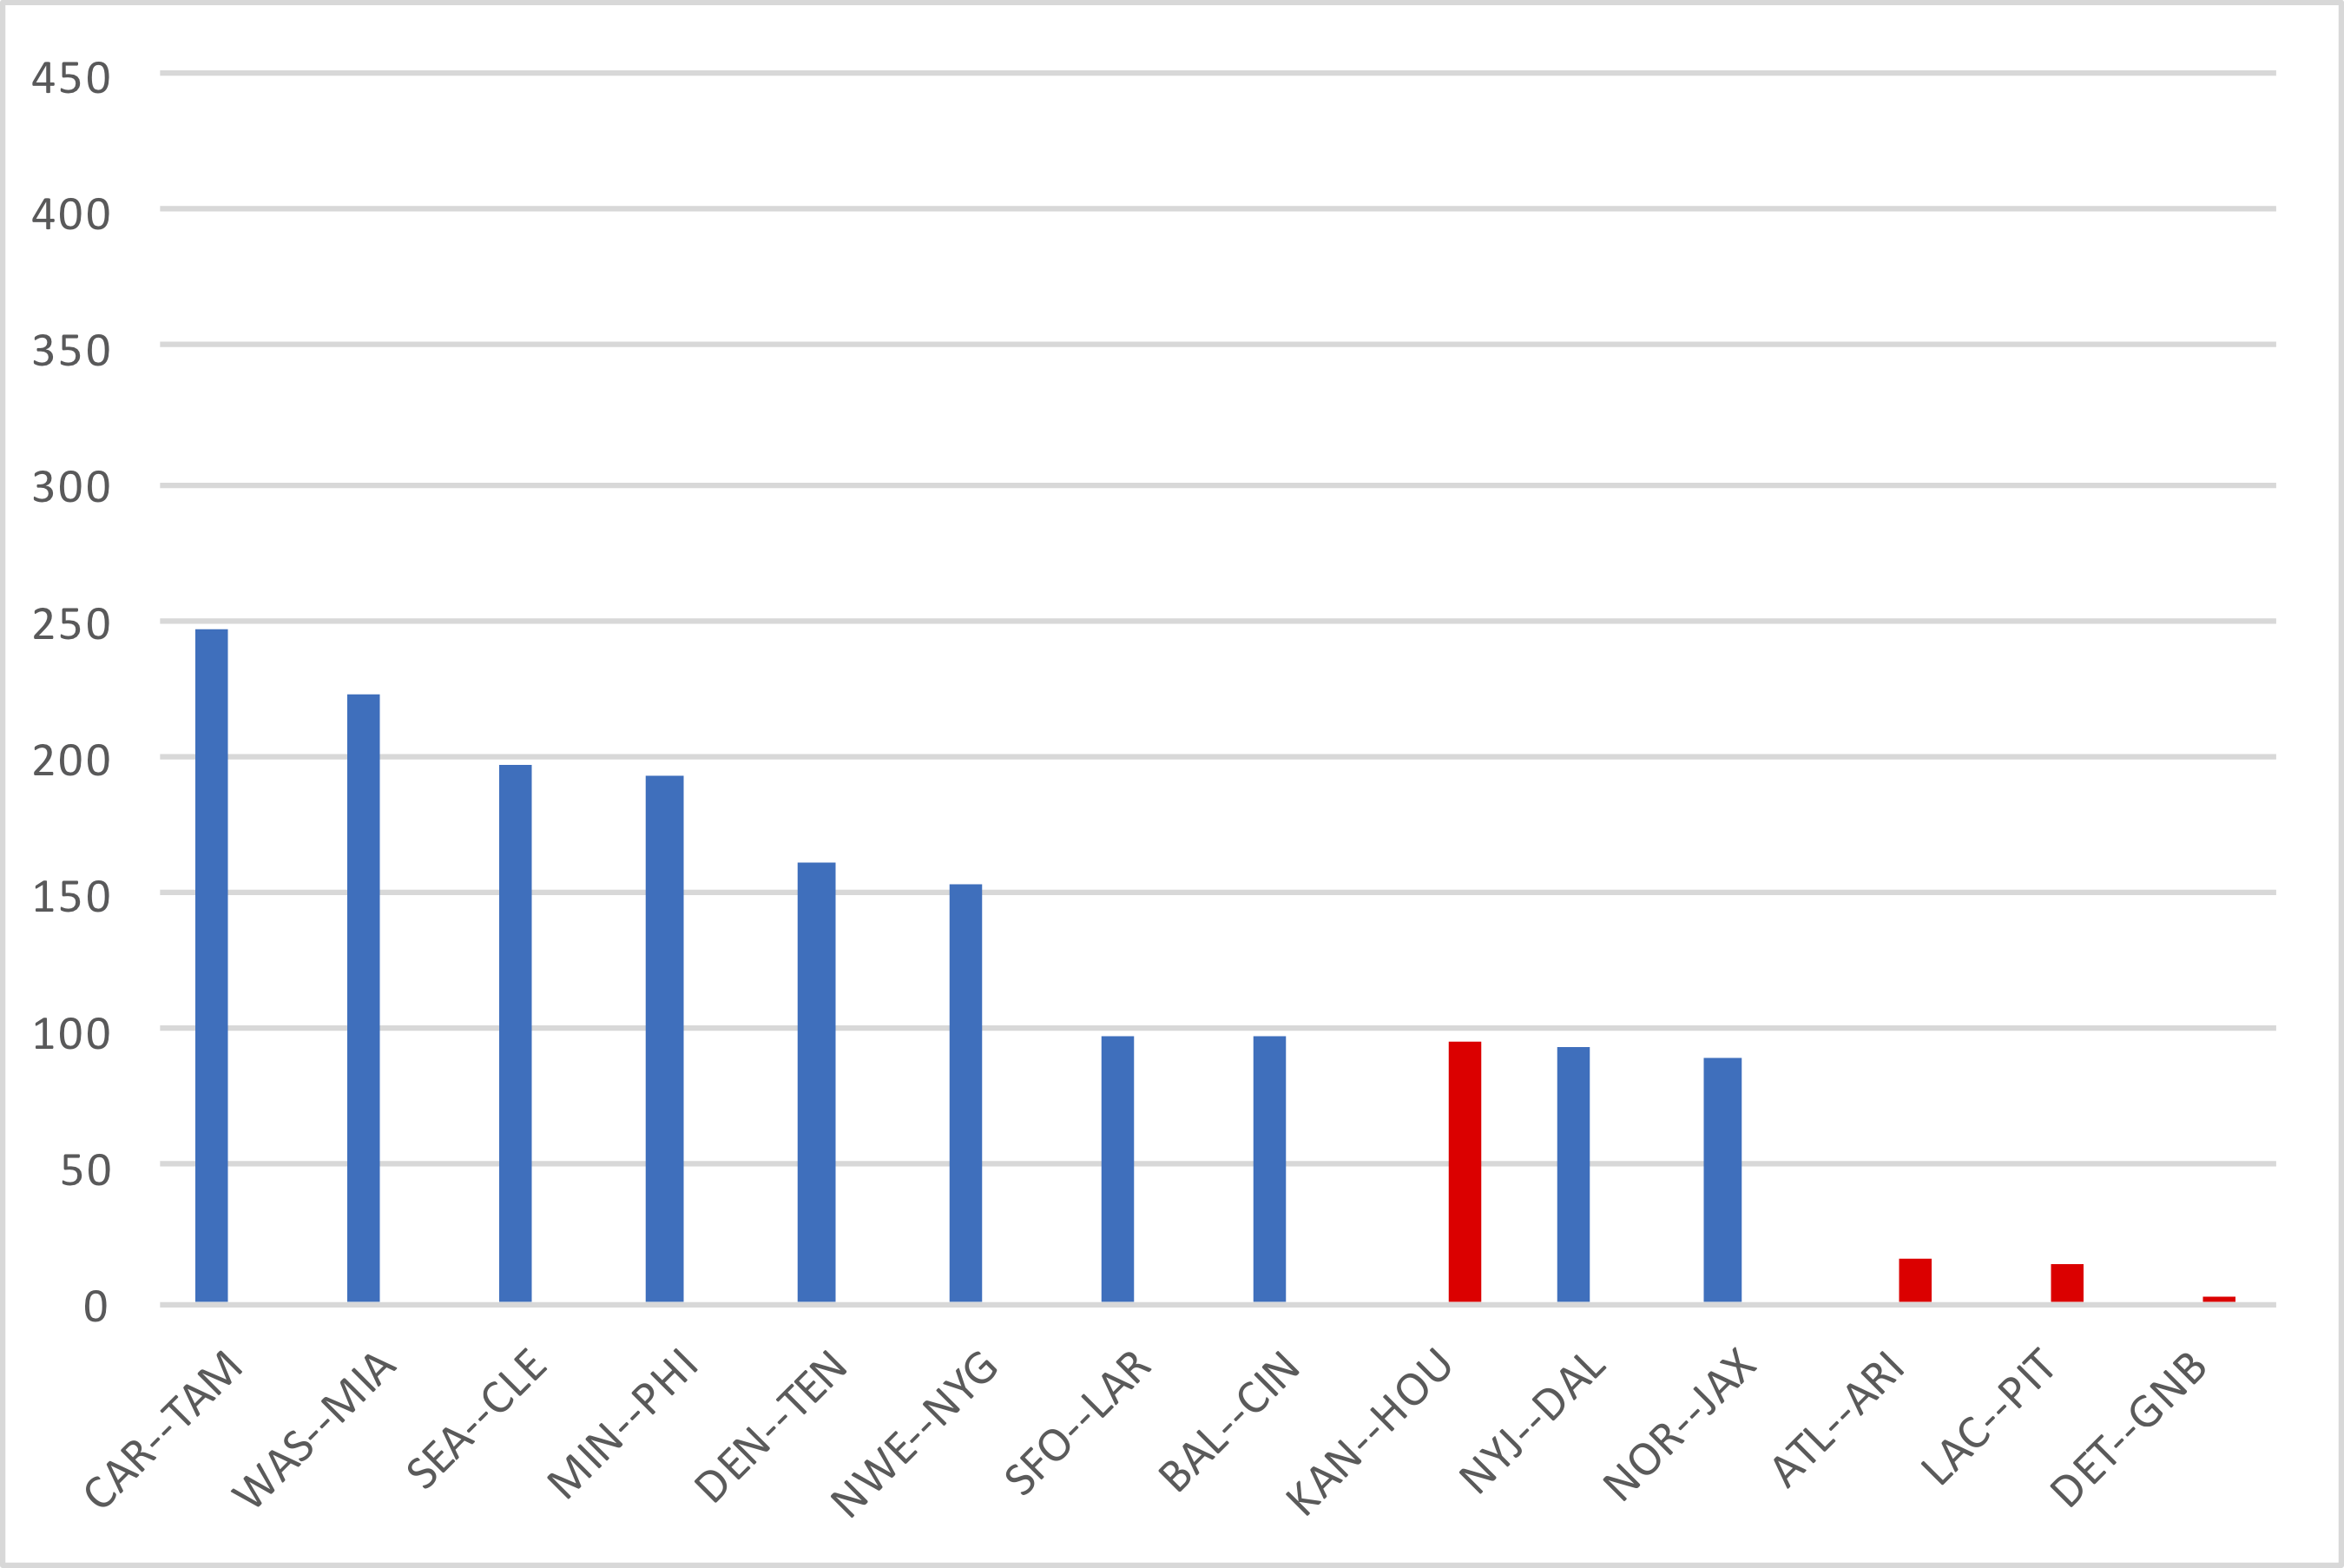
There were 14 games in week 6, and in 11 of those games, one team had the clear edge in passing efficiency. And as usual, 10 of those 11 teams emerged victorious. The one exception was in Kansas City, where Deshaun Watson and the Texans upset Patrick Mahomes and the Chiefs. This was a pretty interesting game, because Watson looked outstanding, and certainly better than his mediocre 5.00 ANY/A average. And Watson didn’t even take any sacks!
So what’s the explanation here? There are four reasons for Watson’s low score, which helps explain why Houston won despite losing the passing efficiency battle.
1) Watson rushed 8 times for 44 yards and 2 touchdowns (and a third 1st down), excluding kneels. And five of those runs came on scrambles, picking up 24 yards.
2) Watson threw for 20 first downs on his 30 completed passes, and picked up a first down on 48% of his dropbacks. There is generally a pretty strong correlation between NY/A and first downs per dropback — so far this year, the correlation coefficient is 0.80 — but this game was a huge outlier. There have been 184 team games so far this season; Houston had the 12th best passing 1st down rate of the season against Kansas City, but just the 82nd best NY/A game of the year and just the 125th-best ANY/A game of the year. In other words, Houston did about as well as you can do in the key stat ANY/A ignores, which is why Watson’s game was actually very good.
3) Watson threw three potential touchdown passes to Will Fuller, and he dropped each of them. Now this has nothing to do with why Houston won the game despite the poor numbers, of course, but if you were watching the game, you probably came away with a much better impression of Watson than his numbers showed because of Fuller’s drops.
4) Watson threw a pick on a bomb on 4th-and-1; this didn’t hurt the team’s win probability more than a normal incompletion (actually, it was better than a normal incompletion, because of the field position gained) but obviously cost him 45 yards in ANY/A.
The graph below shows the difference in passing VALUE between the better and weaker passing team in each game in week 6.