I calculated the Adjusted Net Yards per Attempt averages for every quarterback for every season in NFL history. I then calculated each quarterback’s Relative ANY/A, which is their ANY/A relative to league average. I wanted to then plot the big four quarterbacks of this era — Peyton Manning, Tom Brady, Drew Brees, and Aaron Rodgers — to see how they fared (after excluding seasons where the quarterback didn’t have enough pass attempts to qualify for the passing crown). I’ll leave the commentary to you guys, and I’ll just present the data in three different graphs.
First, let’s do it by chronological year. This means Manning’s graph starts early but ends, while Rodgers doesn’t get started until 2008. I have used blue/white for Manning, red/blue for Brady, gold/black for Brees, and green/gold for Rodgers.

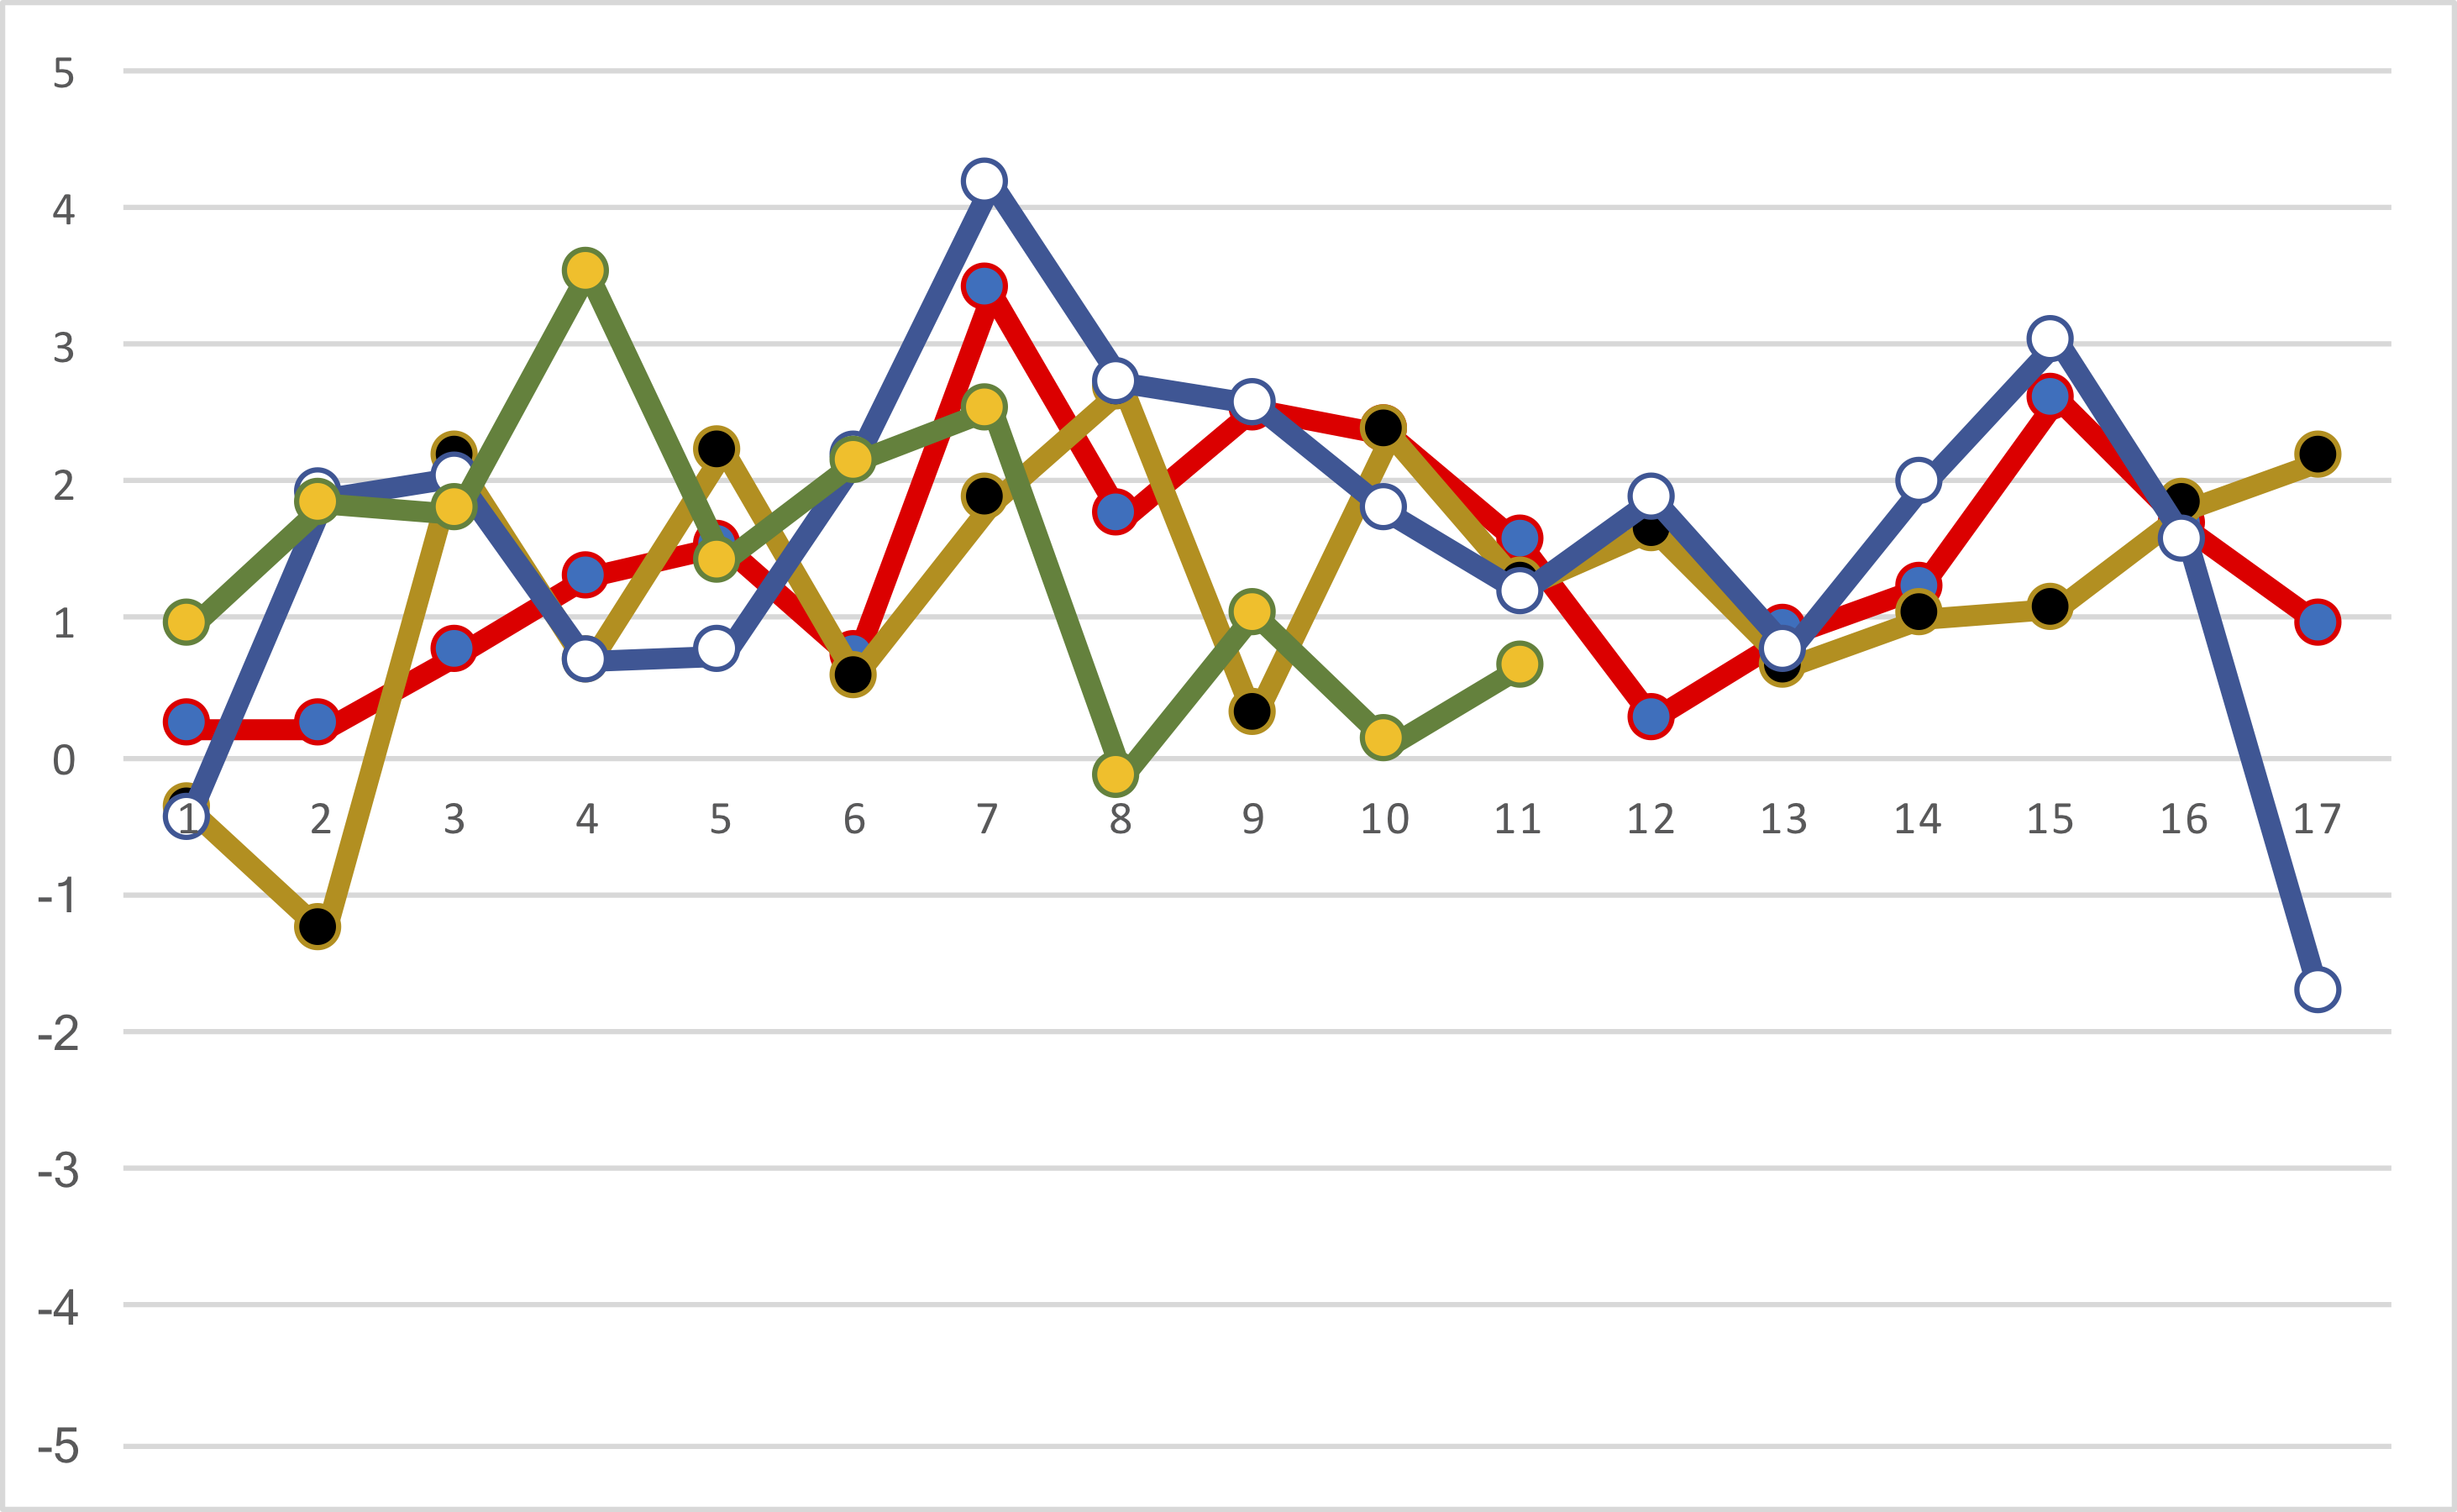
Next, let’s look at them on a year by year basis but start them all at the same time and ignore the missed seasons. So this graph shows each quarterback by years in the league, but again, discarding seasons without enough passes to qualify for the league crown.
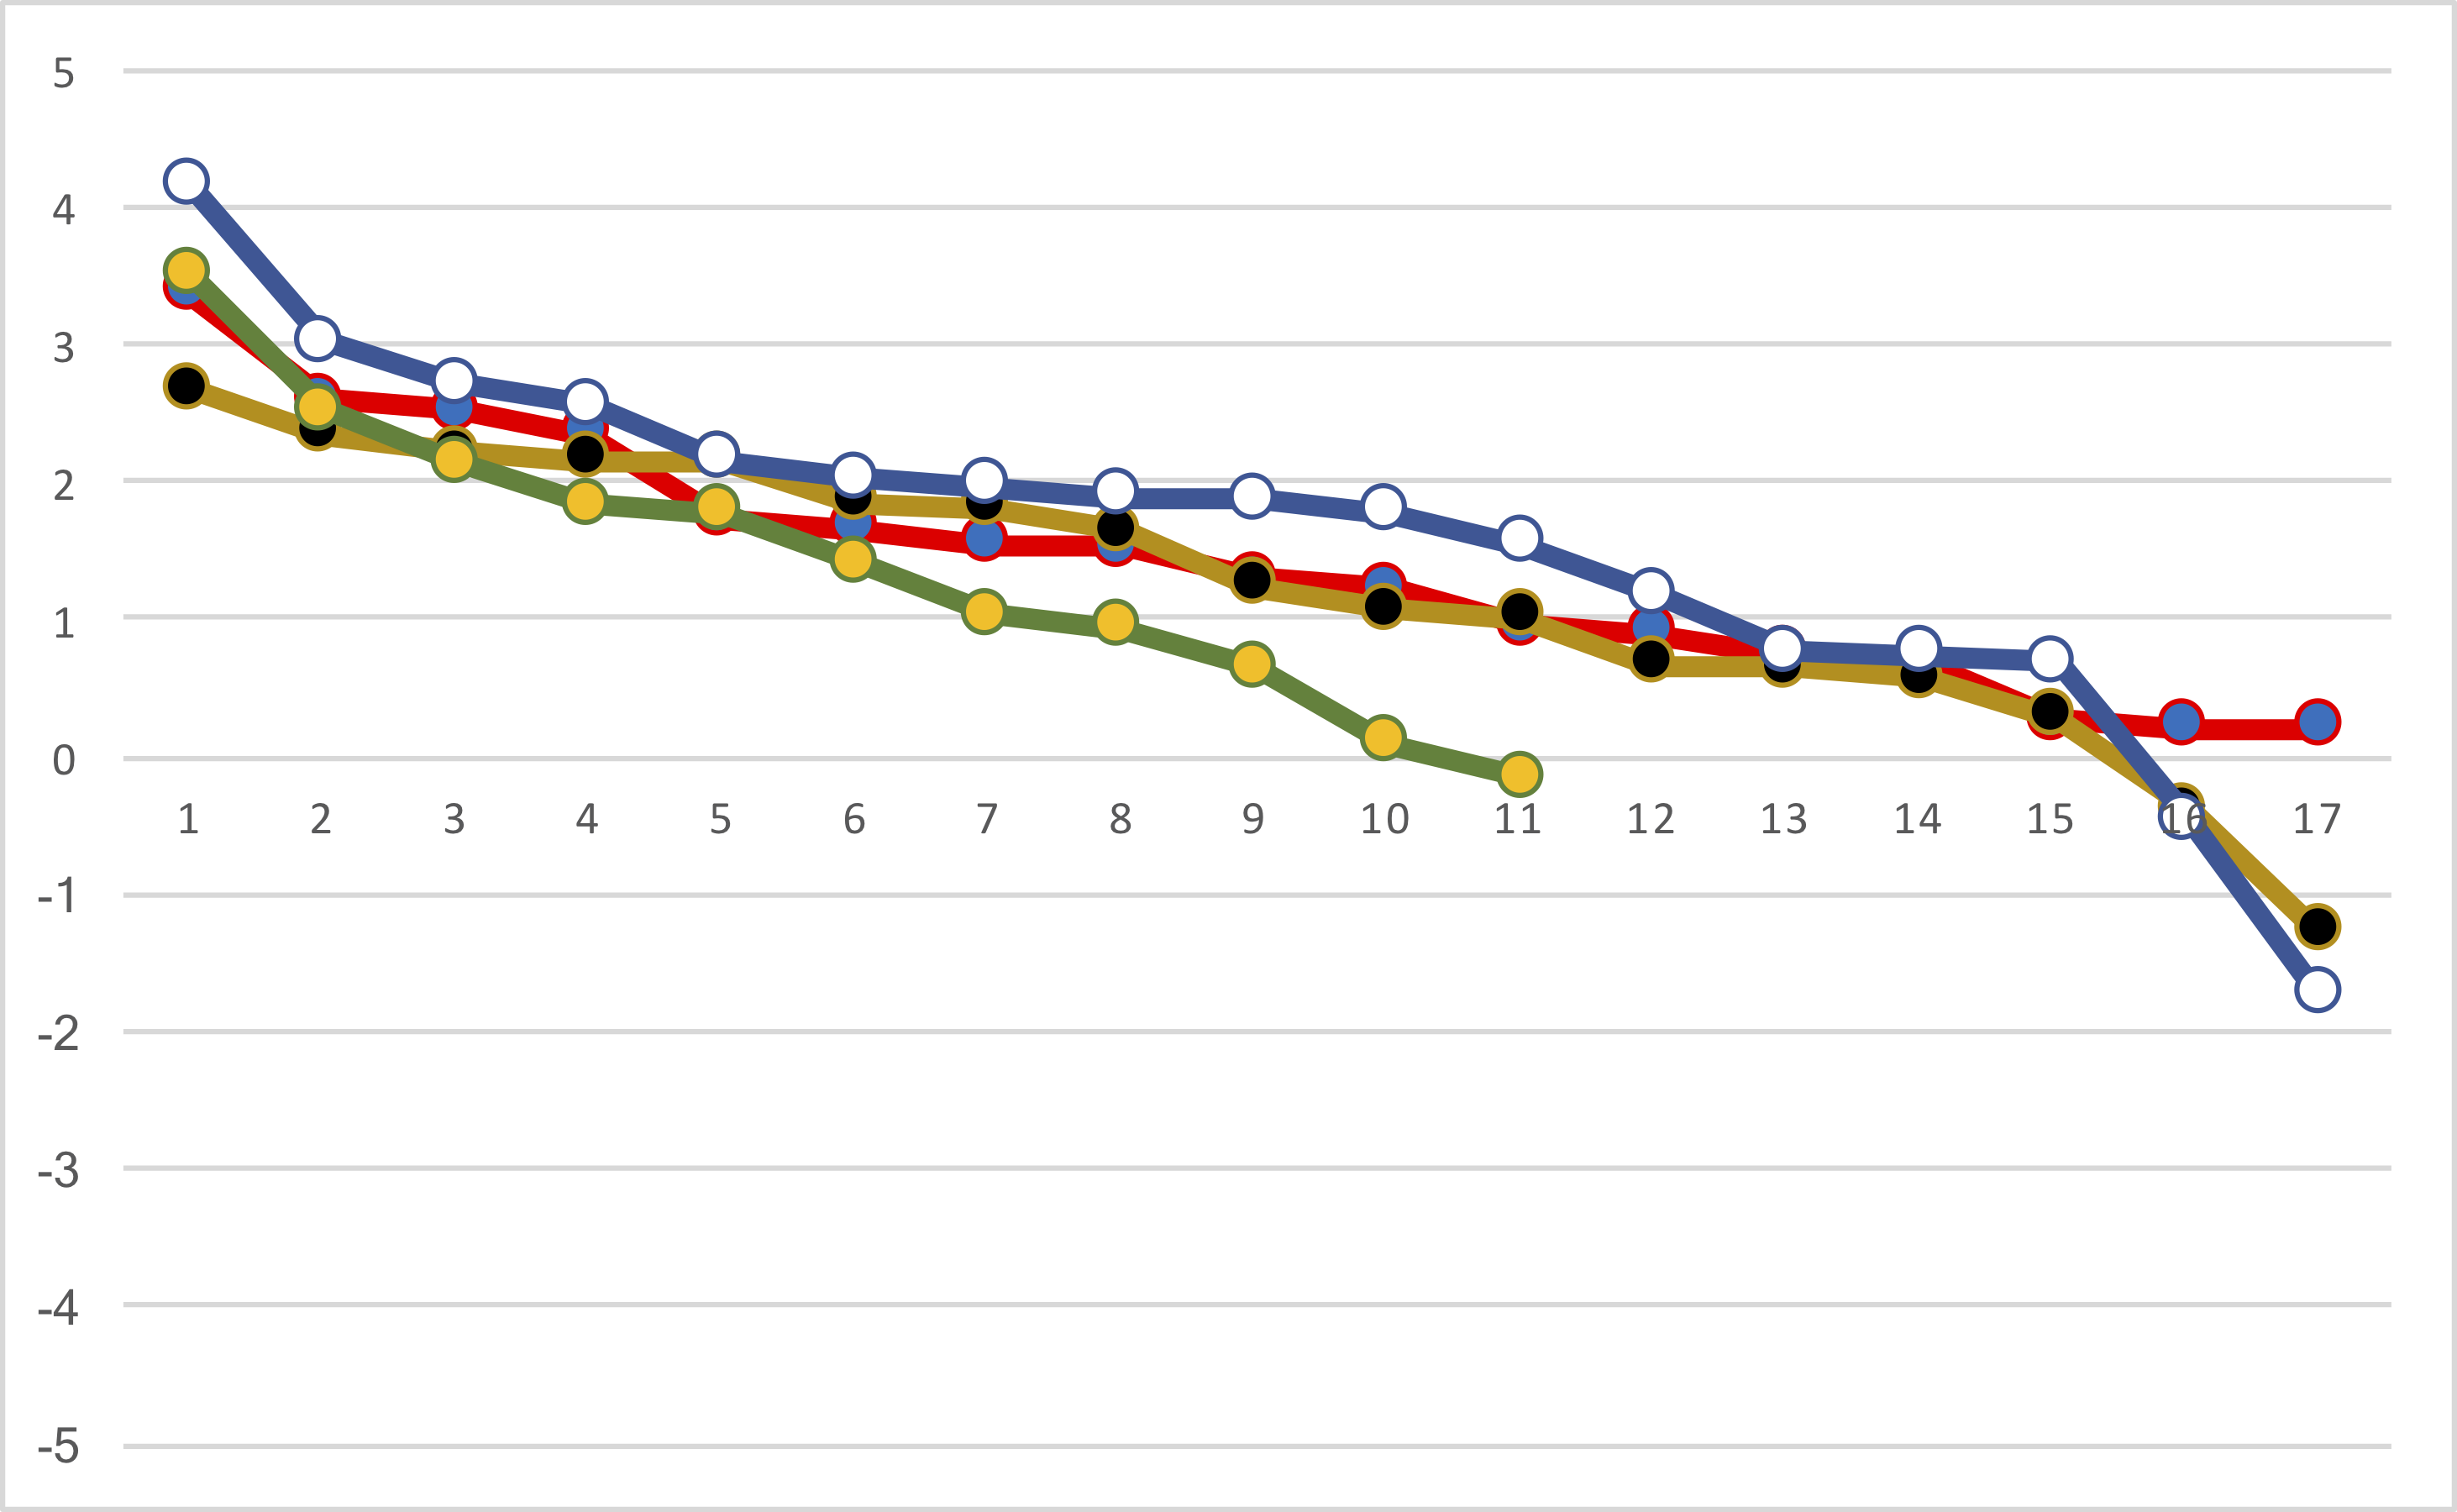
That is a bit jumbled, but this next graph is probably my favorite. This shows each quarterback’s RANY/A after sorting each quarterback’s career from best season to worst.