≡ Menu

Did you know that Dan Marino and Bob Griese have accounted for over 45% of all pass attempts, over 48% of all passing yards, and over 53% of all passing touchdowns in Miami Dolphins history? The Dolphins are the rare franchise that has just four players with more than 40 touchdown passes: Marino (420), Griese (192), Ryan Tannehill (123), and Jay Fiedler (66). But perhaps here is the most startling stat: Ryan Tannehill has the best passer rating in Dolphins history!

Yes, Tannehill — he of the back-to-back-to-back-to-back-to-back-to-back breakout seasons — has a better passer rating than both Marino and Griese, although of course that’s not true when you adjust for era. Marino ended his career with an 86.4 passer rating, and a 76.9 passer rating when adjusted for era. Griese had a 77.1 actual passer rating, and a 79.0 passer rating when adjusted for era (Griese also took a ton of sacks, while Marino took very few, which is the only reason Greise’s era-adjusted rating comes in ahead of Marino’s). Tannehill, through 2017, had a 65.1 era-adjusted passer rating, and in 2018, had a 66.4 EA PR, but his career un-adjusted passer rating is 87.0.

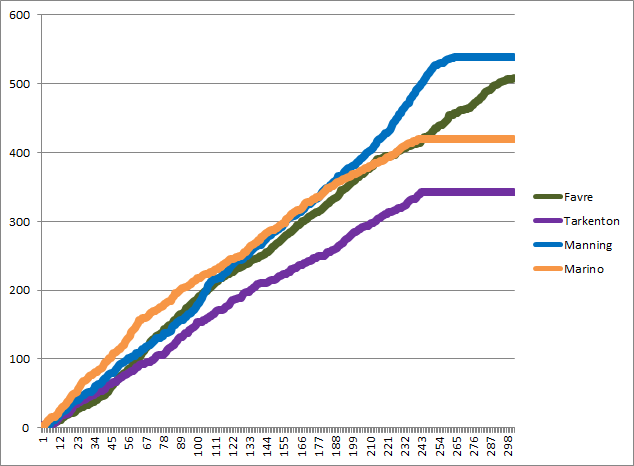
So while we know passer rating is silly to use when not adjusting for era, as a matter of trivia, it’s pretty interesting to see Tannehill ahead of Marino. But ANY/A — which includes sacks — is a better way to measure passing efficiency. And so today, I thought it might be interesting to look at the history of the Miami Dolphins passing offense and passing defenses, based on trailing 16 game averages.

That’s shown in this graph below. The orange line shows the trailing 16-game Adjusted Net Yards per Attempt average of the Dolphins offense going back to 1966. You can see the Marino-induced spike in ’84 and ’85, as more games from his historic 1984 season is captured by the trailing average. The aqua line shows the trailing 16-game ANY/A allowed by the Dolphins defense: the valleys shown in ’73/’74 and early 1983 are good representations of the Super Bowl defenses that carried the Dolphins in 1972, 1973, and 1982 (of course, the ’72 and ’73 offenses were good, too). [continue reading…]

{ 1 comment }

There have been four passing touchdown kings in the last 40 years: Fran Tarkenton, Dan Marino, Brett Favre, and Peyton Manning.  I thought it would be fun to plot the number of career touchdown passes each player had on the Y-Axis after each game of their career (shown on the X-Axis):

td pass leaders
[continue reading…]

{ 7 comments }

No, Peyton, you're the man

No, Peyton, you're the man.

In 1984, Dan Marino set an NFL record with 48 touchdown passes, but his Dolphins lost in the Super Bowl. Twenty years later, Peyton Manning broke Marino’s record, but he lost to the eventual Super Bowl champion Patriots in the playoffs. In 2007, Tom Brady broke Manning’s touchdowns record, but he lost in the Super Bowl, too.

When the greatest quarterback seasons of all time are discussed, these three years dominate the discussion. And with good reason. But if you include the playoffs — and frankly, there’s no reason not to include the playoffs — which quarterback produced the greatest season of all time? I’m going to stipulate that the greatest quarterback season ever has to end in a Lombardi Trophy, because otherwise, I think we’ll end up back in the world of Marino ’84/Brady ’07/Manning ’04. Of course, now another Manning season has entered the mix: and with a Super Bowl win, Manning’s 2013 should and would be remembered as the greatest quarterback season of all time.

So, the question becomes, which season would he knock off the top rung? I think there are six seasons that stand out from the rest, based on regular and postseason performance.

Honorable Mention [continue reading…]

{ 14 comments }

How quaint: a quarterback taking snaps form under center

How quaint: a quarterback taking snaps form under center.

With one game remaining, Peyton Manning has already set the new single-season record with 51 passing touchdowns (two months ago, I projected Manning to finish the season with 52 touchdowns). But all records must be viewed in their environment, and NFL teams are averaging 1.58 touchdown passes per team game this year, the highest average since 1948. In 1984, the year Dan Marino threw 48 touchdowns, teams averaged 1.37 touchdown passes per game.

So which season is more impressive? That’s a complicated question, and one that could be answered in many ways. In my view, the question boils down to which performance was more outstanding; in mathematical terms, we could define that as which season was farthest from the mean.

To make life a little simpler, I’m going to analyze this question on the team level, meaning we will compare “Denver 2013” to “Miami 1984.” Of course, this approach is preferable in many ways, since when we praise Manning we really mean “Manning with his offensive line and his coaching staff throwing to Demaryius Thomas, Wes Welker, Eric Decker, and Julius Thomas.” And “Marino in 1984” means “Marino and Mark Clayton and Mark Duper and Dwight Stephenson and Ed Newman.”

This season, the Broncos have 51 touchdown passes. The other 31 teams (through 15 games) are averaging 22.8 passing touchdowns, which means Denver is 28.2 touchdowns above average. The standard deviation of the 32 teams in passing touchdowns is 7.4; as a result, we can say that the Broncos are 3.84 standard deviations above average, also known as their Z-score.

In 1984, the other 27 teams (through 16 games) averaged 21.0 touchdowns, while the Dolphins threw 49 scores (Jim Jenson, a college quarterback who played receiver for Miami, threw a 35-yard touchdown to Duper against the Patriots off a Marino lateral). The standard deviation that season in touchdown passes at the team level was 7.5, which gives Miami a Z-score of 3.72 in 1984.

So the Broncos this season have been more extraordinary, at least by this measure. One nice thing about using the Z-score is we don’t need to adjust for games played. I went ahead and calculated the Z-scores for every team since 1932. The current Broncos are #1, with the ’84 Dolphins in second place. The third place team isn’t the Tom Brady 2007 Patriots; that team is down at #7, because the standard deviation in passing touchdowns among the league’s 32 teams was 8.8 that season. Instead, the third slot goes to the 1986 Dolphins. Few remember that Marino threw 44 touchdowns that season; add in Don Strock’s two touchdowns, a lower league average and a smaller standard deviation, and those Dolphins get a Z-score of 3.70.

Let’s look at the top 100 teams using this metric. The 2004 Colts ranked fifth (if you click on the cell in the team column, the link takes you to that team’s PFR page) in Z-score. That year, Indianapolis threw 51 touchdowns, while the other 31 teams averaged 21.97 touchdown passes. That means Indianapolis was 29.03 touchdowns above average, the highest production above average to date. But that year, the standard deviation among the 32 teams in passing touchdowns was 8.53, giving the Colts a Z-score of “only” 3.41; that’s why they’re 5th, not first.
[continue reading…]

{ 38 comments }

Is this a thinly-veiled Brady/Manning post?

Is this a thinly-veiled Brady/Manning post?

Last weekend, I looked at career rushing stats in wins and losses; today I will do the same but for quarterbacks.

I looked at all games, including playoffs, from 1960 to 2011, for all quarterbacks with at least 5,000 career passing yards over that time period. The table below lists the following information for each passer:

– His first year (or 1960, if he played before 1960) and his last year (or 2011, if still active)
– All the franchises he played for (which you can search for in the search box)
– His number of career wins, and his touchdown rate, interception rate, yards per attempt and Adjusted Yards per Attempt (which includes a 20-yard bonus for touchdown passes and a 45-yard penalty for interceptions) in wins [1]Unfortunately, I excluded sack data from this study due to its general unavailability for most of the covered time period.
– His number of career losses, and his touchdown rate, interception rate, yards per attempt and Adjusted Yards per Attempt in losses

The table is sorted by AY/A in wins; unsurprisingly, Aaron Rodgers — who is the career leader in that metric — tops this table, too. In fact, Rodgers is also the leader in AY/A in losses. Note that this table includes all games played by the quarterback, not just his starts.

RkPlayerYearsTeamsPYDWinTD%_WINT%_WY/A_WAY/A_WLossTD%_LINT%_LY/A_LAY/A_L
1Aaron Rodgers2005--2011gnb19147497.6%1.3%8.78.3274.3%2.5%7.46.4
2Matt Schaub2004--2011atl-htx17936485.3%1.7%8.78.1533.5%3.3%7.25.8
3Tony Romo2005--2011dal21666606.6%2.1%8.77.9434.3%3.4%75.5
4Kurt Warner1998--2009ram-nyg-crd36296816.8%2.2%8.77.8573.3%4.4%7.25.3
5Daunte Culpepper1999--2009min-mia-rai-det25133457.1%2.2%8.77.8643.3%4%6.95.1
6Bob Berry1965--1975min-atl9197327.4%2.3%8.67.7364.2%7.4%7.13.8
7Steve Young1985--1999tam-sfo364501256.8%1.7%8.37.6602.9%4.2%7.25.3
8Philip Rivers2004--2011sdg26105696.2%2.3%8.57.6394%3.1%7.36
9Ben Roethlisberger2004--2011pit29729905.7%2.2%8.47.6383.7%4.9%7.25
10John Friesz1990--2000sdg-was-sea-nwe8699195%1%7.87.5382.6%4%5.84
11Bart Starr1960--1971gnb22810996.6%2.9%8.67.5412.4%5.9%6.74.1
12Don Meredith1960--1968dal17750518.5%3.3%8.87.5503.5%6%6.23.6
13Drew Brees2001--2011sdg-nor43722976.5%1.7%87.4663.4%3.7%6.75.1
14Ken O'Brien1984--1993nyj-phi25598565.8%1.7%87.4722.1%3.6%6.34.7
15J.P. Losman2004--2011buf-rai-mia6271175.8%1.5%7.97.4282.5%4.4%6.14.1
16Trent Green1997--2008was-ram-kan-mia28794595.3%2.1%8.27.3633.6%3.8%7.15.5
17Rob Johnson1995--2003jax-buf-tam-was-rai5947204.8%1.5%7.97.3252.8%3.6%6.75.1
18Chad Pennington2000--2010nyj-mia19241465.1%1.2%7.77.3493.2%4.1%6.64.9
19Boomer Esiason1984--1997cin-nyj-crd38520896.6%2.4%8.27.31033.3%4.4%6.54.6
20Neil Lomax1981--1988crd23156486.4%2.1%8.17.3593%3.3%6.65.2
21David Garrard2002--2010jax16489455.3%1.4%7.87.3442.7%3.4%6.44.9
22Matthew Stafford2009--2011det8220138.1%1.8%7.97.2173.4%4.4%6.34.4
23Joe Montana1979--1994sfo-kan463231406.4%2.2%8.17.2602.7%3.4%6.34.9
24Eddie LeBaron1960--1963dal53311112.5%5.5%9.47.2314.7%8.7%7.13.3
25Peyton Manning1998--2010clt602171506.3%1.9%87.2773.9%4.1%6.95.2
26Ed Brown1960--1965chi-pit-clt7723357.7%5.8%9.77.2332.9%8.8%6.52.6
27Wade Wilson1981--1998min-atl-nor-dal-rai18605666.1%2.6%8.37.2632.4%5.3%6.23.9
28Jay Cutler2006--2011den-chi18637426.6%2.2%8.17.2382.7%4.6%6.54.5
29Josh Freeman2009--2011tam8898175.6%1.8%7.97.2242.8%4.6%6.14.1
30Tom Brady2000--2011nwe452641406.1%1.6%7.87.2433.6%4.2%6.34.5
31Matt Moore2007--2011car-mia5137176.2%1.8%7.87.1192.8%5%6.24
32Chris Chandler1988--2004clt-tam-crd-ram-oti-atl-chi29212725.9%2.6%8.27.11053.1%4.4%6.44.4
33Len Dawson1960--1975cle-kan301121058.7%3.6%8.67.1643.2%6.3%6.63.8
34Joe Flacco2008--2011rav15348494.6%1.2%7.67.1243%4.4%5.94
35Trent Edwards2007--2010buf-jax6019144%1.6%7.77.1222%4.3%5.73.8
36Jeff Garcia1999--2009sfo-cle-det-phi-tam26894635.4%1.3%7.57.1683.4%3.1%6.45.1
37Ken Anderson1971--1986cin341591006.2%2.4%87.1922.7%4.7%6.74.7
38Rudy Bukich1960--1968pit-chi7865307.5%3.5%8.57353.5%8.6%62.3
39Troy Aikman1989--2000dal367911054.8%2.1%7.97762.1%4.1%64.2
40Damon Huard1998--2008mia-nwe-kan6349204.9%1.1%7.47242%4.3%5.84
41Jim Everett1986--1997ram-nor-sdg35957665.7%2.6%8.17973.2%4.2%6.54.6
42Roger Staubach1969--1979dal254911066.1%2.5%87443.5%6.3%6.73.9
43Bert Jones1973--1982clt-ram18589476.4%3.1%8.27583.6%4.6%6.34.3
44Frank Reich1985--1998buf-car-nyj-det6858398.8%2.1%7.77393.3%4.3%6.34.4
45Jeff Hostetler1986--1997nyg-rai-was17464705.5%1.9%7.77402.3%4.1%6.34.5
46Dan Fouts1973--1987sdg45165915.9%3.2%8.36.9953.1%5.5%7.14.7
47Bill Kenney1980--1988kan17374375.9%2.5%86.9493.2%4.2%6.54.6
48Y.A. Tittle1960--1964sfo-nyg11542408.9%4.3%8.76.9232.5%6.9%5.72.7
49Mark Brunell1994--2011gnb-jax-was-nor-nyj33905994.8%1.8%7.66.9913.2%2.9%6.24.9
50Aaron Brooks2000--2006nor-rai20822415.8%1.6%7.56.9543.3%4.1%6.44.7
51Patrick Ramsey2002--2008was-nyj-den5929165.2%2.3%7.86.9243.1%3.8%5.84.2
52Scott Mitchell1992--2001mia-det-rav-cin15925406%2.1%7.76.9452.6%4.6%5.93.9
53Randy Wright1984--1988gnb7106125.4%3.4%8.36.9332.2%5.5%5.93.5
54Rich Gannon1987--2004min-was-kan-rai30434915.5%1.5%7.46.9713%3.6%6.24.6
55Earl Morrall1960--1976det-nyg-clt-mia17529927.9%4.8%8.96.9444.2%6.9%6.63.6
56Sonny Jurgensen1960--1974phi-was31546747.7%3.9%8.46.9794.5%4.9%6.84.7
57Steve DeBerg1978--1998sfo-den-tam-kan-mia-atl34752725.4%2.3%7.86.91143.2%4.9%6.44.2
58Steve Beuerlein1988--2003rai-dal-crd-jax-car-den24317645.6%2.3%7.86.8663.4%4.2%6.85
59Fran Tarkenton1961--1978min-nyg488061316.8%2.8%86.81173.6%5.5%6.54.1
60John Brodie1960--1973sfo30783786.7%3.3%8.26.8793.3%6%6.13.5
61Doug Flutie1986--2005chi-nwe-buf-sdg15209485.2%2.4%7.86.8452.9%3.9%64.3
62Johnny Unitas1960--1973clt-sdg323351076.3%3.8%8.46.8592.7%7.3%6.53.2
63Joe Namath1965--1977nyj-ram28299686.4%4%8.56.8713.3%6.8%6.53.5
64Matt Ryan2008--2011atl14832436.1%1.9%7.56.8222.4%3%6.14.8
65Craig Erickson1992--1997tam-clt-mia7625184.8%2.7%7.96.8343.2%3.9%6.54.8
66Marc Bulger2002--2009ram23758424.9%2.6%7.86.8573.1%3.3%6.85.4
67Matt Cassel2005--2011nwe-kan11769425.1%2%7.66.8303.5%3.3%5.74.3
68Tom Flores1960--1969rai-buf-kan11960408.3%3.8%8.36.8442.8%6.7%5.72.8
69Phil Simms1979--1993nyg351411025.3%2.5%7.76.7723%4.3%6.44.6
70Derek Anderson2006--2011cle-crd-car9148215.5%2.4%7.76.7322.7%4.6%5.73.6
71Michael Vick2001--2011atl-phi18889655.8%2.4%7.76.7512.8%3.4%6.34.9
72Brett Favre1991--2010atl-gnb-nyj-min776932016.3%2.2%7.66.71253.2%4.9%6.44.3
73Craig Morton1965--1982dal-nyg-den291431186.7%3.7%8.26.7822.6%6.5%6.23.4
74Steve Pelluer1985--1990dal-kan6870173.3%2.2%7.66.7262.9%4.7%6.94.8
75Dan Marino1983--1999mia658711555.7%2.4%7.76.71054.1%3.9%6.85.1
76Donovan McNabb1999--2011phi-was-min408591065.4%2%7.46.7742.9%2.6%6.15
77Dave Krieg1980--1998sea-kan-det-crd-chi-oti400421136.7%3%7.96.7983%4.4%6.54.5
78Warren Moon1984--2000oti-min-sea-kan521951085.5%2.6%7.76.61103.1%4.2%6.84.9
79Jim Kelly1986--1996buf393301106.1%3.2%86.6673.1%4.6%6.64.6
80John Hadl1962--1977sdg-ram-gnb-oti339411037%3.7%8.26.6923.3%7.8%6.12.7
81Bernie Kosar1985--1996cle-dal-mia25254674.8%1.9%7.46.6663.1%3.4%6.65.1
82Jake Delhomme1999--2011nor-car-cle-htx22822655.5%2.9%7.86.6453.1%4.2%6.64.8
83Vince Evans1977--1995chi-rai9511377.1%3.8%8.26.6572.4%6%6.33.6
84John Elway1983--1998den564391635%2.6%7.76.6922.8%3.9%6.34.6
85Drew Bledsoe1993--2006nwe-buf-dal459461025.1%1.9%7.46.6992.4%4.2%5.94
86Jason Campbell2006--2011was-rai14417323.8%1.7%7.36.6393.3%2.7%6.45.3
87Pete Liske1964--1972nyj-den-phi5170167%2.6%7.66.6232.2%8.2%5.92.3
88Jeff George1990--2001clt-atl-rai-min-was28603485.5%2.7%7.76.6853.2%2.9%6.65.4
89Alex Smith2005--2011sfo13038334.4%1.1%76.6392.9%4.3%64.1
90Jim Zorn1976--1987sea-gnb-tam21249524.9%2.9%7.86.6682.8%5.4%6.13.7
91Lynn Dickey1971--1985oti-gnb23914526.5%4.4%8.46.6763.5%6.6%74.1
92Jon Kitna1997--2011sea-cin-det-dal30104565.7%2%7.46.6862.8%4.7%6.34.3
93Eric Hipple1981--1989det11009306.3%3%7.86.6361.8%5.5%6.44
94Bob Griese1967--1980mia265591087.4%3.9%8.16.5623.5%6.4%6.43.5
95Chris Miller1987--1999atl-ram-den19789375.7%2.4%7.56.5633.6%4.2%6.34.5
96Gus Frerotte1994--2008was-det-den-cin-min-mia-ram21666585.1%2.7%7.66.5602.5%4.1%6.24.4
97Matt Hasselbeck1999--2011gnb-sea-oti35891915.1%2.4%7.56.5803%3.4%6.34.8
98Tarvaris Jackson2006--2011min-sea7239274.5%3.1%7.86.5232.8%3.4%5.84.3
99Jeff Blake1992--2005nyj-cin-nor-rav-crd-phi-chi21711425.1%2.1%7.46.5773.6%3.6%6.34.7
100Tony Eason1983--1990nwe-nyj11703355.1%2.8%7.76.5313.3%3.4%6.75.2
101Jim Harbaugh1987--2000chi-clt-rav-sdg27194784.8%2.1%7.36.5932.3%3.6%6.24.6
102Don Majkowski1987--1996gnb-clt-det12906344.8%2.8%7.76.5432.6%4.2%64.2
103Gary Hogeboom1982--1989dal-clt-crd9598315.1%2.6%7.56.5282.7%6.1%6.74
104Joe Theismann1974--1985was26988956%2.8%7.66.5592.4%5.1%6.34.1
105Randall Cunningham1985--2001phi-min-dal-rav32405986.1%2.6%7.66.5733.1%3.6%6.34.7
106Byron Leftwich2003--2010jax-atl-pit-tam10439305%1.6%7.16.5312.6%3.5%6.24.7
107Tony Banks1996--2005ram-rav-was-htx15315435.2%2.2%7.46.5522%3.7%5.94.3
108Bobby Hebert1985--1996nor-atl22331635.2%3%7.76.5553.5%5%6.24.1
109Greg Landry1968--1984det-clt-chi16100556.7%3.9%8.16.5652.5%4.7%6.34.2
110Eli Manning2004--2011nyg30095775.5%2.2%7.36.4543.7%4.5%6.74.7
111Jay Fiedler1998--2005min-jax-mia-nyj12499505%2.6%7.56.4292.5%5.9%63.4
112Stan Humphries1989--1997was-sdg18538554.4%2.3%7.46.4392.2%5.1%5.93.7
113Jim Plunkett1971--1986nwe-sfo-rai28175855.6%3.4%7.96.4823.2%7.1%6.43.2
114Elvis Grbac1994--2001sfo-kan-rav17492614.8%2.4%7.46.4393.1%4.4%6.24.3
115Richard Todd1976--1985nyj-nor21636515.2%3.6%7.96.4703.2%7%6.23.1
116Steve Grogan1975--1990nwe27457806.7%4.3%8.26.4713.5%7.2%6.83.6
117Frank Ryan1960--1970ram-cle-was15833669.3%4.4%8.26.4424%6.1%6.63.9
118Carson Palmer2004--2011cin-rai25659505.9%2.9%7.66.4593.8%3.5%6.95.3
119Shaun Hill2005--2011min-sfo-det6209185.5%1.8%7.16.4163.2%2.8%6.35.1
120Mark Rypien1988--2001was-cle-ram-phi-clt20249585.7%3.3%7.76.4472.9%3.6%6.54.9
121Bubby Brister1986--2000pit-phi-nyj-den-min14801475.7%2.3%7.36.4511.9%4.3%5.93.9
122Kerry Collins1995--2011car-nor-nyg-rai-oti-clt42478924.4%2.1%7.26.41132.7%4%6.14.3
123Steve McNair1995--2007oti-rav330681004.6%2.1%7.26.4722.6%3.4%6.44.9
124Charlie Batch1998--2011det-pit10610405.2%2.8%7.56.3373.1%3.4%6.65.1
125Bill Nelsen1963--1972pit-cle15004466.5%4.1%86.3433%7.2%6.53.4
126Charley Johnson1961--1975crd-oti-den24410687.3%4.7%8.36.3703%5.9%6.33.6
127Steve Bartkowski1975--1986atl-ram24916605.9%3.1%7.66.3733.5%5.2%6.54.3
128Sam Bradford2010--2011ram567684.1%1.5%6.96.3181.9%2.5%5.64.5
129Gary Danielson1977--1988det-cle14000424.9%2.9%7.56.3433.5%5.3%6.74.4
130Brian Sipe1974--1983cle23896606%3.2%7.66.3623%5.4%6.23.8
131Jay Schroeder1985--1994was-rai-cin-crd20854715.2%2.7%7.46.3502.7%5.3%6.64.3
132Virgil Carter1968--1976chi-cin-sdg5127215.7%3%7.56.3242.1%4.7%5.63.5
133Tommy Kramer1977--1990min-nor25651645.9%2.8%7.46.3662.9%5.7%6.23.7
134Brad Johnson1994--2008min-was-tam-dal304571024.6%2.1%7.16.2702.9%3.9%6.24.5
135Kelly Holcomb1995--2007tam-clt-cle-buf-min645395.5%3.4%7.76.2294%4.5%6.54.6
136Quincy Carter2001--2004dal-nyj6491204.7%2.2%7.16.2181.8%5.3%5.93.5
137Ryan Fitzpatrick2005--2011ram-cin-buf10936226.2%2.4%7.26.2342.9%4.5%5.93.9
138Neil O'Donnell1991--2003pit-nyj-cin-oti23399725%2%76.2582.5%2.3%6.35.4
139James Harris1969--1979buf-ram-sdg8479445.8%4.2%86.2341.8%6.6%63.1
140Brian Griese1998--2008den-mia-tam-chi19440535.2%2.8%7.46.2403.3%4.2%6.64.7
141Terry Bradshaw1970--1983pit318221257%4.3%86.2623%7.3%6.12.9
142Bill Munson1964--1979ram-det-sea-sdg-buf12940416.4%2.6%7.26.2582.8%5%6.13.9
143Steve Tensi1966--1970sdg-den5558158.5%4.4%86.1293.5%5.7%5.83.3
144Jeff Kemp1981--1991ram-sfo-sea-phi6403286.7%2.9%7.36.1261.9%5.5%6.33.8
145Ty Detmer1993--2001gnb-phi-sfo-cle-det6499184.9%2.5%7.16.1242.7%4.6%6.54.4
146Billy Wade1960--1966ram-chi11390346.1%3.5%7.66.1333.8%6.3%6.43.7
147Dave M. Brown1992--2000nyg-crd10304294.1%2.5%7.26.1421.9%4.2%5.84
148Mark Sanchez2009--2011nyj10364305.1%2%6.96.1222.9%5%6.24
149Joe Ferguson1973--1990buf-det-tam-clt30631836.4%3.1%7.46.11073%5.8%6.13.5
150Norm Snead1961--1976was-phi-min-nyg-sfo30797576.9%4.3%7.96.11143.5%6.7%6.73.7
151Dennis Shaw1970--1975buf-crd6347125.9%5.3%8.46.1342.8%8.1%6.52.9
152Vince Ferragamo1977--1986ram-buf-gnb12564357.1%3.7%7.66.1422.9%7.1%6.53.4
153Jake Plummer1997--2006crd-den30593744.7%2.5%7.16.1752.9%4.8%6.44.3
154Tommy Maddox1992--2005den-ram-nyg-pit8754275.9%3.2%7.46.1282.6%5.3%6.13.7
155Daryle Lamonica1963--1974buf-rai210821047.8%4.6%86.1373%7.3%62.8
156Kyle Orton2005--2011chi-den-kan14532364.5%1.9%6.86.1353%3.1%6.45
157Roman Gabriel1962--1977ram-phi29780875.7%2.6%7.16.1793.2%4%5.84.1
158Bob Lee1969--1980min-atl-ram5416605.9%4.8%8.16.1241.2%6.2%52.3
159David Carr2002--2010htx-car-nyg-sfo14433323.4%2.2%76.1612.7%3.4%6.24.7
160Jack Trudeau1986--1995clt-nyj-car10494253.2%2.4%7.16432.3%5.2%5.83.5
161Steve Fuller1979--1986kan-chi7454334%3.5%7.56291.9%4%6.24.5
162Danny White1976--1988dal242431245.8%4%7.76594%5.3%6.74.4
163Archie Manning1971--1984nor-oti-min23911374.4%3.2%7.461103.1%5.1%6.34.1
164Ken Stabler1970--1984rai-oti-nor305791106.6%4.6%7.96643%7.3%6.53.3
165Doug Williams1978--1989tam-was18108495.4%2.8%7.26453.1%4.8%6.54.4
166Joe Pisarcik1977--1984nyg-phi5552254.6%4.1%7.86322.1%5.7%5.73.1
167Jim McMahon1982--1996chi-sdg-phi-min-crd-gnb19260864.5%3.3%7.46402.6%3.8%6.44.8
168Milt Plum1960--1969cle-det-ram-nyg13335466.9%4.9%8.16403.1%6%6.33.7
169Ron Jaworski1974--1989ram-phi-mia-kan29859895.4%2.9%7.26793.4%4.8%6.54.4
170Rodney Peete1989--2004det-dal-phi-was-car16636554.3%3.4%7.56482.2%4.3%6.54.6
171Vinny Testaverde1987--2007tam-cle-rav-nyj-dal-nwe-car475531025.3%3.1%7.361373.3%4.5%6.74.7
172Billy Kilmer1961--1978sfo-nor-was21555886.7%3.7%7.56813.3%5.9%6.13.5
173Tim Couch1999--2003cle11131225.5%3.2%7.36402.7%4.3%64.1
174Erik Kramer1987--1999atl-det-chi-sdg16336384.9%2.4%76483.4%4.1%6.54.7
175Trent Dilfer1994--2007tam-rav-sea-cle-sfo21489685.3%2.7%7.16652%5.1%63.7
176Mike Pagel1982--1993clt-cle-ram9593224.5%2.6%7.16532.9%4.9%63.8
177Kordell Stewart1995--2005pit-chi-rav15490763.5%2.1%6.85.9542.7%5.6%5.53
178Chad Henne2008--2011mia7114143.6%1.7%6.65.9202.4%4.6%6.74.7
179Jim Hart1966--1984crd-was35156935.7%4%7.65.91032.9%5.5%6.23.8
180Vince Young2006--2011oti-phi9102354.5%3%7.15.9272.2%4.9%6.54.3
181Josh McCown2002--2011crd-det-rai-car-chi6998154.2%1.6%6.55.9362.9%5.2%6.23.9
182Mark Malone1981--1989pit-sdg-nyj10733296.3%3%7.15.8442.3%5.9%5.83.2
183Babe Parilli1960--1969rai-nwe-nyj18778647.1%4.1%7.55.8473.2%7.5%5.92.5
184Don Strock1974--1988mia-cle5913377.1%3.6%7.35.8304.5%7.3%6.63.3
185Dick Wood1962--1966sdg-nyj-rai-mia7153177.1%3.4%7.25.8282.6%7.3%5.32.1
186Shaun King1999--2004tam-crd5057195.9%2.3%6.75.8161.1%4.1%5.53.7
187Pat Haden1976--1981ram10024414.4%2.9%75.8263.1%7.1%6.43.3
188Bobby Douglass1969--1978chi-sdg-nor-gnb6493166.2%3.5%7.25.8572.1%5.8%5.12.5
189Cotton Davidson1960--1968kan-rai11451306.5%4.1%7.55.7402.9%7.2%6.33.1
190Steve Bono1985--1999min-pit-sfo-kan-gnb-ram-car10576494.6%1.8%6.45.7262.5%3.7%5.74.1
191Marc Wilson1980--1990rai-nwe14526395.8%4%7.45.7422.8%5.8%6.53.9
192Billy Joe Tolliver1989--1999sdg-atl-oti-kan-nor10760245%2.6%6.85.7533%4.1%6.14.4
193Rick Mirer1993--2003sea-chi-nyj-sfo-rai11969273.9%2.4%6.65.6521.8%4.4%5.53.5
194Steve Ramsey1970--1976nor-den6437235.4%5.9%8.15.6282.4%6.5%6.33.4
195Jacky Lee1960--1969oti-den-kan6191309%7%8.55.5294%6.9%6.63.6
196Hugh Millen1987--1995ram-atl-nwe-den644082.3%4.2%7.45.5302.4%3.6%6.85.2
197Jim Ninowski1960--1969det-cle-was-nor6953334.3%4.5%7.55.5272.6%7.4%6.22.9
198Dave Wilson1981--1988nor7007164.2%5.2%7.85.5373.1%5.5%6.23.8
199Kyle Boller2003--2011rav-ram-rai8931304.1%1.7%6.25.5362.6%4.7%5.73.6
200Joey Harrington2002--2007det-mia-atl14693274.4%2.2%6.45.5552.5%3.8%5.53.9
201Todd Blackledge1983--1989kan-pit5366225.2%3.4%6.95.5221.7%5.2%5.32.9
202Mike Tomczak1985--1999chi-gnb-cle-pit16963793.8%3.9%7.15.5593.4%5.3%6.64.2
203Mike Livingston1968--1979kan11295374.4%3.2%6.85.5522.4%5.7%6.23.7
204Danny Kanell1996--2003nyg-atl-den5328145.3%2.5%6.55.5252.2%4%4.93.2
205Steve Dils1980--1988min-ram-atl5816183.5%2.6%6.55.4292.4%3.6%5.74.1
206Jack Thompson1979--1984cin-tam5329155.3%1.8%6.15.4303.5%6.2%6.33.6
207Kent Graham1992--2001nyg-crd-pit-was7801274.4%1.6%65.4331.8%3.1%5.74.3
208David Woodley1980--1985mia-pit9203384.4%3.5%6.95.4243%7.4%6.33.1
209Randy Johnson1966--1976atl-nyg-was-gnb8329147.8%4.4%7.25.4583.2%7.6%6.33
210Rex Grossman2003--2011chi-htx-was11015304.7%3.3%6.85.4272.3%4.3%6.24.3
211Jim Miller1995--2002pit-chi6410203.9%2.9%6.65.3183%3.2%5.64.3
212Dan Pastorini1971--1983oti-rai-ram-phi19469624.6%4.2%7.15.3812.5%6.1%5.42.7
213Paul McDonald1980--1984cle5550123.8%3.4%6.85.3232.8%5.1%74.7
214George Blanda1960--1975oti-rai220291428.4%6%7.85.3793.9%8%6.12.5
215Jack Kemp1960--1969sdg-buf22256714.6%5.2%7.55.2462.2%7.1%6.23
216David Whitehurst1977--1983gnb6205216.1%5.3%7.45.1301.1%5.4%5.73.3
217Zeke Bratkowski1960--1971chi-ram-gnb8005304.7%5.5%7.55.1453.5%8.9%6.62.7
218Steve Spurrier1967--1976sfo-tam6878486.4%4.9%7.15.1532.2%5.2%5.43.1
219Joe Kapp1967--1970min-nwe6746266.6%6.2%7.75.1262.2%8.1%5.72.1
220Bob Avellini1975--1984chi7288304.2%5.9%7.55362.3%6.8%5.72.7
221Frank Tripucka1960--1963den7676135.1%5.9%7.55293.3%6.7%5.22.3
222Pete Beathard1964--1973kan-oti-crd-ram8544404.5%5.3%7.24.9342.5%7.3%5.62.4
223Gary Cuozzo1963--1972clt-nor-min-crd7688474.6%3.9%6.54.9352.9%5.7%63.5
224Al Dorow1960--1962nyj-buf5732145.7%5%6.94.8184.7%8.5%5.82.1
225Steve Walsh1989--1999dal-nor-chi-ram-tam-clt8248273.9%3.2%6.24.8342.4%4.5%5.93.9
226Mike Phipps1970--1981cle-chi10806504.5%3.7%6.44.8511.7%8.4%5.31.6
227Scott Brunner1980--1985nyg-crd6843163.7%3.7%6.34.7293%5.8%6.23.6
228Jack Concannon1964--1975phi-chi-gnb-det6270274.6%4.3%6.54.6322.5%6.8%5.12.1
229Mike Taliaferro1964--1972nyj-nwe-buf5241198.2%4.7%6.34.4412.2%7.2%5.11.9

[continue reading…]

References

References
1 Unfortunately, I excluded sack data from this study due to its general unavailability for most of the covered time period.
{ 0 comments }

Yesterday, I explained the methodology behind the formula involved in ranking every quarterback season in football history. Today, I’m going to present the career results. Converting season value to career value isn’t as simple as it might seem. Generally, we don’t want a player who was very good for 12 years to rank ahead of a quarterback who was elite for ten. Additionally, we don’t want to give significant penalties to players who struggled as rookies or hung around too long; we’re mostly concerned with the peak value of the player.

What I’ve historically done — and done here — is to give each quarterback 100% of his value or score from his best season, 95% of his score in his second best season, 90% of his score in his third best season, and so on. This rewards quarterbacks who played really well for a long time and doesn’t kill players with really poor rookie years or seasons late in their career. It also helps to prevent the quarterbacks who were compilers from dominating the top of the list. The table below shows the top 150 regular season QBs in NFL history using that formula, along with the first and last years of their careers, their number of career attempts (including sacks and rushing touchdowns), and their career records and winning percentages (each since 1950). For visibility reasons, I’ve shown the top 30 quarterbacks below, but you can change that number in the filter or click on the right arrow to see the remaining quarterbacks.
[continue reading…]

{ 21 comments }

In 2006, I took a stab at ranking every quarterback in NFL history. Two years later, I acquired more data and made enough improvements to merit publishing an updated and more accurate list of the best quarterbacks the league has ever seen. In 2009, I tweaked the formula again, and published a set of career rankings, along with a set of strength of schedule, era and weather adjustments, and finally career rankings which include those adjustments and playoff performances.

If nothing else, that was three years ago, so the series was due for an update. I’ve also acquired more data, enabling me to tweak the formula to better reflect player performance. But let’s start today with an explanation of the methodology I’m using. To rank a group of players, you need to decide which metric you’re ordering the list by. I’ll get to all of the criteria I’m not using in a little bit, but the formula does use each of the following: pass attempts, passing touchdowns, passing yards, interceptions, sacks, sack yards lost, fumbles, fumbles recovered, rush attempts, rushing yards and rushing touchdowns. Most importantly, the formula is adjusted for era and league.

Two of the best quarterbacks ever.

So where do we begin? We start with plain old yards per attempt. I then incorporate sack data by removing sack yards from the numerator and adding sacks to the denominator [1]I have individual sack data for every quarterback since 1969. For seasons before then, I have team sack data going back to 1949. For seasons before 1950, I ignored sacks; for seasons between 1950 … Continue reading. To include touchdowns and pass attempts, I gave a quarterback 20 yards for each passing touchdown and subtracted 45 yards for each interception. This calculation — (Pass Yards + 20 * PTD – 45 * INT – Sack Yards Lost) / (Sacks + Pass Attempts) forms the basis for Adjusted Net Yards per Attempt, one of the key metrics I use to evaluate quarterbacks.

For purposes of this study, I did some further tweaking. I’m including rushing touchdowns, because our goal is to measure quarterbacks as players. There’s no reason to separate rushing and passing touchdowns from a value standpoint, so all passing and rushing touchdowns are worth 20 yards and are calculated in the numerator of Adjusted Net Yards per Attempt. To be consistent, I also include rushing touchdowns in the denominator of the equation. This won’t change anything for most quarterbacks, but feels right to me. A touchdown is a touchdown.
[continue reading…]

References

References
1 I have individual sack data for every quarterback since 1969. For seasons before then, I have team sack data going back to 1949. For seasons before 1950, I ignored sacks; for seasons between 1950 and 1969, I gave each quarterback an approximate number of sacks, giving him the pro-rated portion of sacks allowed by the percentage of pass attempts he threw for the team. While imperfect, I thought this “fix” to be better than to ignore the data completely, especially for years where one quarterback was responsible for the vast majority of his team’s pass attempts.
{ 13 comments }

Quarterback wins over Pythagoras

No, this article isn’t an article about quarterbacks squaring off against ancient Greek mathematicians. Today, we’re going to look at quarterback win-loss records and see how they compare to their Pythagorean win-loss records.

Over 30 years ago, Bill James wrote that, on average, baseball teams’ true strengths could be measured more accurately by looking at runs scored and runs allowed than by looking at wins and losses. Since then, sports statisticians have applied the same thinking to all sports. The formula to calculate a team’s Pythagorean winning percentage is always some variation of:

(Points Scored^2) / (Points Scored ^2 + Points Allowed^2)

With the exponent changing from 2 to whatever number best fits the data for the particular sport. In football, that number is 2.53. We can look, for example, at the Pythagorean records for each team in the league last season, and line it up against their actual record:

YearTmRecordWin%PFPAPyth WinsDiff
2011KAN7-90.4382123383.763.24
2011GNB15-10.93856035912.082.92
2011DEN8-80.5003093905.712.29
2011OAK8-80.5003594336.141.86
2011NWE13-30.81351334211.781.22
2011NYG9-70.5633944007.851.15
2011ARI8-80.5003123486.91.1
2011TAM4-120.2502874943.230.77
2011TEN9-70.5633253178.250.75
2011NOR13-30.81354733912.330.67
2011BAL12-40.75037826611.340.66
2011ATL10-60.6254023509.390.61
2011SFO13-30.81338022912.520.48
2011CIN9-70.5633443238.640.36
2011PIT12-40.75032522711.40.6
2011MIA6-100.3753293138.5-2.5
2011MIN3-130.1883404495.3-2.3
2011PHI8-80.5003963289.87-1.87
2011CAR6-100.3754064297.44-1.44
2011SEA7-90.4383213158.19-1.19
2011IND2-140.1252434303.05-1.05
2011HOU10-60.62538127811.03-1.03
2011SDG8-80.5004063778.75-0.75
2011CLE4-120.2502183074.74-0.74
2011WAS5-110.3132883675.62-0.62
2011DAL8-80.5003693478.62-0.62
2011BUF6-100.3753724346.46-0.46
2011NYJ8-80.5003773638.38-0.38
2011CHI8-80.5003533418.35-0.35
2011STL2-140.1251934072.1-0.1
2011JAX5-110.3132433295.08-0.08
2011DET10-60.62547438710.01-0.01

[continue reading…]

{ 2 comments }