by Chase Stuart
on April 2, 2016
Yesterday, I measured the age of each team’s passing attack by calculating the yards-weighted age of each player who gained either a passing or receiving yard. Today, the historical results.
I’ve written a bit about Terry Bradshaw and his terrible rookie season of 1970, mostly in the context of number one picks taking a long time to break out. But here’s something that often gets lost in the mix: Bradshaw was just one of many inexperienced players on the ‘70 Steelers.
Bradshaw played as a rookie that year at age 22 (Terry Hanratty also started 6 games, and was also 22). The top 6 players in receiving yards on the ’70 Steelers were wide receiver Ron Shanklin (age 22), wide receiver Dave Smith (23), tight end Dennis Hughes (22), fullback John Fuqua (24), wide receiver Hubie Bryant (22), and wide receiver Jon Staggers (22). Incredibly, five of those six players were rookies, with Frenchy Fuqua being the sole exception — and he was drafted in 1969! In the ’70 draft, Pittsburgh took Bradshaw with the 1st overall pick, drafted Shanklin at 28, Staggers in the 5th round, and Smith in the 8th round, while both Hughes and Bryant were undrafted free agents that year. That’s unbelievable, and makes the ’70s Steelers passing attack akin to an expansion team — or rather, an expansion team with almost no access to the veteran market. As a result, Pittsburgh’s 1970 passing attack ranks as the youngest in history: [continue reading…]
Tagged as:
Terry Bradshaw
{ }
by Chase Stuart
on January 9, 2015

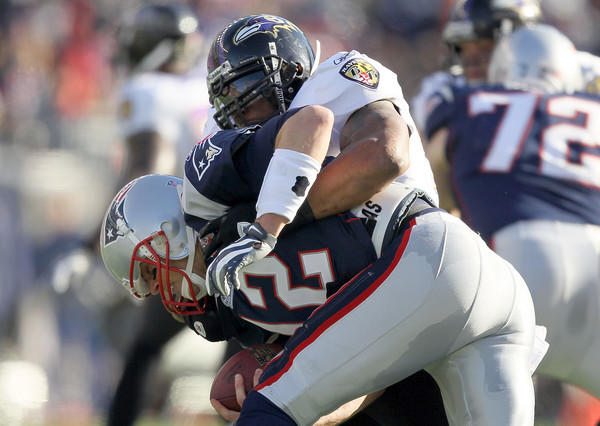
Tom Brady has been known to wear Suggs
Disclaimer: Quarterbacks don’t have records, teams do. A quarterback’s “record” is simply shorthand for saying “the record of a quarterback’s teams in all playoff games started by that quarterback.” Please forgive me for using that shorthand for the remainder of this post.
Eight years ago, Doug Drinen wrote a fun post in advance of the 2006 AFC Championship Game. At the time, Peyton Manning had gone 0-2 in playoff games against Tom Brady, so Doug looked at quarterbacks who had gone winless against another particular quarterback in the postseason.
Manning wound up beating Brady in that game, and evened his record against Brady in the 2013 playoffs. No pair of quarterbacks have ever met as starters five times in the playoffs, so Brady/Manning are tied for the most playoff meetings. Joining them on Saturday will be Brady and Joe Flacco. This weekend’s game will be the fourth time since 2009 that the Ravens have traveled to Foxboro in the postseason, and Brady and Flacco have been under center for each game. [continue reading…]
Tagged as:
Brett Favre,
Joe Flacco,
Ken Stabler,
Peyton Manning,
Steve Young,
Terry Bradshaw,
Tom Brady
{ }
by Chase Stuart
on March 5, 2014
Terry Bradshaw finished his career with 212 touchdowns, 210 interceptions and a 70.9 passer rating. Kurt Warner threw 208 touchdowns against only 128 interceptions, and his 93.7 passer rating ranks 8th in NFL history and 2nd among retired players. But Bradshaw played from 1970 to 1982, while Warner played from 1998 to 2009. As a result, comparing their raw statistics holds very little meaning. Comparing across eras is very challenging, but not impossible. And in this case, once you place the numbers in the proper context, Bradshaw’s numbers were arguably more impressive than Warner’s numbers.
Let’s start with Bradshaw and begin by looking at his Relative ANY/A for each year of his career. For new readers, ANY/A stands for Adjusted Net Yards per Attempt, defined as
(Gross Pass Yards + 20 * PTDs – 45 * INTs – Sack Yds)/(Attempts + Sacks)
Relative ANY/A simply compares a quarterback’s ANY/A average to league average, a necessary element when comparing quarterbacks across eras. In the graph below, the size of the bubble corresponds to how many attempts Bradshaw had in each season, while the Y-Axis shows Bradshaw’s Relative ANY/A (by definition, 0 is equal to league average). The graph shows a clear story: for the first five years of his career, Bradshaw was a below-average quarterback, but over the rest of his career, he was one of the best in football. His best year came in 1978 when Bradshaw finished with a RANY/A of +2.0, which was the third best mark in football (only a hair behind Roger Staubach and Dan Fouts). Those stats, combined with a 14-2 record, led to Bradshaw being named the AP’s MVP that season. [continue reading…]
Tagged as:
Kurt Warner,
Terry Bradshaw
{ }
by Chase Stuart
on July 18, 2012
No, this article isn’t an article about quarterbacks squaring off against ancient Greek mathematicians. Today, we’re going to look at quarterback win-loss records and see how they compare to their Pythagorean win-loss records.
Over 30 years ago, Bill James wrote that, on average, baseball teams’ true strengths could be measured more accurately by looking at runs scored and runs allowed than by looking at wins and losses. Since then, sports statisticians have applied the same thinking to all sports. The formula to calculate a team’s Pythagorean winning percentage is always some variation of:
(Points Scored^2) / (Points Scored ^2 + Points Allowed^2)
With the exponent changing from 2 to whatever number best fits the data for the particular sport. In football, that number is 2.53. We can look, for example, at the Pythagorean records for each team in the league last season, and line it up against their actual record:
| Year | Tm | Record | Win% | PF | PA | Pyth Wins | Diff |
| 2011 | KAN | 7-9 | 0.438 | 212 | 338 | 3.76 | 3.24 |
| 2011 | GNB | 15-1 | 0.938 | 560 | 359 | 12.08 | 2.92 |
| 2011 | DEN | 8-8 | 0.500 | 309 | 390 | 5.71 | 2.29 |
| 2011 | OAK | 8-8 | 0.500 | 359 | 433 | 6.14 | 1.86 |
| 2011 | NWE | 13-3 | 0.813 | 513 | 342 | 11.78 | 1.22 |
| 2011 | NYG | 9-7 | 0.563 | 394 | 400 | 7.85 | 1.15 |
| 2011 | ARI | 8-8 | 0.500 | 312 | 348 | 6.9 | 1.1 |
| 2011 | TAM | 4-12 | 0.250 | 287 | 494 | 3.23 | 0.77 |
| 2011 | TEN | 9-7 | 0.563 | 325 | 317 | 8.25 | 0.75 |
| 2011 | NOR | 13-3 | 0.813 | 547 | 339 | 12.33 | 0.67 |
| 2011 | BAL | 12-4 | 0.750 | 378 | 266 | 11.34 | 0.66 |
| 2011 | ATL | 10-6 | 0.625 | 402 | 350 | 9.39 | 0.61 |
| 2011 | SFO | 13-3 | 0.813 | 380 | 229 | 12.52 | 0.48 |
| 2011 | CIN | 9-7 | 0.563 | 344 | 323 | 8.64 | 0.36 |
| 2011 | PIT | 12-4 | 0.750 | 325 | 227 | 11.4 | 0.6 |
| 2011 | MIA | 6-10 | 0.375 | 329 | 313 | 8.5 | -2.5 |
| 2011 | MIN | 3-13 | 0.188 | 340 | 449 | 5.3 | -2.3 |
| 2011 | PHI | 8-8 | 0.500 | 396 | 328 | 9.87 | -1.87 |
| 2011 | CAR | 6-10 | 0.375 | 406 | 429 | 7.44 | -1.44 |
| 2011 | SEA | 7-9 | 0.438 | 321 | 315 | 8.19 | -1.19 |
| 2011 | IND | 2-14 | 0.125 | 243 | 430 | 3.05 | -1.05 |
| 2011 | HOU | 10-6 | 0.625 | 381 | 278 | 11.03 | -1.03 |
| 2011 | SDG | 8-8 | 0.500 | 406 | 377 | 8.75 | -0.75 |
| 2011 | CLE | 4-12 | 0.250 | 218 | 307 | 4.74 | -0.74 |
| 2011 | WAS | 5-11 | 0.313 | 288 | 367 | 5.62 | -0.62 |
| 2011 | DAL | 8-8 | 0.500 | 369 | 347 | 8.62 | -0.62 |
| 2011 | BUF | 6-10 | 0.375 | 372 | 434 | 6.46 | -0.46 |
| 2011 | NYJ | 8-8 | 0.500 | 377 | 363 | 8.38 | -0.38 |
| 2011 | CHI | 8-8 | 0.500 | 353 | 341 | 8.35 | -0.35 |
| 2011 | STL | 2-14 | 0.125 | 193 | 407 | 2.1 | -0.1 |
| 2011 | JAX | 5-11 | 0.313 | 243 | 329 | 5.08 | -0.08 |
| 2011 | DET | 10-6 | 0.625 | 474 | 387 | 10.01 | -0.01 |
[continue reading…]
Tagged as:
Bart Starr,
Dan Marino,
Eli Manning,
Jake Plummer,
Peyton Manning,
Pythagorean,
Steve Young,
Terry Bradshaw,
Tom Brady,
Troy Aikman
{ }