by Chase Stuart
on May 19, 2015
Brad Oremland is a longtime commenter and a fellow football historian. Brad is also a senior NFL writer at Sports Central. There are few who have given as much thought to the history of quarterbacks and quarterback ranking systems as Brad has over the years. You may recall that in April, he gave us a sneak peak at some quarterback rankings. Today, we begin seeing the words behind those numbers, starting with the pre-modern era quarterbacks.
Part I: Pre-Modern Era
Part II: 49-101
Part III: 40-48
Part IV: 31-39
Part V: 21-30
Part VI: 11-20
Part VII: 6-10
Part VIII: 1-5
I’ve been studying NFL history throughout my adult life. It’s a journey that began the first time I watched my dad’s copy of NFL’s Greatest Hits on VHS, accelerating when I read Total Football II, and continuing when I began sportswriting over a decade ago.
Something I’ve never done is to publish my list of the greatest quarterbacks in NFL history. Sparked by Adam Steele’s crowd-sourcing project here at Football Perspective, I’m finally stepping into the ring. But because I’ve done so much research over the years, this is not a simple list. Instead, I’ll present my choices as a series of articles, highlighting about 10 players per list, and counting down to number one. [continue reading…]
Tagged as:
Brad Oremland,
GQBOAT,
Guest Posts
{ }
by Chase Stuart
on April 21, 2015
Bryan Frye, owner and operator of the great site www.thegridfe.com/, is back for another guest post. You can also view all of Bryan’s guest posts at Football Perspective at this link, and follow him on twitter @LaverneusDingle.
I spent a few weeks this offseason parsing out quarterback spike and kneel numbers from post-2002 play by play data. Chase published the findings, which I believe are a useful resource when trying to assess a QB’s stats. Since I have the data available, I thought it would be good to use it.
Regular readers know Chase uses Adjusted Net Yards per pass Attempt as the primary stat for measuring quarterback performance. I am going to do something similar, but I am going to incorporate rushing contribution as well. This is something Chase talked about doing awhile ago, but we didn’t have the kneel or spike data available. I’ll call the end product Total Adjusted Yards per Play (TAY/P). The formula, for those curious:
[Yards + Touchdowns*20 – Interceptions*45 – Fumbles*25 + First Downs*9] / Plays, where
Yards = pass yards + rush yards – sack yards + yards lost on kneels
Touchdowns = pass touchdowns + rush touchdowns
First Downs = (pass first downs + rush first downs) – touchdowns
Plays = pass attempts + sacks + rush attempts – spikes – kneels [continue reading…]
Tagged as:
Bryan Frye,
GQBOAT,
Guest Posts
{ }
by Chase Stuart
on June 13, 2014

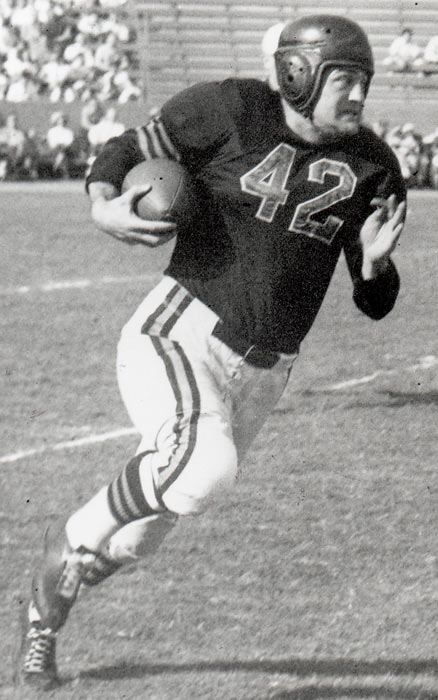
One of the two greatest quarterbacks of the first half of the 20th century.
The comments to Parts I and II of this series have been great, so let me start with a thank you. One of the more difficult parts of this process is comparing players across eras not just for efficiency, but for gross volume. In 2013, teams averaged 38.0 pass attempts (including sacks) per game, compared to just 24.5 in 1956. A great quarterback will be above average in either era, but it’s easier for great quarterbacks to accumulate above-average value when they play in a high-dropback era.
So what’s the solution? Simply pro-rating the numbers feels a bit too dramatic; we got into a similar issue with True Receiving Yards, and our solution there was to take a (literal) middle ground approach. I thought it would be fun to apply the same philosophy here. Over the course of the 96 league seasons in this study, the average number of league-wide dropbacks per game was 26.1. If we were going to do a 1:1 adjustment, we would then multiply each quarterback’s value in 2013 by 0.687, since that’s the result of 26.1 divided by 38. Instead, I decided to split the baby, and take the average of 0.687 and 1.000, which means modifying the VALUE metric for each quarterback in 2013 by 84.4%. On the other hand, a quarterback in 1956 now gets his VALUE multiplied by 103%, and a passer in 1937 sees his score multiplied by 129.0%.
The table below shows the revised single-season leader list. Here’s how to read it, which will explain why Dan Marino climbs back ahead of Tom Brady into the top spot on the list. Under the old system, Marino had a value of 2,267 yards above average, but with the modifier, he gets downgraded to an adjusted value of 1981; of course, Brady’s modifier is more severe, which is why Marino vaults him. Meanwhile, thanks to a 110.3% modifier, Sid Luckman’s 1943 season jumps ahead of Peyton Manning’s 2004 season, which has a modifier of 88.1%. The table below shows the top 200 single seasons using this formula. [continue reading…]
Tagged as:
GQBOAT
{ }
by Chase Stuart
on June 10, 2014

The two best regular season quarterbacks of all time?
, I explained the methodology behind the formula involved in ranking every quarterback season since 1960. Today, I’m going to present the career results. Converting season value to career value isn’t as simple as it might seem. Generally, we don’t want a player who was very good for 12 years to rank ahead of a quarterback who was elite for ten. Additionally, we don’t want to give significant penalties to players who struggled as rookies or hung around too long; we’re mostly concerned with the peak value of the player.
What I’ve historically done — and done here — is to give each quarterback 100% of his value or score from his best season, 95% of his score in his second best season, 90% of his score in his third best season, and so on. This rewards quarterbacks who played really well for a long time and doesn’t kill players with really poor rookie years or seasons late in their career. It also helps to prevent the quarterbacks who were compilers from dominating the top of the list. For visibility reasons, the table below displays only the top 25 quarterbacks initially, but you can change that number in the filter or click on the right arrow to see the remaining quarterbacks.
Here’s how to read the table. Manning’s first year was in 1998, and his last in 2013. He’s had 8,740 “dropbacks” in his career, which include pass attempts, sacks, and rushing touchdowns. His career value — using the 100/95/90 formula is 12,769, putting him at number one. His strength of schedule has been perfectly average over his career; as a reminder, the SOS column is shown just for reference, as SOS is already incorporated into these numbers (so while Tom Brady has had a schedule that’s 0.25 ANY/A tougher than average, that’s already incorporated into his 10,063 grade). Manning is not yet eligible for the Hall of Fame, of course, but I’ve listed the HOF status of each quarterback in the table. Note that I only have quarterback records going back to 1960; therefore, for quarterbacks who played before and during (or after) 1960, only their post-1960 record is displayed. In addition, SOS adjustments are only for the years beginning in 1960. [continue reading…]
Tagged as:
GQBOAT
{ }
by Chase Stuart
on June 9, 2014

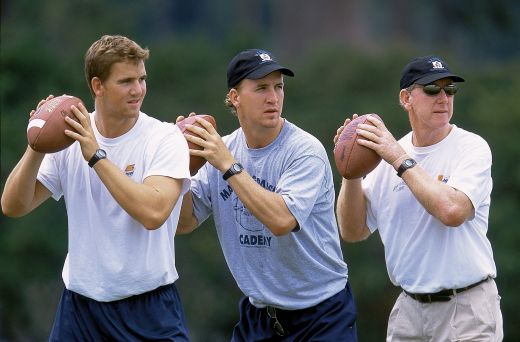
Can you spot the GOAT?
In 2006, I took a stab at ranking every quarterback in NFL history. Two years later, I acquired more data and made enough improvements to merit publishing an updated and more accurate list of the best quarterbacks the league has ever seen. In 2009, I tweaked the formula again, and published a set of career rankings, along with a set of strength of schedule, era and weather adjustments, and finally career rankings which include those adjustments and playoff performances. And two years ago, I revised the formula and produced a new set of career rankings.
This time around, I’m not going to tweak the formula much (that’s for GQBOAT VI), but I do have one big change that I suspect will be well-received. Let’s review the methodology.
Methodology
We start with plain old yards per attempt. I then incorporate sack data by removing sack yards from the numerator and adding sacks to the denominator. To include touchdowns and interceptions, I gave a quarterback 20 yards for each passing touchdown and subtracted 45 yards for each interception. This calculation — (Pass Yards + 20 * PTD – 45 * INT – Sack Yards Lost) / (Sacks + Pass Attempts) forms the basis for Adjusted Net Yards per Attempt, one of the key metrics I use to evaluate quarterbacks. For purposes of this study, I did some further tweaking. I’m including rushing touchdowns, because our goal is to measure quarterbacks as players. There’s no reason to separate rushing and passing touchdowns from a value standpoint, so all passing and rushing touchdowns are worth 20 yards and are calculated in the numerator of Adjusted Net Yards per Attempt. To be consistent, I also include rushing touchdowns in the denominator of the equation. This won’t change anything for most quarterbacks, but feels right to me. A touchdown is a touchdown.
Now, here comes the twist. In past year, I’ve compared each quarterback’s “ANY/A” — I put that term in quotes because what we’re really using is ANY/A with a rushing touchdowns modifier — and then calculated a value over average statistic after comparing that rate to the league average. For example, if a QB has an “ANY/A” of 7.0 and the NFL average “ANY/A” is 5.0, and the quarterback has 500 “dropbacks” — i.e., pass attempts plus sacks plus rushing touchdowns — then the quarterback gets credit for 1,000 yards above average. [continue reading…]
Tagged as:
GQBOAT
{ }
by Chase Stuart
on August 31, 2012

The original standard for postseason success.
On Wednesday, I explained the
methodology for grading each quarterback in each season. Yesterday, I came up with an
all-time career list of the best quarterbacks based on their regular season play. Today, a look at playoff performances.
Using the same formula, we can grade each quarterback in each game and adjust for era . However, it should be obvious that the sample sizes here are incredibly small, and the stats are even less likely to tell the true story when looking at just one game. Strength of schedule becomes a significant factor here, as well. But, caveats aside, there’s a lot we can do with playoff data. For example, we can rank every quarterback performance in Super Bowl history:
If you type Montana’s name into the search box, you can see that he has the 1st, 4th, 11th and 27th best performance in Super Bowl history. The best performance in a losing effort goes to
Jake Delhomme, who shredded the Patriots secondary in the second half of Super Bowl XXXVIII (he began the game 1 for 9 for 1 yard). The worst performance in a winning effort, unsurprisingly, goes to
Ben Roethlisberger in Super Bowl XL, although
Joe Theismann against the Dolphins gets an honorable mention. Worst performance overall goes to
Kerry Collins, although
Craig Morton’s 4 interceptions and 39 yards on 15 attempts against his former team in Super Bowl XII could give Collins a run for his money.
What about best championship game performances in the pre-Super Bowl era?
[continue reading…]
Tagged as:
GQBOAT,
Joe Montana,
Kurt Warner,
Peyton Manning,
Playoffs,
Tom Brady
{ }
by Chase Stuart
on August 30, 2012
Yesterday, I explained the methodology behind the formula involved in ranking every quarterback season in football history. Today, I’m going to present the career results. Converting season value to career value isn’t as simple as it might seem. Generally, we don’t want a player who was very good for 12 years to rank ahead of a quarterback who was elite for ten. Additionally, we don’t want to give significant penalties to players who struggled as rookies or hung around too long; we’re mostly concerned with the peak value of the player.
What I’ve historically done — and done here — is to give each quarterback 100% of his value or score from his best season, 95% of his score in his second best season, 90% of his score in his third best season, and so on. This rewards quarterbacks who played really well for a long time and doesn’t kill players with really poor rookie years or seasons late in their career. It also helps to prevent the quarterbacks who were compilers from dominating the top of the list. The table below shows the top 150 regular season QBs in NFL history using that formula, along with the first and last years of their careers, their number of career attempts (including sacks and rushing touchdowns), and their career records and winning percentages (each since 1950). For visibility reasons, I’ve shown the top 30 quarterbacks below, but you can change that number in the filter or click on the right arrow to see the remaining quarterbacks.
[continue reading…]
Tagged as:
Brett Favre,
Dan Marino,
GQBOAT,
John Elway,
Johnny Unitas,
Peyton Manning,
quarterbacks,
Tom Brady
{ }
by Chase Stuart
on August 29, 2012
In 2006, I took a stab at ranking every quarterback in NFL history. Two years later, I acquired more data and made enough improvements to merit publishing an updated and more accurate list of the best quarterbacks the league has ever seen. In 2009, I tweaked the formula again, and published a set of career rankings, along with a set of strength of schedule, era and weather adjustments, and finally career rankings which include those adjustments and playoff performances.
If nothing else, that was three years ago, so the series was due for an update. I’ve also acquired more data, enabling me to tweak the formula to better reflect player performance. But let’s start today with an explanation of the methodology I’m using. To rank a group of players, you need to decide which metric you’re ordering the list by. I’ll get to all of the criteria I’m not using in a little bit, but the formula does use each of the following: pass attempts, passing touchdowns, passing yards, interceptions, sacks, sack yards lost, fumbles, fumbles recovered, rush attempts, rushing yards and rushing touchdowns. Most importantly, the formula is adjusted for era and league.
Two of the best quarterbacks ever.
So where do we begin? We start with plain old yards per attempt. I then incorporate sack data by removing sack yards from the numerator and adding sacks to the denominator . To include touchdowns and pass attempts, I gave a quarterback
20 yards for each passing touchdown and subtracted 45 yards for each interception. This calculation — (Pass Yards + 20 * PTD – 45 * INT – Sack Yards Lost) / (Sacks + Pass Attempts) forms the basis for Adjusted Net Yards per Attempt, one of the key metrics I use to evaluate quarterbacks.
For purposes of this study, I did some further tweaking. I’m including rushing touchdowns, because our goal is to measure quarterbacks as players. There’s no reason to separate rushing and passing touchdowns from a value standpoint, so all passing and rushing touchdowns are worth 20 yards and are calculated in the numerator of Adjusted Net Yards per Attempt. To be consistent, I also include rushing touchdowns in the denominator of the equation. This won’t change anything for most quarterbacks, but feels right to me. A touchdown is a touchdown.
[continue reading…]
Tagged as:
Aaron Rodgers,
Dan Marino,
Eli Manning,
GQBOAT,
Joe Montana,
Johnny Unitas,
Peyton Manning,
quarterbacks,
Steve Young,
Tom Brady
{ }