
How much did passing efficiency decline in 2019 compared to a record-setting 2018? That depends, a bit, on how you measure passing efficiency — in more ways than one.
In 2018, all NFL passers combined to average 6.32 Adjusted Net Yards per Attempt. In 2019, all NFL passers combined to average 6.16 ANY/A, a decline of 2.6%. However, there is another way to measure league average, and that’s by taking an average of the average ANY/A stats for each of the 32 teams.
In 2019, while “the NFL” as a whole had a 6.16 ANY/A average, an average of each of the ANY/A rates for the 32 teams comes to 6.19. If that is confusing to you, think of it this way: when we calculate “the league average” in passing stats, we are giving more weight to the Bucs, Panthers, and Falcons than to the Ravens, Titans, and Vikings. Collectively, those three NFC South teams were responsible for 11.0% of all passing plays in 2019; meanwhile, pass plays from Baltimore, Tennessee, and Minnesota account for only 7.7% of NFL passing plays.
When we think of league average, we almost always mean a weighted average that gives more weight to the teams that pass most frequently. But there’s at least an argument to be made that league average would be better defined by taking an average of the averages. And in this case, in 2019, it would mean a higher average: that’s because the wrong passers threw it more often in 2019.
Last year, the right passers threw it more often: an average of the ANY/A produced by each of the 32 teams was 6.29 (which was lower than the normal average of 6.32, since the weaker passing teams threw less frequently last year). By this measure, passing efficiency declined only 1.6% — from 6.29 to 6.19 — from 2018 to 2019, rather than by 2.6%.
Let’s look at each team in 2019. The X-Axis shows the number of dropbacks: the NFC South teams (other than the Saints) are on the far right, because they passed the most. The Y-Axis shows pass efficiency, as measured by ANY/A.
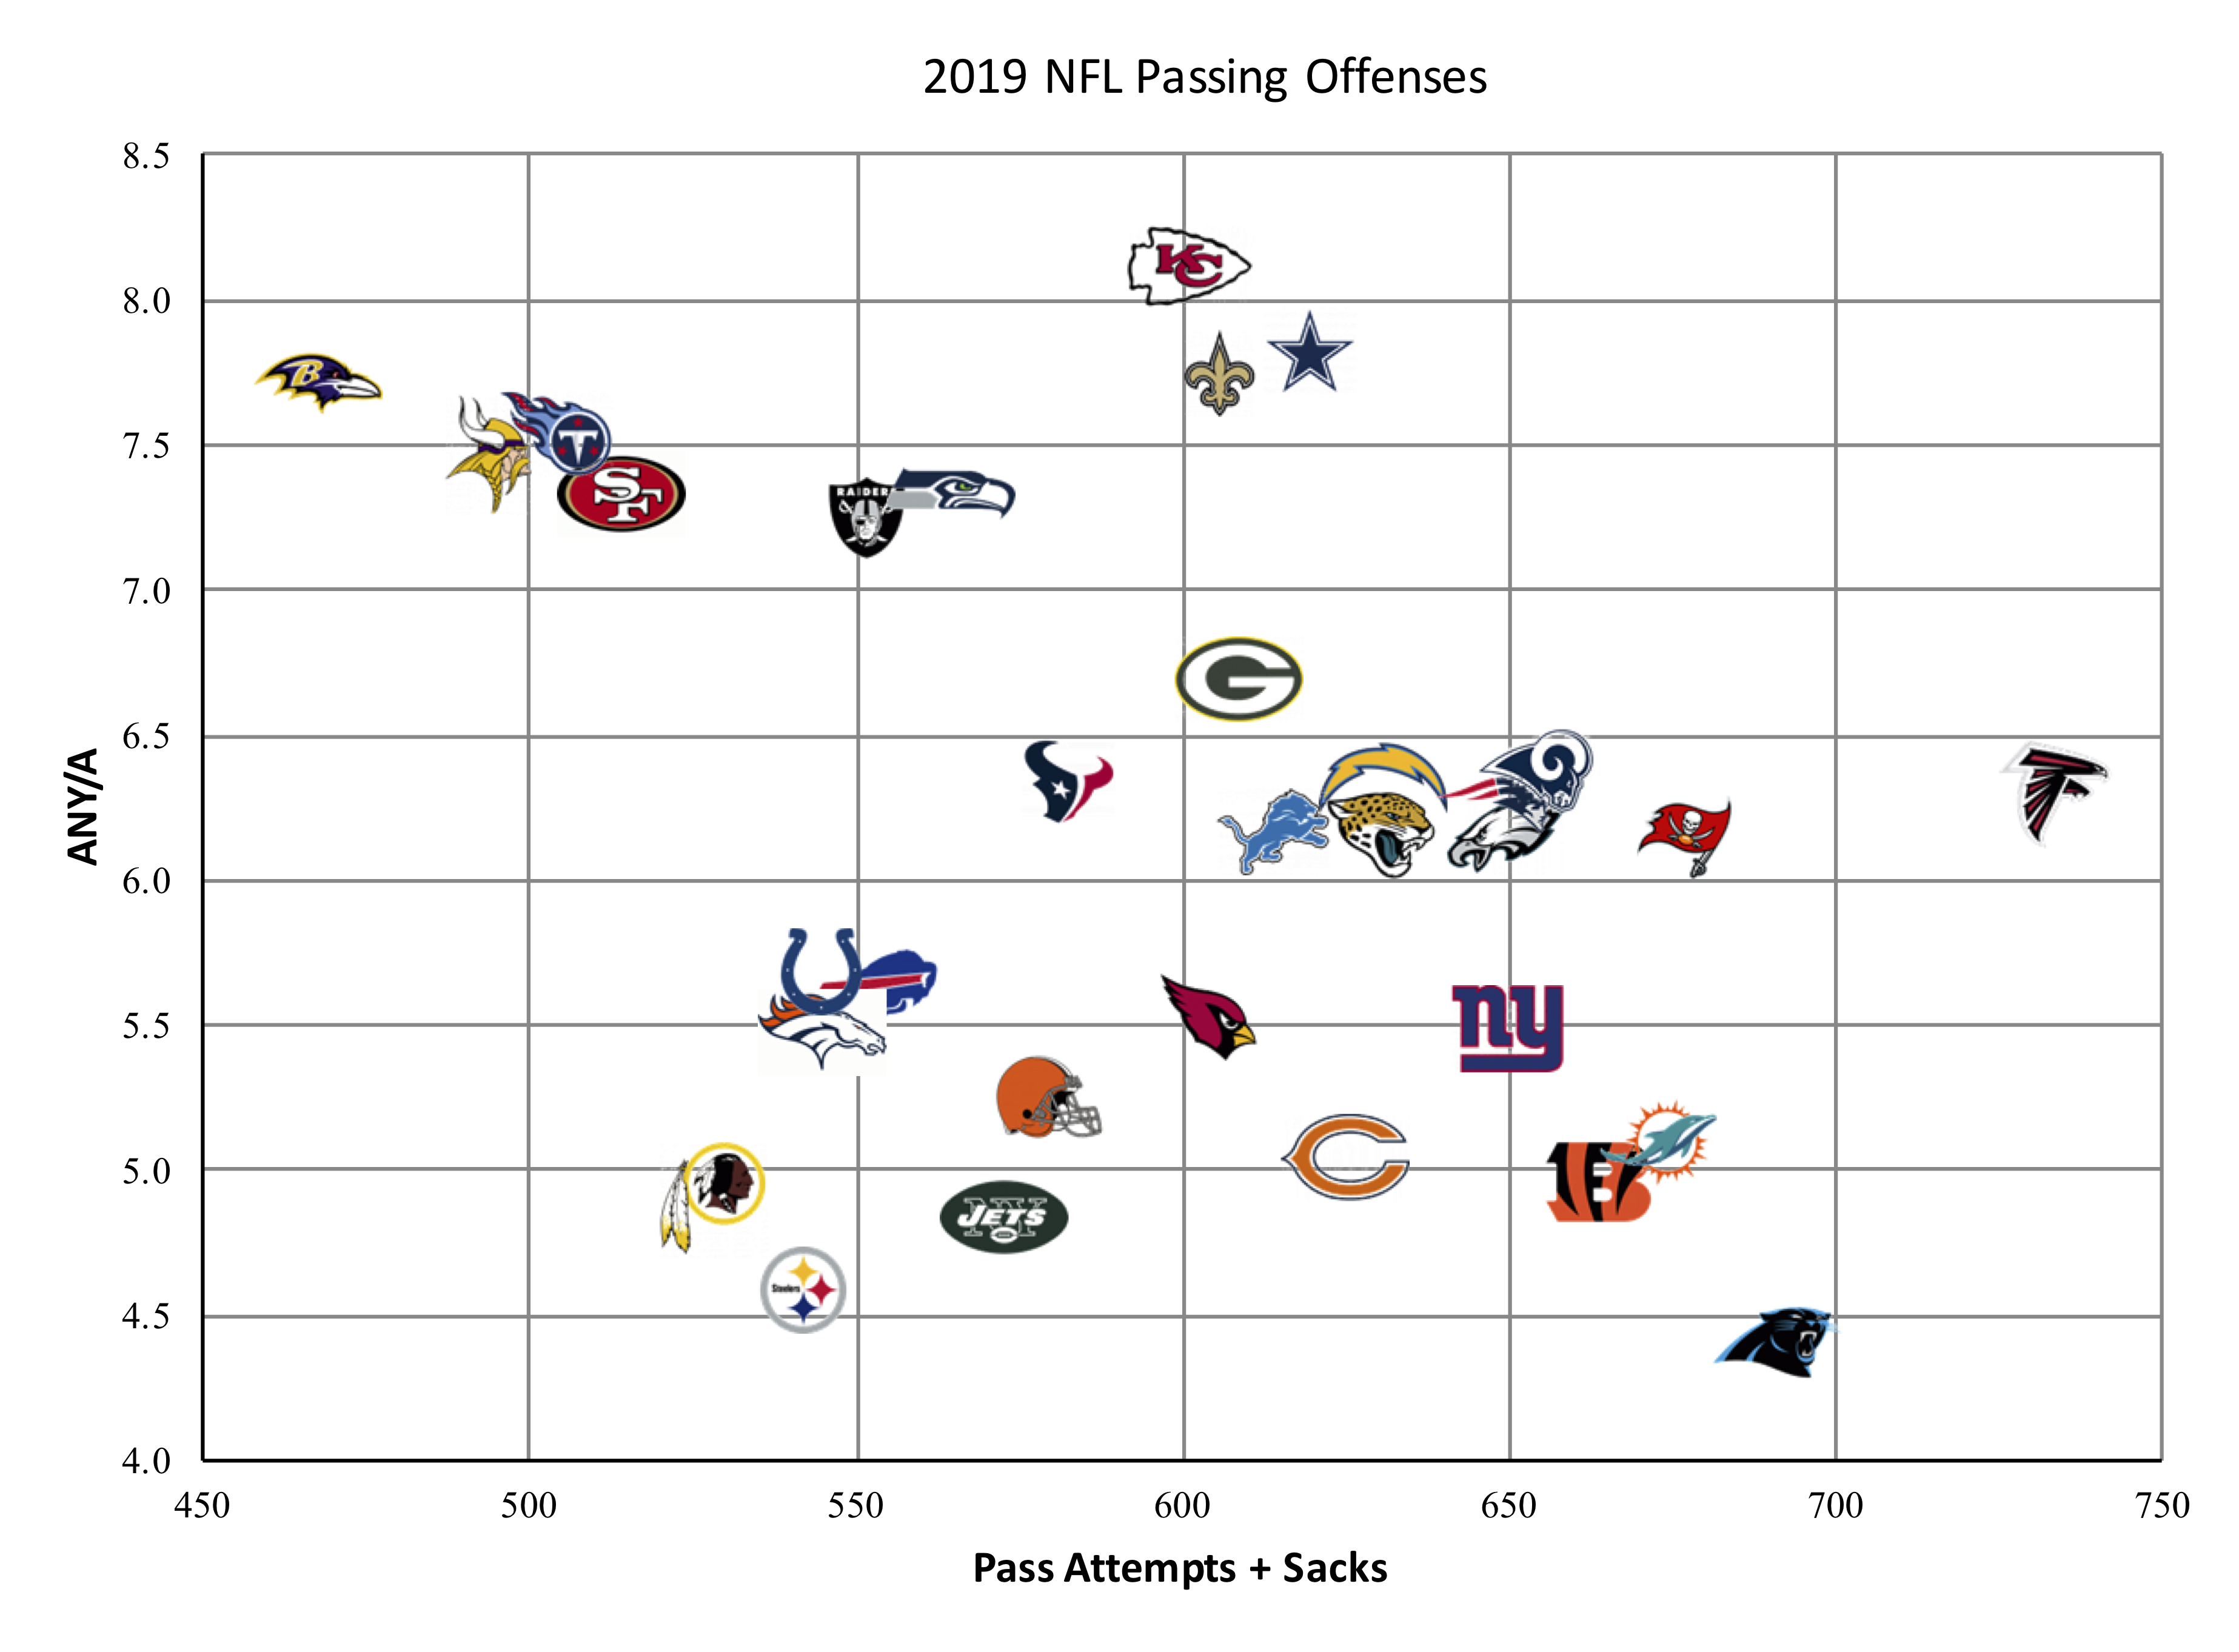
It’s pretty clear that the “wrong teams” passed most often in 2019; the chart has a slope that is down and to the right. This, of course, is why the “NFL ANY/A” was 6.16 but the “average of the ANY/A for the 32 teams” was 6.19; by giving the Ravens and Titans equal weight to the Bucs and Panthers, you raise the average.
You might think this is how things always are: after all, the whole point behind my Game Scripts work is that teams with the lead pass less often, and trailing teams pass more often. But of course we already discussed that last year, the reverse was true: the right teams passed more often. In fact, there isn’t much of a trend in recent years as to whether or not the better passing teams are more likely or less likely to pass more often.
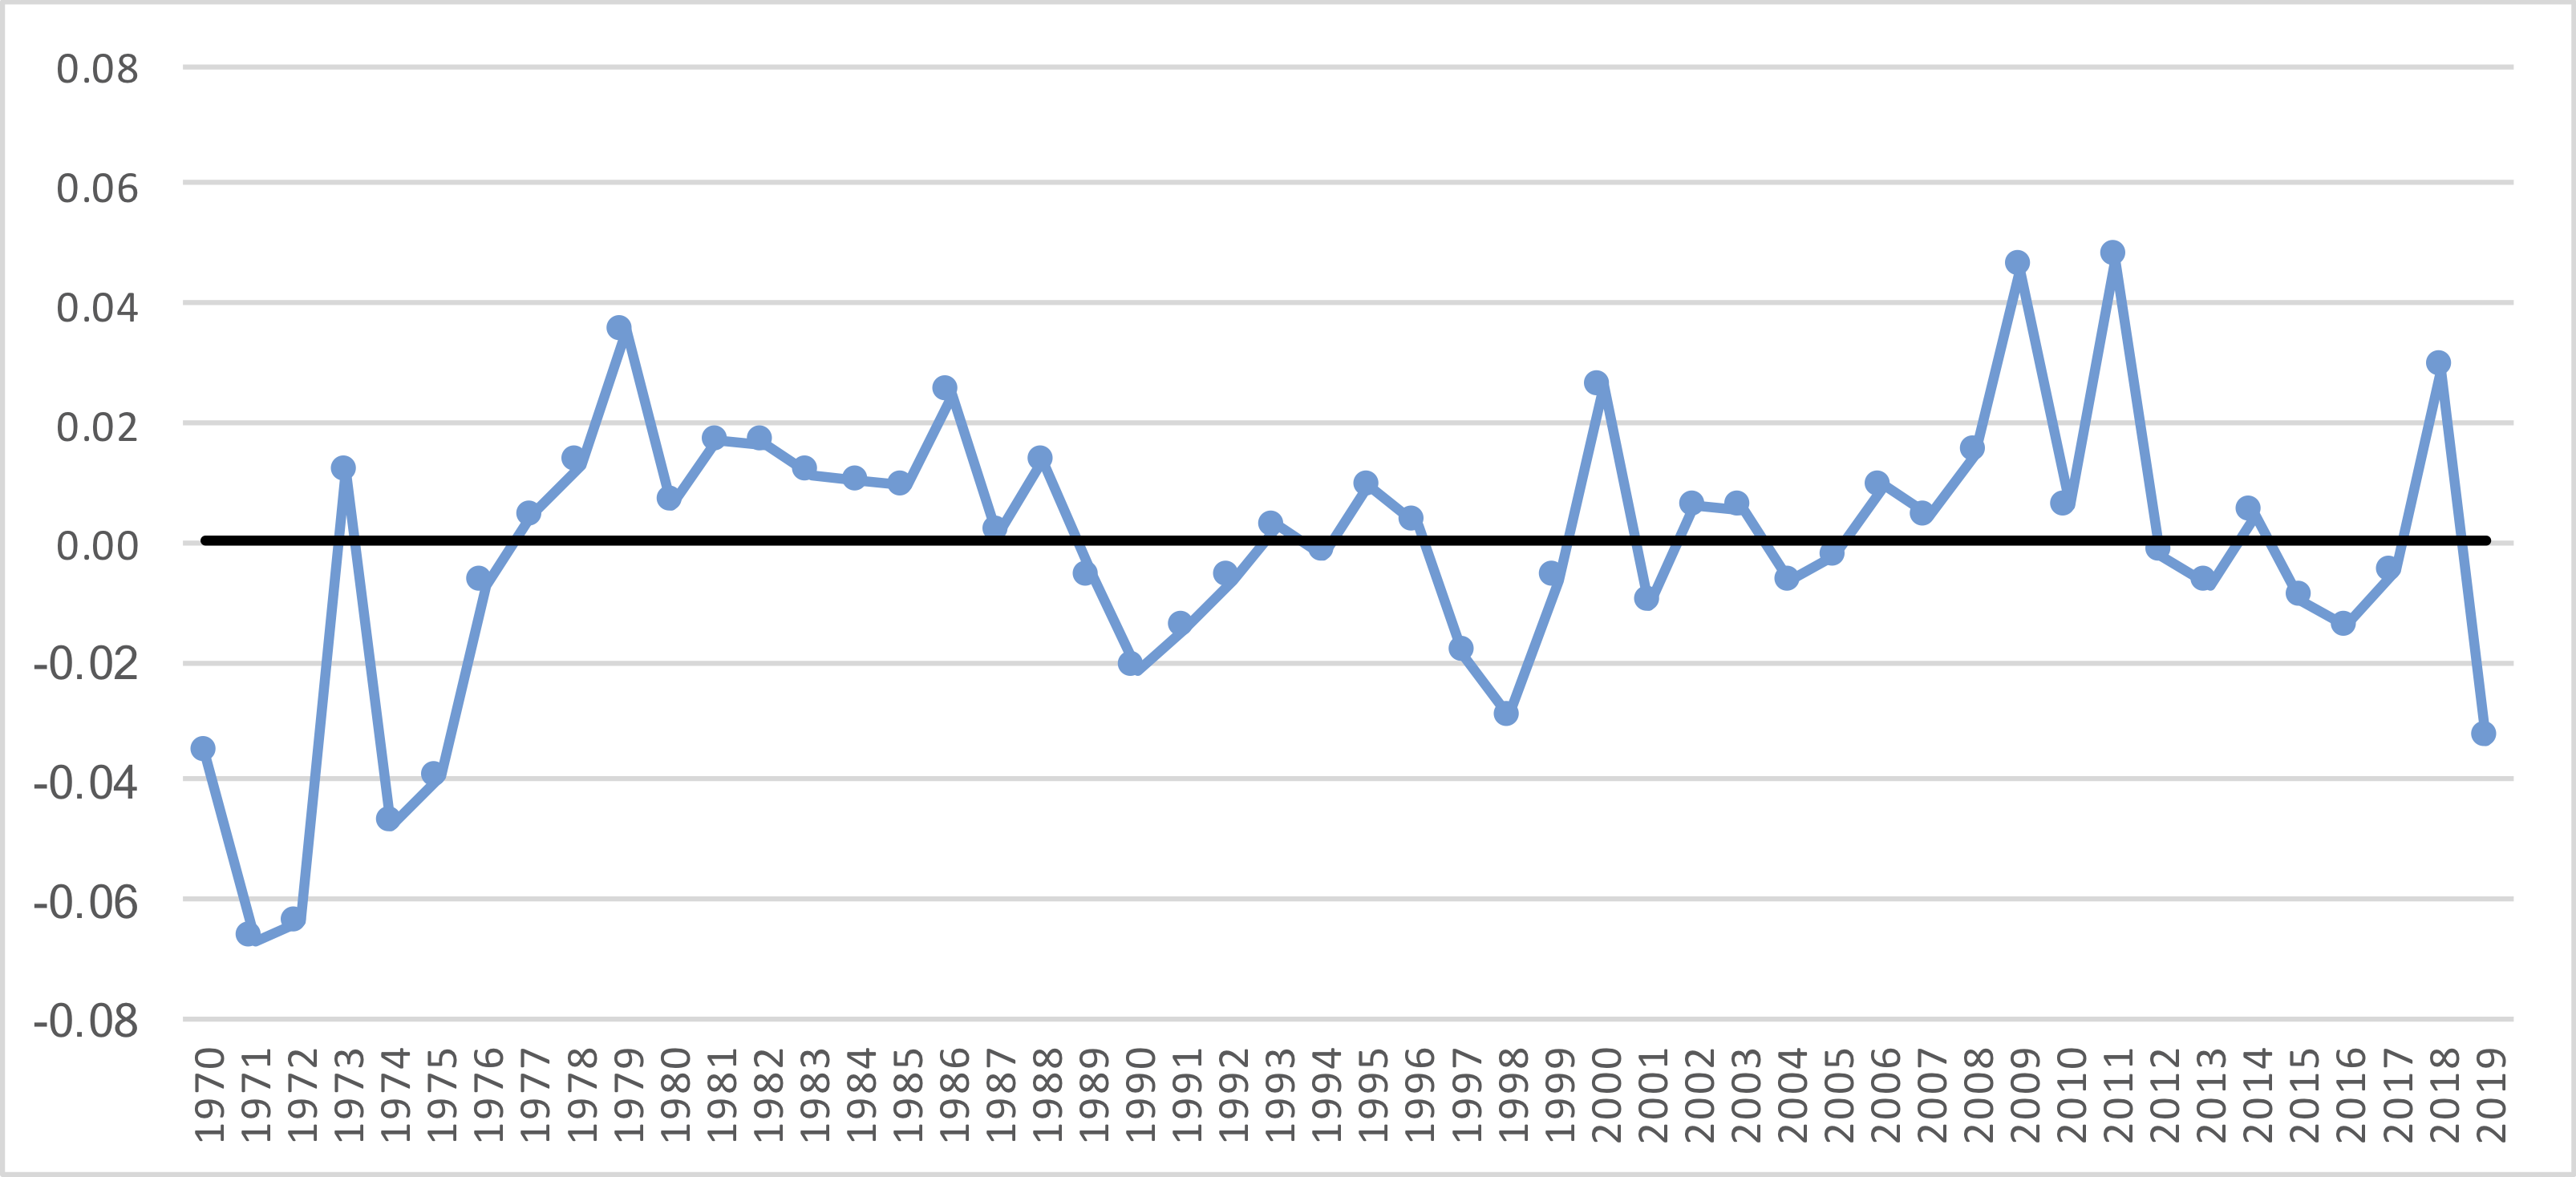
This final graph is a little wonky, but here goes. It shows the league average ANY/A in each season calculated the normal way minus the average of the ANY/A for all of the teams. So in 2019, you get a negative number (6.16 – 6.19 is -0.03); in 2018, it’s positive. Any time the graph is above 0, it means that the right teams are passing more often. Any time it’s below zero — as in 2019 — it means the wrong teams are passing more often.
What do you think?