
One of my favorite articles was written back in 2012, and the idea began during my law school days.
One of my law school professors was very quirky, even by law school professor standards. His preferred examination method was multiple choice, but with a twist. After grading each exam, he would then divide the students into quarters based on their test score. He would then re-examine each question, and measure how the top quarter of students performed on each question relative to the bottom quarter. Any question that more bottom-quarter students answered correctly than top-quarter students would be thrown out, and the exam would be re-graded. As he delicately put out, ‘if the wrong students are getting the question right, and the right students are getting the question wrong, it’s a bad question.’
NFL passing records are falling for a variety of reasons these days, including rules changes and league policies that make the passing game more effective. But there’s another reason: for the first time in awhile, the right people are throwing the most passes in the league. And there’s no better example of that than Drew Brees. Since coming to the Saints in 2006, he’s ranked 1st or 2nd in pass attempts four times, and ranked in the top three in net yards per attempt four times. But even since ’06, we’ve seen the passing game evolve, as the best quarterbacks are now the most likely ones to finish near the top of the leaderboard in pass attempts. In 2010, Peyton Manning had his first 600-attempt season… when he threw 679 passes for the Colts. Tom Brady threw 611 passes last year for the 13-3 Patriots, making New England one of just three teams to threw 600 pass attempts and win 13 or more games in a season. The other two teams? The ’09 Colts and the ’11 Saints.
In this early 1970s, the best passing teams often didn’t throw very often. In 1972, the top four teams in ANY/A — the Dolphins, Redskins, Giants, and Jets — all ranked in the bottom half of the NFL in pass attempts. And as I wrote in a 2014 update, there is a way to measure whether the best passing teams in the NFL are also the most frequent passing teams:
[W]hen we say the average completion percentage in the NFL is 61.2%, this is generally assumed to reflect the fact that in 2013, there were 18,136 passes thrown in the NFL, and 11,102 of them were completed.
An alternative method of measuring completion percentage in the NFL is take the average completion percentage of each of the 32 teams. That number won’t be very different, but it won’t be identical, either. The difference, of course, is that this method places the same weight on each team’s passing attack when determining the league average. The former, more common method, means that the Cleveland Browns make up 3.755% of all NFL pass attempts and the San Francisco 49ers are responsible for only 2.299% of the league-average passing numbers. The latter method puts all teams at 3.125% of NFL average.
…
Believe it or not, that background presents an interesting way to look at how the NFL has become more of a passing league.
…
For example, let’s look at the 1972 season. Miami led the NFL in points scored and in rushing attempts, while ranking 24th out of 26 teams in pass attempts. Does this mean the Dolphins weren’t a good passing team? Of course not; in fact, Miami had the highest Adjusted Net Yards per Attempt average of any team that season! That year, only two teams threw over 400 passes: New England and New Orleans. And both teams were below-average in ANY/A, with the Patriots ranking in the bottom three.
In 1972, the average pass in the NFL gained 4.28 Adjusted Net Yards. But an average of each team’s ANY/A average was 4.34, because good passing teams like Miami and Washington passed less frequently than bad passing teams like New England and New Orleans. The league-wide average was only 98.5% of the “average of the averages” average; whenever that number is less than 100%, we can conclude that the better passing teams are passing less frequently.
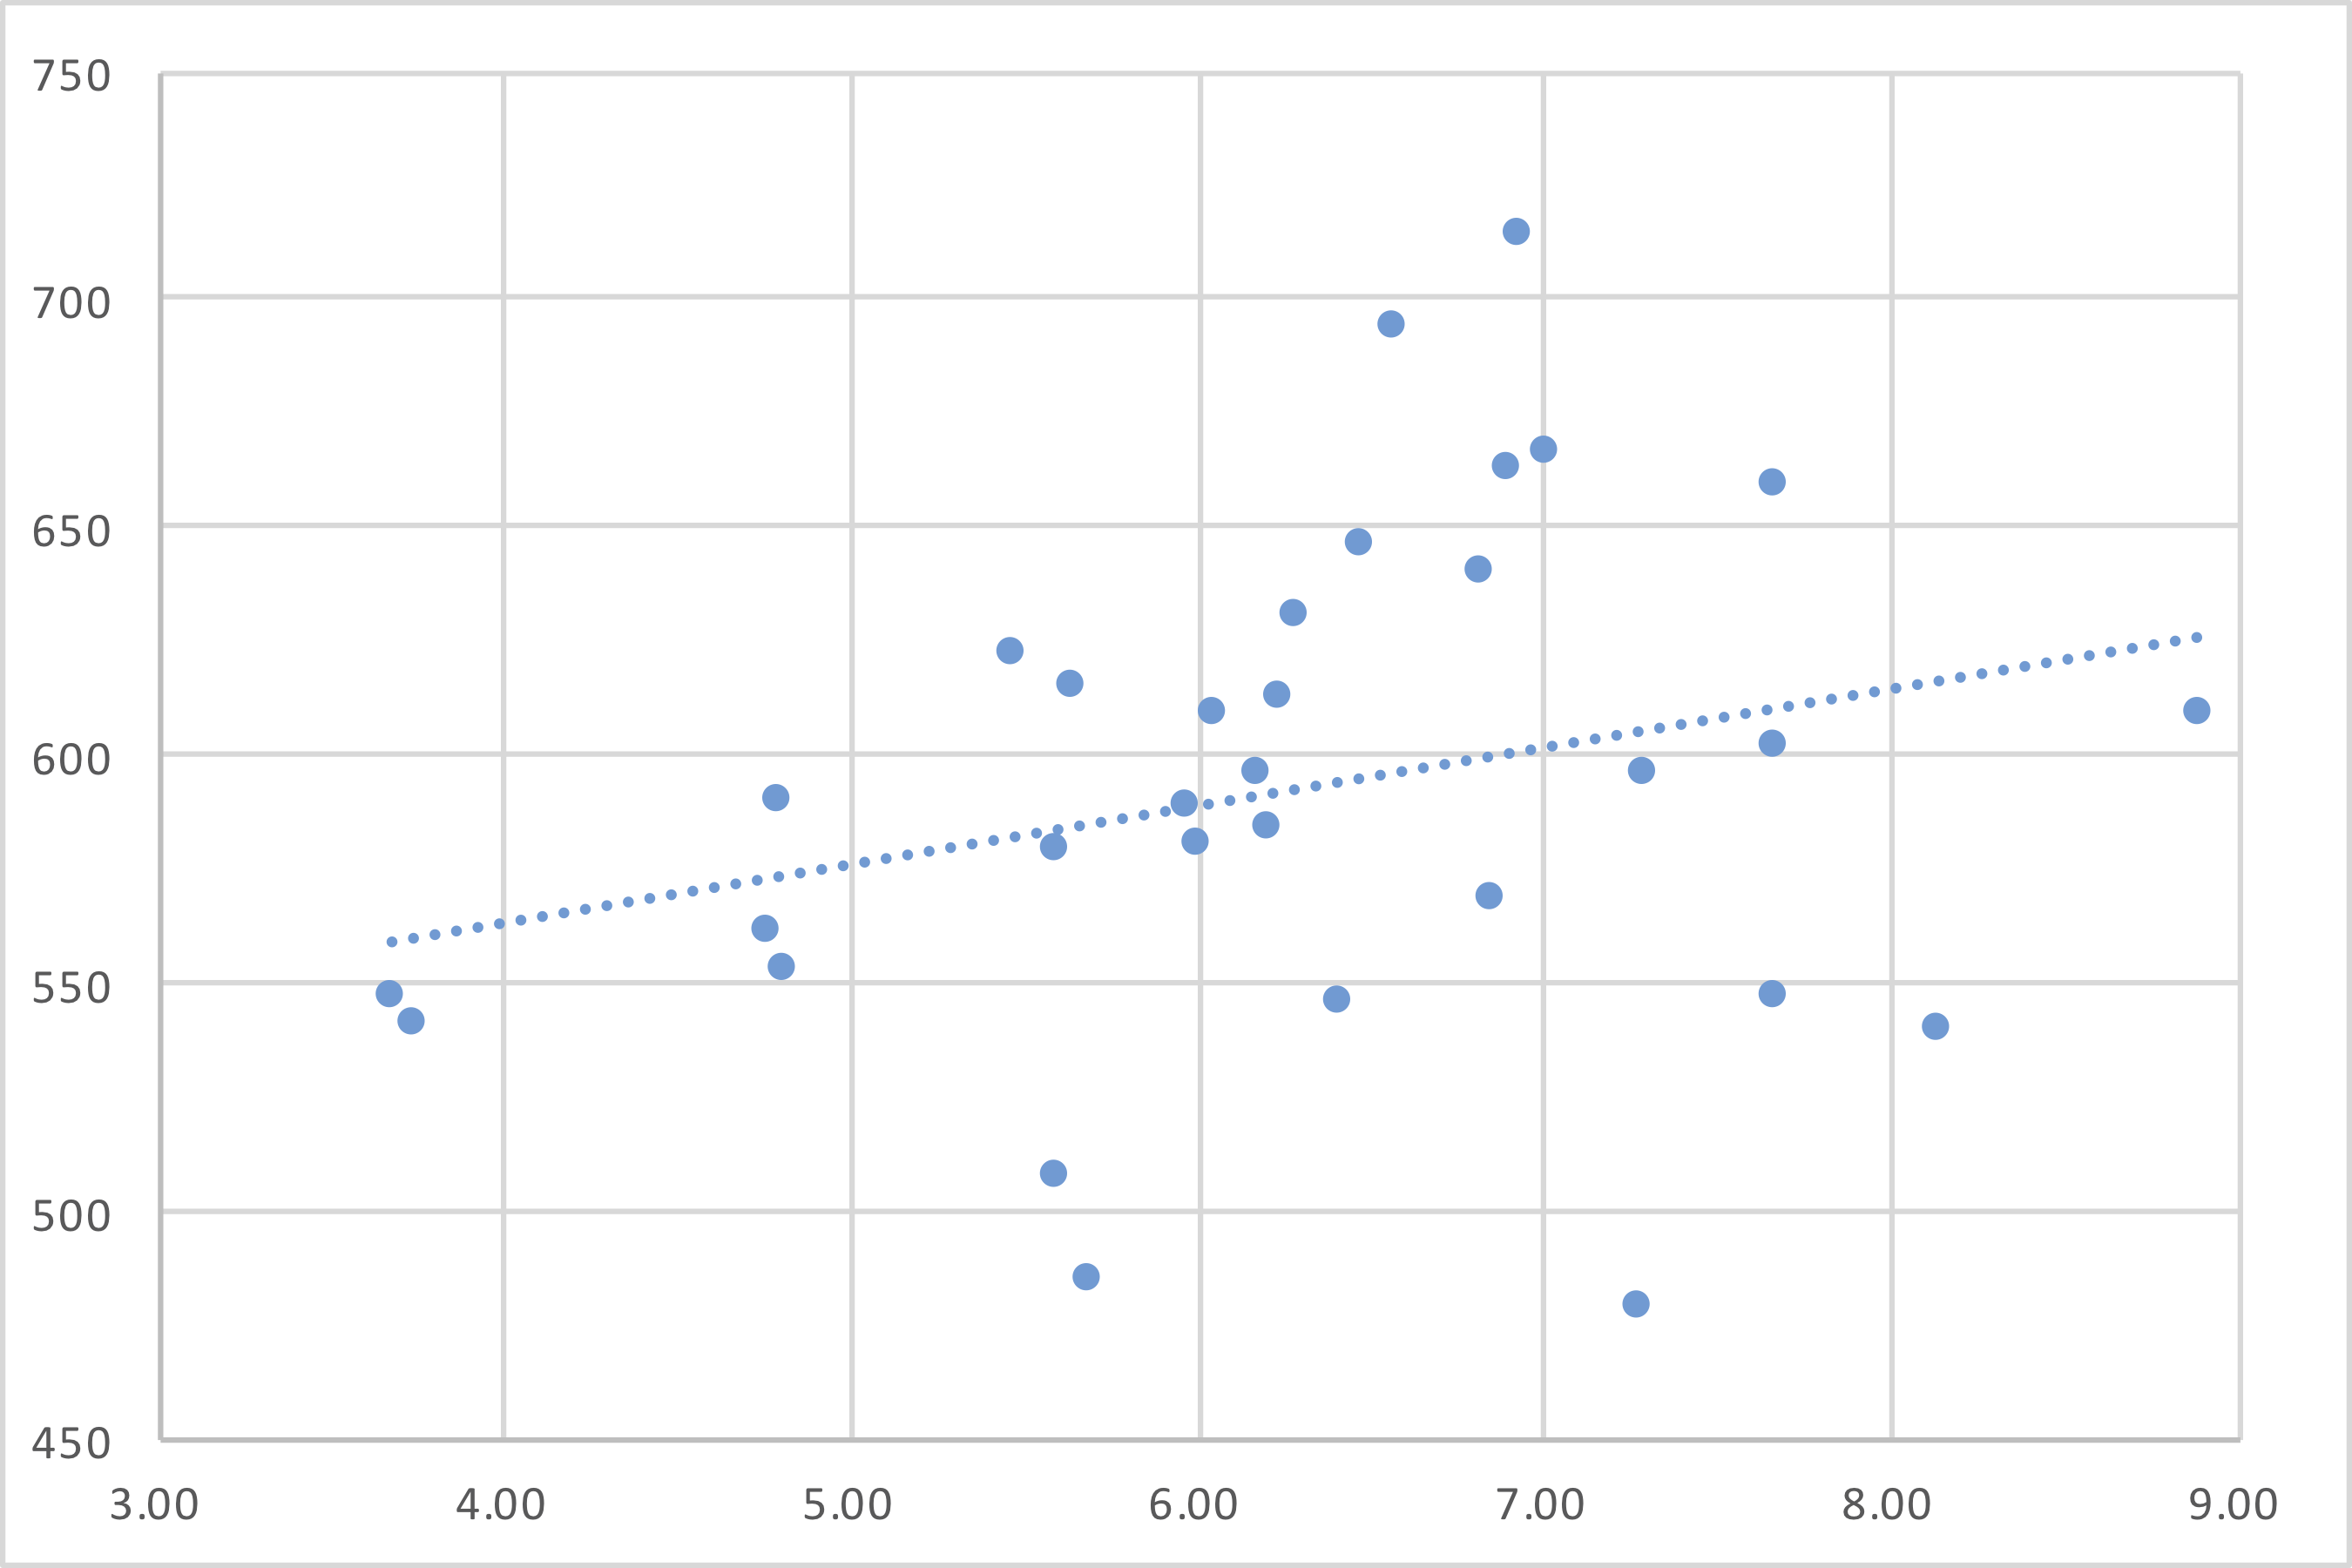
The graph below shows the passing data for the 32 teams in the NFL in 2018. The X-Axis shows each team’s Adjusted Net Yards per Attempt average; the Y-Axis shows each team’s number of dropbacks (pass attempts plus sacks). In a league where the teams with the best quality of passing attacks also have the most quantity of pass plays, the data will generally fit a line that slopes up and to the right. That’s not quite the case here, but there is a positive relationship between the two variables. Yes, the Saints were very efficient but didn’t pass very often, but the Chiefs led the NFL in ANY/A and were 12th in passing dropbacks, while the Falcons were 3rd in ANY/A and 5th in dropbacks. And the bottom three teams in dropbacks — the Jets, Bills, and Cardinals — all ranked in the bottom 10 in ANY/A.
In 2018, the NFL as a league averaged 6.32 ANY/A. However, if you average the ANY/A averages of each of the 32 teams, you get an average of 6.29. This means the average ANY/A was equal to 100.5% of the “average of the averages” ANY/A; that result only exceeds 100% when the better passing teams pass more frequently than the weaker passing teams. Twenty years earlier, in 1998, the league as a whole averaged 5.31 ANY/A, but an average of each team’s ANY/A would give you a result of 5.34. That’s because by assigning the same weight to each passing offense, you would have a higher result in 1998 than if you weighted efficiency by pass attempts because in 1998, weaker passing teams passed more often than stronger passing teams.
The graph below shows the relationship between these two variables. In short, it shows for each season since 1970, the league-wide ANY/A average divided by the ANY/A average for each of the teams in the league that year. A result of more than 100% means the better passing teams passed more often than the weaker passing teams.
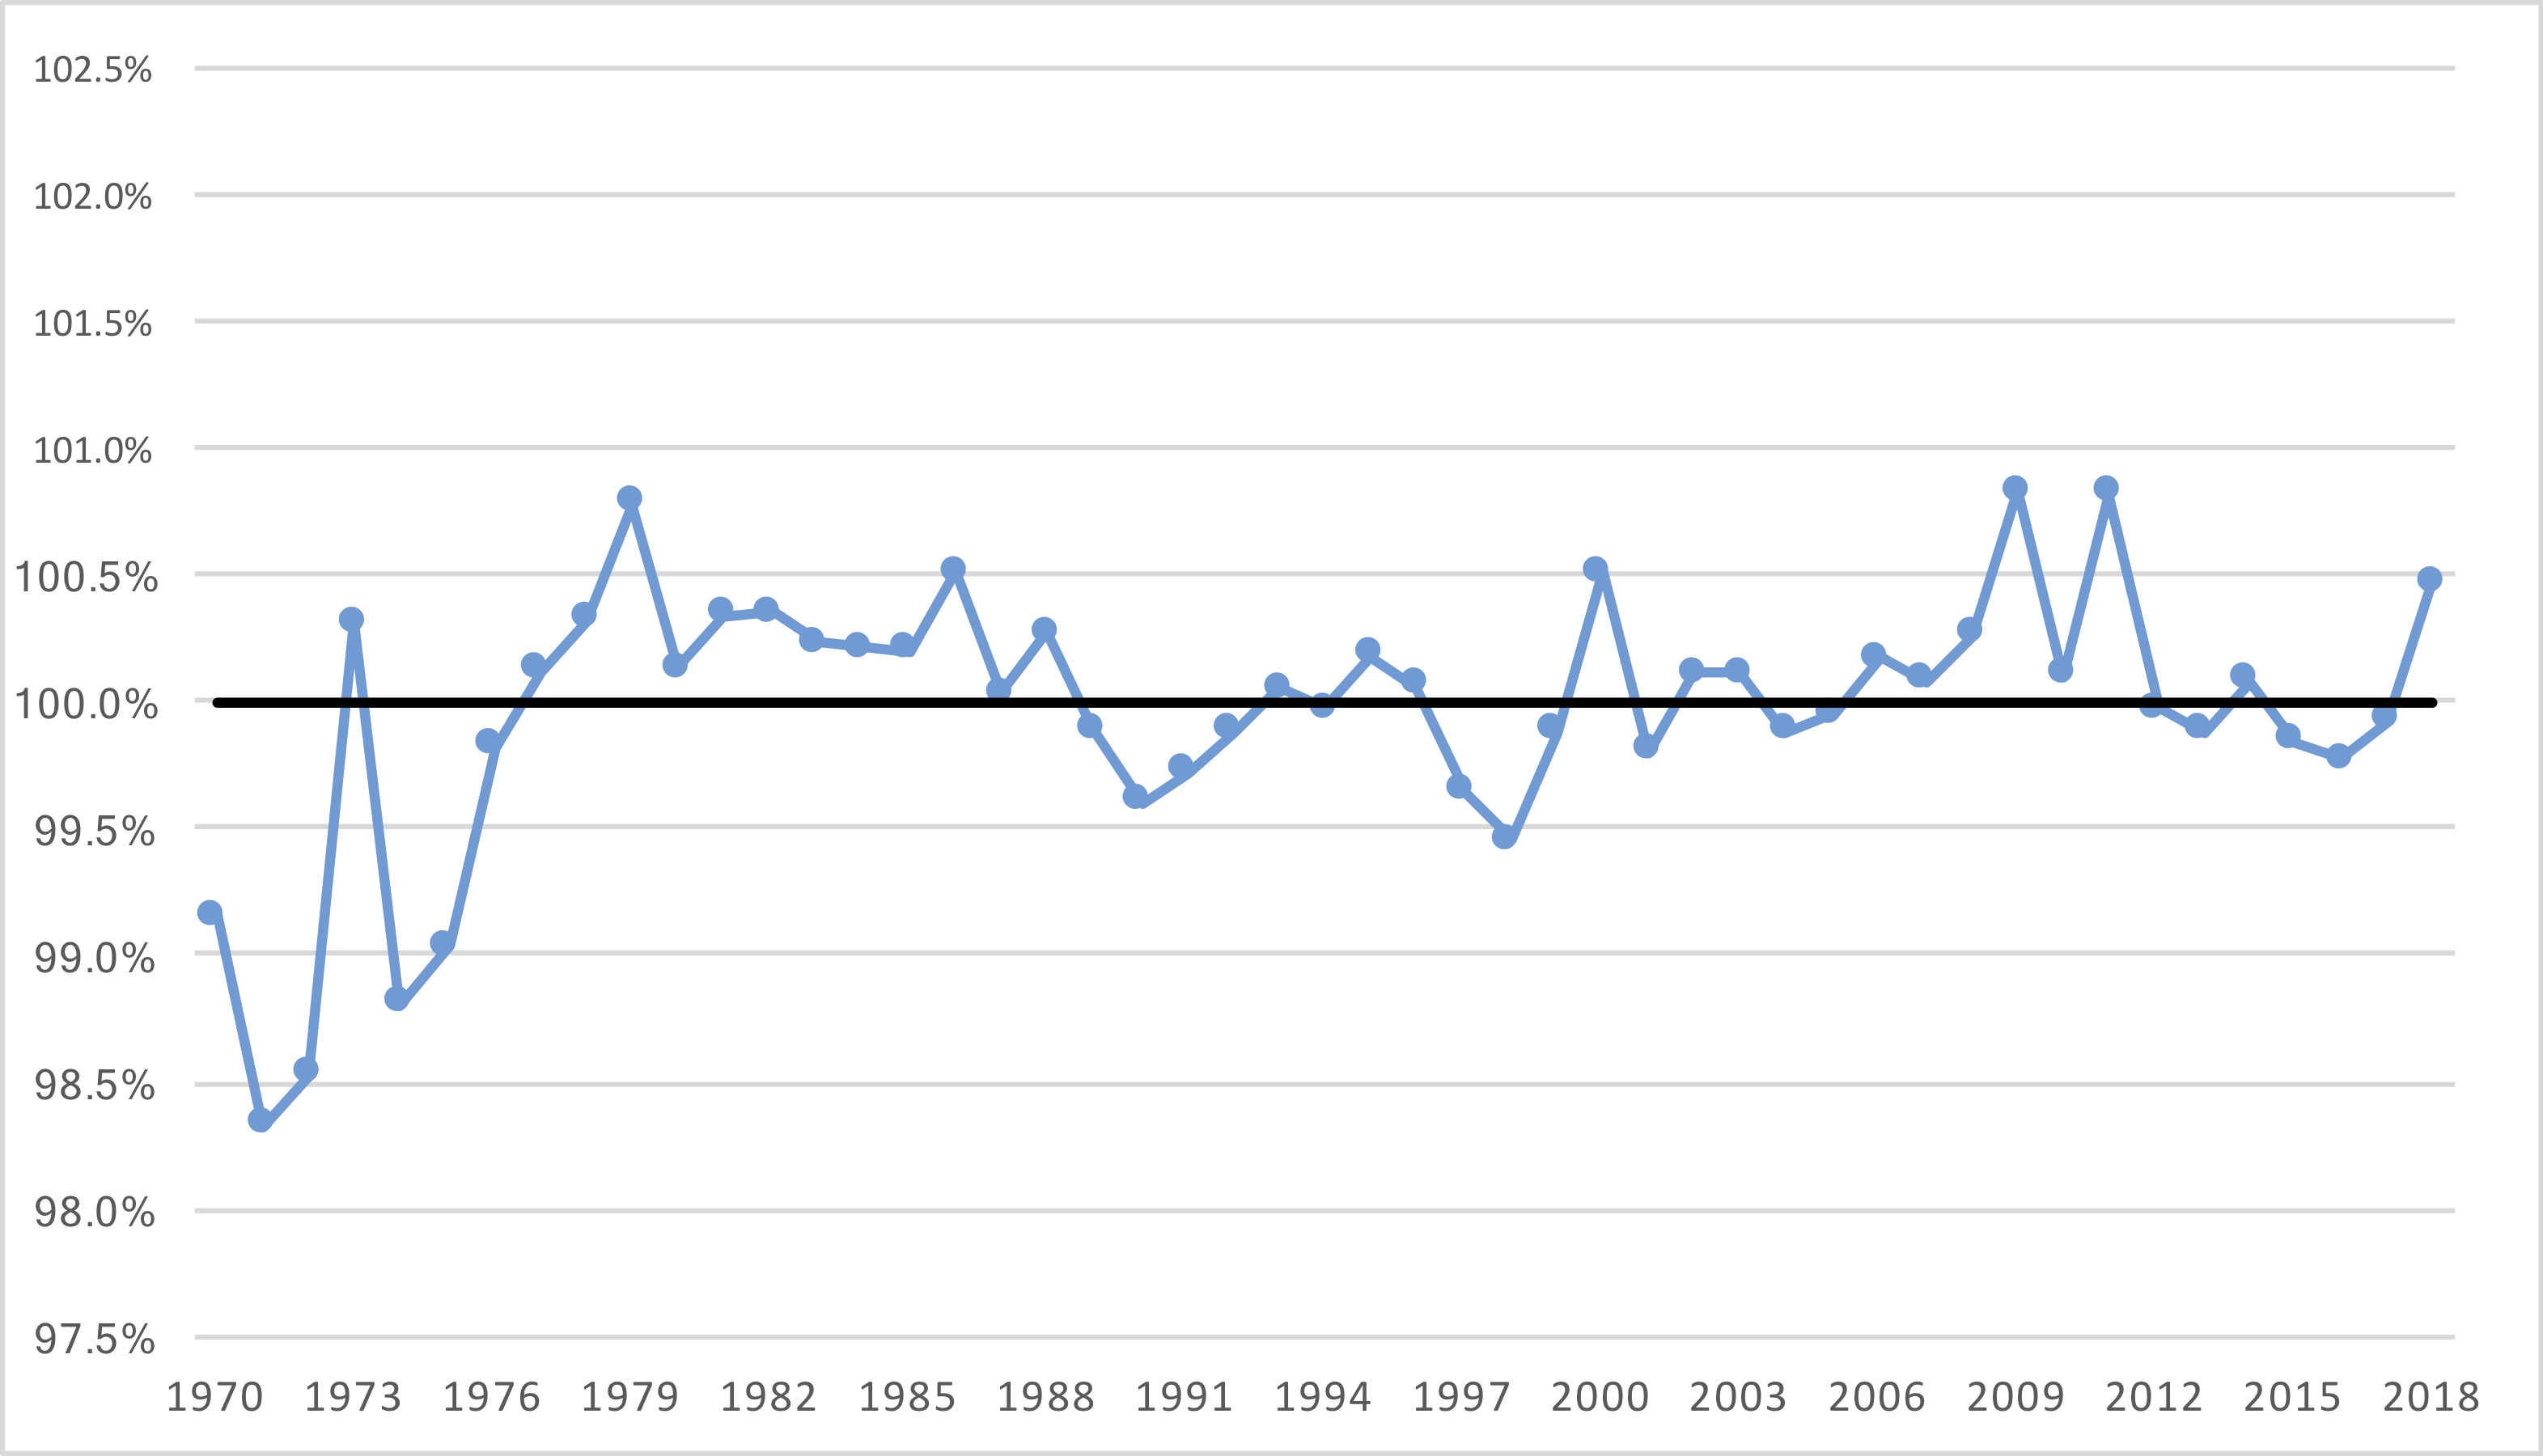
Pretty neat, right? And at least in 2018, the better passing teams passed more often than the weaker passing teams.