≡ Menu

NFL Touchback Data

In March of 2011, the NFL voted to move kickoffs up from the 30 to the 35-yard line. That impact has been significant, and the league responded by placing a greater emphasis on kickers who can boom kickoffs into the opposing end zone.

In 2016, the NFL moved up where offenses would start following a touchback from the 20 to the 25-yard line, which made returners more likely to just take a touchback. That impact has been marginal.

The graph below shows the percentage of kickoffs that resulted in a touchback in each of the last 25 seasons. [continue reading…]

{ 2 comments }

The 2019 Titans Are Kicking Like It’s 1952

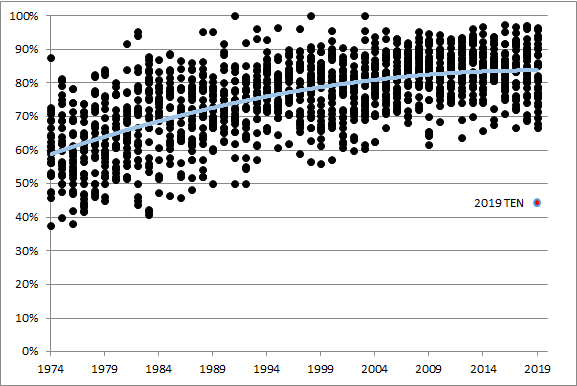
Field goal rates have been improving significantly over the last several decades. And while field goal success rate isn’t the best stat because it treats field goals of all distances equally, it’s remarkably consistent at the league level: the field goal success rate was between 84.0% and 84.7% over each of the last five years prior to 2019.

But this season, the league’s field goal rate has dropped significantly to 80.9%.  But what’s truly remarkable is what’s happening with the Titans.  The graph below shows the field goal success rate for every team in every year from 1974 (the year the goal posts were moved) to 2019.  See if you can spot the 2019 Titans.

[continue reading…]

{ 0 comments }

Justin Tucker continues to be the best kicker in the NFL. He missed his first kick today, from 40 yards away, which was shocking. And that’s the point of today’s post: Tucker missing a 40-yard field goal is shocking.

His last 7 misses were from 65, 53, 48, 43, 46, 62, and 58 yards away. He had made 56 consecutive field goals from 40 yards and in, until the miss today against Houston. The graph below shows the result of every regular season field goal in Tucker’s career, from his first game in 2012 through week 10 of the 2019 season. [continue reading…]

{ 0 comments }

NFL Field Goal Rates From 2014 to 2018

Field goal efficiency continues to improve in the NFL. Every once in awhile, it’s worth checking in on the league average rates to get a sense of “what’s normal” when it comes to NFL kickers. For example, it’s now expected that a 50-yard field goal will be successful. In fact, over the last 5 years, kicks from 50-53 yards were made nearly 70% of the time!

The graph below shows the NFL success rate on field goals over 4-yard increments. Even from 54-57 yards, kickers are now expected to make those kicks.

We can also use those rates to take a simple look at how each kicker has fared relative to league average, based on the length of their kicks. This covers all field goals from 2014 to 2018, and you won’t be surprised to see Justin Tucker as the NFL’s top kicker over that period.

RkPlayerFGAFGM%Exp FGMDiff
1Justin Tucker19517489.2%159.514.5
2Matt Bryant15513989.7%129.39.7
3Robbie Gould13812691.3%118.17.9
4Stephen Gostkowski19917889.4%170.47.6
5Matt Prater15713686.6%128.97.1
6Adam Vinatieri15813988%132.66.4
7Josh Brown706592.9%60.74.3
8Ryan Succop13511786.7%113.23.8
9Stephen Hauschka17615386.9%149.53.5
10Jason Myers1159784.3%94.12.9
11Josh Lambo1099486.2%91.62.4
12Wil Lutz1099486.2%91.82.2
13Harrison Butker726488.9%622
14Chris Boswell13011386.9%1112
15Greg Zuerlein16313683.4%134.11.9
16Shaun Suisham353291.4%30.51.5
17Michael Badgley222090.9%18.61.4
18Graham Gano16914384.6%141.61.4
19Jake Elliott706085.7%58.71.3
20Jason Sanders201890%17.10.9
21Dustin Hopkins11710085.5%99.30.7
22Ka'imi Fairbairn675785.1%56.40.6
23Garrett Hartley33100%2.60.4
24Daniel Carlson211781%170
25Johnny Hekker11100%10
26Sebastian Janikowski1139382.3%93.1-0.1
27Greg Joseph201785%17.2-0.2
28Shayne Graham353085.7%30.3-0.3
29Aldrick Rosas585086.2%50.3-0.3
30Jay Feely4375%3.4-0.4
31Dan Carpenter907684.4%76.4-0.4
32Dan Bailey14712283%122.5-0.5
33Brett Maher383078.9%30.6-0.6
34Patrick Murray494081.6%40.6-0.6
35Randy Bullock1109485.5%94.6-0.6
36Giorgio Tavecchio262180.8%21.7-0.7
37Travis Coons403587.5%35.9-0.9
38Nick Rose141178.6%12.2-1.2
39Mason Crosby16213684%137.5-1.5
40Kai Forbath1028684.3%87.6-1.6
41Matthew McCrane12866.7%9.7-1.7
42Cairo Santos13011084.6%111.8-1.8
43Chandler Catanzaro14412184%123.1-2.1
44Nick Novak1068984%91.1-2.1
45Younghoe Koo6350%5.2-2.2
46Zach Hocker141071.4%12.3-2.3
47Sam Ficken8562.5%7.3-2.3
48Alex Henery5120%3.6-2.6
49Andrew Franks393179.5%33.6-2.6
50Nate Freese7342.9%6-3
51Billy Cundiff292275.9%25.1-3.1
52Brandon McManus14912281.9%125.3-3.3
53Mike Nugent1119182%94.5-3.5
54Phil Dawson12710481.9%107.5-3.5
55Kyle Brindza12650%9.5-3.5
56Zane Gonzalez342470.6%27.7-3.7
57Cody Parkey12210283.6%105.8-3.8
58Connor Barth856981.2%72.9-3.9
59Josh Scobee362672.2%29.9-3.9
60Nick Folk977880.4%82.7-4.7
61Caleb Sturgis1169481%99-5
62Roberto Aguayo312271%27.1-5.1
63Blair Walsh1229678.7%102.7-6.7
{ 7 comments }

Rams kicker Greg Zuerlein has been outstanding this year. Consider:

  • He is 4/4 on kicks from 50+ yards this year. Kickers have made 72% of field goal attempts from that range this season, so the average kicker would have made 2.9 such field goals. As a result, Zuerlein has made 1.1 more 50+ yard kicks than the average kicker.
  • He is 9/9 on kicks from 40-49 yards. Kickers have made 79% of kicks from that range this season, so the average kicker would have made 7.1 of those 9 attempts. Therefore, he made 1.9 more field goals than an average kicker from that range.
  • He is 9/10 on kicks from 30-39 yards. Kickers have made 84% of such kicks this year, so an average kicker would have made 8.4 of his 9 attempts. As a result, Zuerlein has made 0.6 more field goals fro 30-39 yards than the average kicker.
  • From 0-19 yards he was 1/1, and from 20-29 yards, he is 5/5. All kickers have made all attempts form under 20 yards, so he gets no credit for that. And kickers have made 99% of kicks from 20-29 this season, so he gets credit for being .1 field goals made above average here.
  • Kickers have made 94.5% of extra points this year, while the Rams star is 31 of 31. Since the average kicker would have made 29.3 of 31 kicks, it means Zuerlein has made 1.7 more extra points than the average kicker.

Add it up, and Zuerlein has made 3.7 more field goals than the average kicker — worth 11.2 points — and 1.7 more extra points. That translates to 13.0 points above average, the most of any kicker in the NFL. In fact, other than Kansas City’s Harrison Butker, Zuerlein has added twice as much value as all other kickers this year. [continue reading…]

{ 3 comments }

Guest Post: The Patriots’ League-Best Kickoffs

Today’s guest post comes from Miles Wray, a long-time reader of the site. He’s written an interesting post on special teams today, but you may know him as the host of the daily NBA podcast The 82 Review. You can also find him on Twitter @mileswray. What follows are Miles’ words: as always, we thank our guest writers for their contributions.


Bill Belichick Found Another Way to Bleed Yards From Opponents

Gostkowski, probably not kicking a touchback

Anytime the New England Patriots are at the top — or the bottom — of a league-wide leaderboard, no matter how insignificant that leaderboard is, it’s worth taking notice. The odds are that Bill Belichick and Ernie Adams are thinking a few steps ahead of every other team in the league, and are leveraging yet another corner of the game to their advantage.

Since the Patriots offense remains incredibly explosive, it’s pretty reasonable that they would be near the top of the league in the total number of kickoffs returned (i.e., opponent kickoff returns). New England has 47 kickoffs this year, or nearly double the number of a struggling offense like the Cleveland Browns (26). But how about this: the Patriots are dramatically ahead of everybody else in the league in the percentage of their kickoffs that are returned.

Since kickoffs were moved from the 30- to the 35-yard-line in 2011, it’s more common than ever to see a kickoff boomed out the back of the endzone. These plays have become so routine it’s basically part of the commercial break now. But not for the Patriots. The Patriots seem to be inviting their opponent to return their kicks.

I went through the kickoff statistics for each team in the league, and discarded any onside kicks, any short kicks in the last 10 seconds of the first half (which are often intentionally squibbed), and any kicks where the just-scored/kicking-off team had been penalized, moving the kickoff to the 30-, 25-, or 20-yard line. The remaining “clean” kickoffs give the best indication of a team’s intentional special teams strategy over time.

This season, most teams have about a third of their kickoffs returned. Only three teams have had over half of their kickoffs returned; the Patriots are alone at over 60%: [continue reading…]

{ 16 comments }

Field Goal Rates Throughout NFL History

Yesterday, I wrote about Nick Lowery and why I think he was the greatest field goal kicker in NFL history.  That post was pretty long — I probably should have broken it into two parts — but I’d welcome any more discussion on the topic here or there.

So today I’ll keep it short and sweet: a reminder on how necessary era adjustments are when discussing field goal kickers. The graph below shows the field goal success rate throughout history. From 1960 to 1964, the average success rate was 50 percent. Over the last five years, the average rate was 85 percent.

Even more remarkable is that kicks are being attempted from farther away now, too. In 1960, the average kick was from 30.9 yards away; the average successful kick was from 26.2 yards out, while the average miss was from 36.0 yards away. Well, in 2016, the average kick was from 37.7 yards away; the average successful kick was from 36.2 yards out — farther than the average miss in 1960! — while the average miss was from 46.2 yards away.

The graph below shows the average length of each field goal attempt, in blue, each field goal made, in orange, and each field goal miss, in gray. [continue reading…]

{ 10 comments }

Lowery, Anderson, Andersen, and Stenerud In Four Charts

A couple of years ago, I wrote about the best field goal kickers in NFL history. That was a threepart series where I measured how accurate each field goal kicker has been after adjusting for era and distance. The result? Nick Lowery was, by a clear margin, the most valuable field goal kicker in NFL history. He made kicks at a rate nearly 10% higher than league average after adjusting for era and distance, an astonishing level of success considering his reputation hasn’t quite matched his production.

Today, I wanted to update that post and also provide a comparison of the four men generally considered in contention for the title of top field goal kicker in history: Jan Stenerud, the first pure placekicker to make the Hall of Fame, Morten Andersen, who became the second such Hall of Famer this year, Nick Lowery, my choice for the best kicker ever, and Gary Anderson, who had a long and distinguished career.

I used a simple methodology this time around to compare the four kickers: I catalogued all field goal attempts in NFL history into five yard ranges (i.e., 40-44, 45-49, 50-54, etc.). Then, I looked at the league average success rate that season and calculated the expected number of field goals an average kicker would be expected to make from that range. So if the league average rate on kicks from 40-44 yards was 75%, a kicker with 8 field goal attempts from that rage would be “expected” to make 6 of those attempts. Finally, I calculated how many field goals each kicker made above expectation, and then created the following four charts. So if a kicker made 7 out of 8, he would be at +1.0. I have coded particularly good outcomes in blue, and bad outcomes in red. Let’s get to it.

Jan Stenerud [continue reading…]

{ 30 comments }

Blair Walsh In Perspective: Game-By-Game EPA

Minnesota Vikings kicker Blair Walsh was released by the Vikings this week, and given his struggles this year, it’s hard to argue with Minnesota’s decision. Walsh will be infamously remembered for missing a chip shot in the playoffs against the Seahawks last year, and those demons have carried over to his 2016 performance.

How much so? I looked at every kick of Walsh’s career, beginning in his rookie season of 2012. For every made extra point in 2012, 2013, or 2014, I gave him +0.01 points, and +0.06 points for every made extra point in 2015 or 2016. Then, for every miss, he received -0.99 or -0.94 points, as applicable.

Extra points were easy; field goals were slightly harder. The graph below shows the average success rate on field goals in 3-year increments, from 2012 to week 10 of 2016:

fg-exp

I used those numbers to give Walsh points for each field goal attempt, too. For example, 48-50 yard kicks have been made 70% of the time over the last five years, so if Walsh attempted a 49-yard field goal, I gave him +0.9 points if he made it, and -2.1 points if he missed it.

Using that methodology, here is how Walsh has fared in every regular season game of his career:

walsh-fg

As a rookie, Walsh was at +11.4 in this system, and would be even higher if I era-adjusted in sample (for convenience, I treated 2012 games the same as 2015 games, which probably is not appropriate). In 2016, he had -7.1 points by this system, including two miserable games in weeks 1 (missed extra point, missed 37-yarder, missed 56-yarder) and 9 (missed extra point, missed 46-yarder in a game the Vikings lost in overtime).

{ 11 comments }

Yesterday, I looked at the career leaders in fourth quarter/overtime game-winning field goals. It’s fun — in a purely trivial way — to see which kickers have made the most game-winners, but that’s only half the story. What about which kickers have missed the most key field goals?

I looked at all field goal attempts since 1994 that came when the game was tied or the kicking team was trailing by 1 or 2 points. I did not make any adjustments for era, or distance, or weather, since this is a trivia post on a Sunday in May. That said, man was Todd Peterson good at missing key field goals. Like, really, really good.

He missed 17 of his 34 field goal attempts in this situation; not only was that 50% rate the worst for any kicker with more than five misses, but his 17 misses truly lapped the field. [continue reading…]

{ 0 comments }

Nick the Kick

Nick the Kick

On Tuesday, I explained the formula used in my system of grading field goal kickers, which is based on field goal success rate adjusted for distance and era.  Yesterday, I looked at the single-season leaders using that methodology. Today, we look at the best field goal kickers since 1960 on the career level.

And frankly, it’s not much of a question as to who is the best kicker ever. Until presented with evidence to the contrary, that honor belongs to Nick Lowery (you can tell him about that here). The table below shows the top field goal kickers ever; let’s walk through Lowery’s line as an example.

Lowery played from 1978 to 1996. The length of his average field goal attempt was 36.6 yards, and the length of his average made field goal was 34.8 yards. Lowery attempted 479 field goals in his career; based on the distance of those kicks and the era in which he played, we would expect an average kicker to have made about 337.6 of those attempts. Instead, Lowery made 383 of them, a whopping 45.4 field goals above expectation. Thought of another way, Lowery’s expected field goal rate was 70.5%, while his actual was 80.0%, so he was successful an extra 9.5% of the time he lined up to kick. That’s remarkable. In short, Lowery was the most valuable field goal kicker in NFL history. [continue reading…]

{ 76 comments }

In 1983, there were 46 field goal attempts of 52 yards or longer. That year, just 17 of them were successful… and four of them came from Baltimore Colts rookie kicker Raul Allegre. But that’s just the highlight for perhaps the best kicking season ever.

During the Colts last year in Baltimore, fans voted Allegre the team’s most valuable player. And with good reason: Allegre attempted 35 field goals, but given the distances of those kicks and the kicking environment in 1983, we would have expected Allegre to make 21.2 of those attempts. Instead, Allegre connected on 30 field goals, giving him 8.8 more field goals above average. That’s the highest rate in any single season ever. Yesterday, I unveiled a methodology for ranking kickers, based on two factors: the length of each field goal attempts and the year in which they kick was attempted. Using that formula, I then was able to grade every field goal kicking season since 1960.

Let’s use Nick Lowery’s 1985 season to walk through the table below. That year, playing for the Chiefs, Lowery went 4/4 on kicks from 20-29 yards, 10/11 from 30-39 yards, 7/7 from 40-49 yards, and 3/5 from over 50 yards. (Note that while I have the data on the specific distance of each attempt, it made sense to present it for consumption in this way.) He attempted 27 kicks, and given the distances and the era, was expected to be successful on 17.2 of them. Instead, he made 24, giving him 6.8 field goals above average. If you prefer to think in terms of rates, Lowery was expected to be true on 63.7% of kicks, but actually made 88.9% of his attempts; that’s 25.2% above expectation, the highest rate by any kicker with at least 25 attempts. The table below shows the top 300 seasons since 1960: [continue reading…]

{ 13 comments }

Six years ago, I took my first crack at analyzing field goal kickers. I have been meaning to update that article for each of the last three offseasons, and with the sun setting on the 2015 offseason, I didn’t want to let this slip yet again.

Ranking field goal kickers is not difficult conceptually, but it can be a bit challenging in practice. One thing I’ve yet to refine is the appropriate adjustments for playing surface, stadium, time of game, temperature, and wind. That’s a lot of adjustments to deal with, all on top of the most obvious adjustment: for era.

But as I understand it, Rome was not built in a day; further, I believe that a journey of a thousand miles begins with one step. As a result, I’m okay with only getting part of the way there for now, and punting (which is very, very different from kicking) the rest of this process to next offseason.

Let’s begin with the obvious: era adjustments are really, really, important.  To provide some examples, I looked at the field goal rates at four different increments: 22-24 yard kicks, 31-33 yard attempts, kicks from 40-42 yards away, and finally, field goal attempts from 49-51 yards.  In the graph below, I’ve plotted the success rate at those four distances for each year since 1960, along with a “best-fit” curve at each distance. Take a look: [continue reading…]

{ 5 comments }

Are Kickers Faring Worse In 2014?

Does it feel like kicking accuracy is down so far in 2014? Detroit rookie Nate Freese was just 3/7 before the Lions cut him on Monday, with all four misses coming in the 40-to-49 range. Bengals kicker Mike Nugent has also missed four attempts so far this year; for him, a 38-yarder balances out his 55-yard miss, to go along with a pair of unsuccessful tries in the 40-to-49 range.

Tampa Bay placekicker Patrick Murray had a 24-yard attempt blocked in a game Tampa Bay lost by two points. Randy Bullock, the Texans kicker who was Freese before Nate Freese existed, saw his 27-yard attempt blocked by Justin Tuck. [1]Who is not to be confused with the near-automatic Justin Tucker. The Ravens kicker did miss once this year, but we’ll give him a pass since it was a 55-yarder. Eight more kicks were missed in the 30-to-39 range, too, so if you feel like you’ve seen a bunch of missed field goals, well, I won’t tell you how to feel.

But are kickers actually faring worse this year? I broke down field goal attempts in three yard increments (18 to 20, 21 to 23, 24 to 26, etc.) for the first three weeks of each year beginning in 2002. The blue line shows the data from 2002 to 2005, the red line represents kicking from 2006 to 2009, and the green line covers the last four years. Since the data can be choppy, I included larger, smoothed lines, for each four-year period. [continue reading…]

References

References
1 Who is not to be confused with the near-automatic Justin Tucker. The Ravens kicker did miss once this year, but we’ll give him a pass since it was a 55-yarder.
{ 13 comments }

On Friday, I looked at the career leaders in 4th quarter (and overtime) game-winning touchdowns from scrimmage. Yesterday I presented the all-time leaders in passing touchdowns. Today we give field goal kickers some love using the same criteria.
[continue reading…]

{ 1 comment }

Rankings the kickers, from Tucker to Crosby

Mack Brown knows kicker.

Mack Brown knows kickers.

In the summer of 2009, I wrote a three-part series analyzing every kicker of the last half-century (here are the links to Part I, Part II, Part III). What I did there was analyzed field goal attempts by distance, and then credited a kicker for how many field goals he made over the expected number of successful field goals from each distance.

For example, field goal kickers this year have made 15 of 23 attempts from exactly 50 yards. [1]There is some bias in the data in that only the best distance kickers attempts long field goals, but dealing with that is best left for another day. If we assume that 50-yard kicks are successful 65% of the time, then a made 50-yarder will be worth +0.35 field goals and a missed 50-yarder will be worth -0.65 field goals.

To smooth the data, I used kicks from 2005 to 2011, and I also grouped field goals into four-yard increments. In the off-season, I plan to incorporate stadium, temperature, and other weather effects, but for now, I’ve ignored the (often large) role such elements can play.

The table below shows how many field goals over expectation each kicker made through week 15. I also included a column for extra points, and the final column shows how many points over average each kicker provided, giving them 3 points for each field goal and one point for each extra point over average:

RkNameTmFG MFG AFG %EXP FG MadeFG Ov AVGXP MXP AXP Ov AvgPoints Ov Avg
1Justin TuckerBAL252792.6%20.74.337370.213.1
2Sebastian JanikowskiOAK293290.6%24.74.322220.112.9
3Blair WalshMIN293290.6%25.13.930300.211.8
4Shaun SuishamPIT262796.3%22.43.630300.210.8
5Phil DawsonCLE262796.3%22.53.528280.210.6
6Kai ForbathWAS1515100%11.53.52627-0.89.6
7Dan BaileyDAL272993.1%24332320.29.3
8Jason HansonDET283287.5%25.12.934340.28.8
9Connor BarthTAM232882.1%20.52.537370.27.7
10Greg ZuerleinSTL212972.4%18.72.321210.17.1
11Jay FeelyARI212487.5%18.82.223230.16.8
12Josh ScobeeJAX222491.7%19.62.41516-0.96.2
13Matt BryantATL313686.1%29.31.738380.25.4
14Rian LindellBUF202195.2%18.31.734340.25.2
15Nick NovakSDG151788.2%13.61.427270.24.2
16Alex HeneryPHI252889.3%23.51.52223-0.93.7
17Dan CarpenterMIA222781.5%21.20.826260.12.6
18Ryan SuccopKAN252986.2%24.20.816160.12.4
19Nate KaedingSDG77100%6.20.86602.4
20Josh BrownCIN66100%5.30.75502.2
21Robbie GouldCHI212584%20.50.533330.21.8
22Steven HauschkaSEA222588%20.91.13840-1.81.4
23Mike NugentCIN192382.6%18.60.435350.21.3
24Olindo MareCHI22100%1.80.21100.5
25Graham GanoCAR55100%4.60.41314-0.90.3
26Garrett HartleyNOR151883.3%15.1-0.148480.30.1
27Lawrence TynesNYG333984.6%33.1-0.138380.2-0.2
28Stephen GostkowskiNWE263281.3%26.2-0.260600.3-0.3
29Shayne GrahamHOU263281.3%26.2-0.244440.2-0.5
30Adam VinatieriIND243177.4%24.2-0.231310.2-0.5
31Matt PraterDEN232979.3%23.8-0.846460.3-2.2
32Nick FolkNYJ172277.3%17.8-0.828280.2-2.3
33Rob BironasTEN243080%24.9-0.929290.2-2.4
34Justin MedlockCAR71070%8.3-1.323230.1-3.9
35Billy CundiffWAS71258.3%9.3-2.317170.1-6.7
36David AkersSFO253571.4%28.2-3.240400.2-9.5
37Mason CrosbyGNB172958.6%21.3-4.339390.2-12.8

So Justin Tucker and Sebastian Janikowski have been the most valuable kickers this year — no surprise there, although Tucker is far from a household name. The worst two kickers won’t shock anyone who has watched much of the Packers or 49ers this year, as David Akers and especially Mason Crosby have been constant sources of frustration for their fans.

I’ll note that I am counting blocked field goals just like a regular miss. When I previewed the list to my brother, he was surprised to see Folk ranking 32nd, since he only missed five field goals. Well, two of them were blocked; if you removed those (and blamed them on the line instead of a low trajectory), he would be 17th (although in this one, I am only removing blocks for Folk). I’d also note that two of his other 3 misses hit the uprights, so I’m not surprised to see my brother (or any Jets fan) surprised to see Folk 32nd.

What if we look at expected field goals over average by distance?

RkNameTm19to2223to2627to3031to3435to3839to4243to4647to5051to5455to5859to6263to66FG Ov Avg
1Justin TuckerBAL00.10.10.10.401.60.11.40.6004.3
2Sebastian JanikowskiOAK0.10.10.20.40.40.60.30.70.81.2-0.3-0.24.3
3Blair WalshMIN00.1-0.80.10.70-0.71.12.31.2003.9
4Shaun SuishamPIT0.100.20.40.30.80.81.1-0.10003.6
6Kai ForbathWAS00.100.2001.12.200003.5
5Phil DawsonCLE00.1-0.80.40.410.30.71.40003.5
7Dan BaileyDAL0.10.10.10.50.40.80.50.7-0.20003
8Jason HansonDET000.10.50.10.61.4-0.20.40002.9
9Connor BarthTAM000.10.1-0.60.20.51.40.40.3002.5
12Josh ScobeeJAX0.10.100.30.40.80.11.10-0.4002.4
10Greg ZuerleinSTL000.10.2-1.70.40.81.40.8-0.10.7-0.32.3
11Jay FeelyARI000.20.2-0.3-0.80.31.50.500.702.2
13Matt BryantATL-0.900.20.3-0.31-0.4-0.30.91.2001.7
14Rian LindellBUF0000.5-0.51.200.400001.7
16Alex HeneryPHI0.10.10-0.70.51.20.10.70-0.4001.5
15Nick NovakSDG0.10.100.300.20.50.7-0.1-0.4001.4
22Steven HauschkaSEA0.10.10.10.50.30.40.3-0.3-0.10-0.301.1
17Dan CarpenterMIA000.10.40.11.40.8-1.9-0.20000.8
19Nate KaedingSDG00.10000.40.3000000.8
18Ryan SuccopKAN00-0.9-0.30.3-0.80.80.70.90000.8
20Josh BrownCIN00.100.200000.50000.7
21Robbie GouldCHI0.10.10-0.70.3-0.21.1-0.90.90000.5
25Graham GanoCAR00.100.200.20000000.4
23Mike NugentCIN0.10.10.10.10.4-0.2-0.5-0.200.6000.4
24Olindo MareCHI0000.2000000000.2
26Garrett HartleyNOR0.10.100.2-0.70.20-0.30.4000-0.1
27Lawrence TynesNYG00.2-0.70.3-0.10.4-0.21.1-1.1000-0.1
28Stephen GostkowskiNWE00.10.10.4-0.5-2.21.1-0.20.9000-0.2
30Adam VinatieriIND0.10.100.1-2.30.40.81.2-0.2-0.400-0.2
29Shayne GrahamHOU0.100.20.40.41-0.2-1.6-0.6000-0.2
31Matt PraterDEN0.10.10.1-0.20.10-0.6-1.31.4-0.400-0.8
32Nick FolkNYJ0.1-0.900.3-0.60.2-0.600.8000-0.8
33Rob BironasTEN00.10.10.30.8-0.4-1.5-0.30.5-0.400-0.9
34Justin MedlockCAR0000.30-0.8-0.2-0.60000-1.3
35Billy CundiffWAS000-1.80.4-0.40.300-0.4-0.30-2.3
36David AkersSFO000.3-0.60.7-1.8-0.9-0.3-1.1-0.400.8-3.2
37Mason CrosbyGNB00.10.1-0.7-0.7-0.2-1.51.2-1.7-0.800-4.3

Greg Zuerlein — or Greg the Leg, Young GZ, or Legatron, if you prefer — has cooled off since his hot start. He’s hit 3 of the successful field goals from 56+ yards this season, but all three came in September. Mason Crosby comes out as the worst kicker, and some have defended him because he’s mostly missed long field goals. While that’s somewhat true, this metric adjusts for distance, so he’s struggling even when you consider the difficulty of the kick.

Crosby is 1 for 8 when attempting field goals from 50+ yards, but the average kicker would have been successful on 4.2 field goals. He’s also missed from 32, 38, 42, 43, and 44 yards, and comes out as the worst kicker in the 43-to-46 range. David Akers tied an NFL record with a 63-yarder this year, but otherwise, he’s had a rough season. He’s missed six field goals from inside of 43 yards.

References

References
1 There is some bias in the data in that only the best distance kickers attempts long field goals, but dealing with that is best left for another day.
{ 2 comments }