
If you know nothing else about a game other than the quarterback threw for over 300 yards, would you bet that the team won the game?
On one hand, passing yards is correlated with production: all else being equal, more yards are better than fewer yards. On the other hand, we know that Game Scripts call for teams with a lead to throw less frequently than teams that trail; for the same reason that “teams that run 30+ times usually win”, you might be suspect about the fortunes of a team that threw for 300 yards.
And what about historically? Has the league-wide winning percentage changed over time for when a quarterback throws for 300 yards? Great questions! Let’s get some answers.
In 2019, teams went 70-66-1 when throwing for 300+ yards in a game. To be clear, this is gross passing yards: that is, this is the passing yards gained by the team without deducting sack yards lost. So, it appears that if you know nothing other than the fact that a team threw for 300+ yards in a game in 2019, you should guess that that team was victorious.
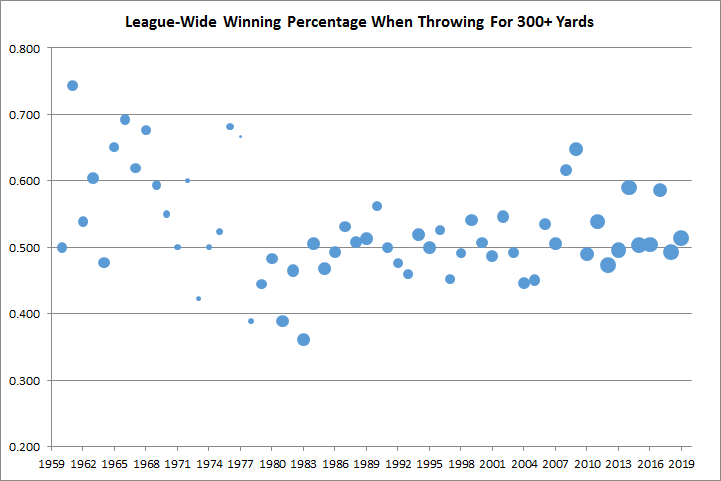
As it turns out, that same winning percentage generally holds over the last 60 years, although there is quite a bit of year to year variation. The graph below shows the winning team over 300+ yard passing teams in each season since 1960. Some years, like 1983, teams almost always lost when throwing for 300 yards. Other years, like several in the ’60s and 2009, teams had great records. In the graph below, the size of the bubble corresponds with how many 300+ passing yard games there were in each season. Obviously the bubbles are small in the dead-ball era of the ’70s, and much bigger now.
Here’s the same data, but if you remove games where both teams threw for 300+ yards.

And here’s the data in table form (including games where both teams threw for 300+ yards).
| Year | 300+ Yard Games | 300+ Yard Wins | Win % | League G | % of G w/ 300+ |
|---|---|---|---|---|---|
| 1960 | 33 | 16.5 | 50% | 268 | 12.3% |
| 1961 | 37 | 27.5 | 74.3% | 308 | 12% |
| 1962 | 39 | 21 | 53.8% | 308 | 12.7% |
| 1963 | 48 | 29 | 60.4% | 308 | 15.6% |
| 1964 | 43 | 20.5 | 47.7% | 308 | 14% |
| 1965 | 33 | 21.5 | 65.2% | 308 | 10.7% |
| 1966 | 39 | 27 | 69.2% | 336 | 11.6% |
| 1967 | 42 | 26 | 61.9% | 350 | 12% |
| 1968 | 34 | 23 | 67.6% | 364 | 9.3% |
| 1969 | 32 | 19 | 59.4% | 364 | 8.8% |
| 1970 | 20 | 11 | 55% | 364 | 5.5% |
| 1971 | 15 | 7.5 | 50% | 364 | 4.1% |
| 1972 | 10 | 6 | 60% | 364 | 2.7% |
| 1973 | 13 | 5.5 | 42.3% | 364 | 3.6% |
| 1974 | 13 | 6.5 | 50% | 364 | 3.6% |
| 1975 | 21 | 11 | 52.4% | 364 | 5.8% |
| 1976 | 22 | 15 | 68.2% | 392 | 5.6% |
| 1977 | 6 | 4 | 66.7% | 392 | 1.5% |
| 1978 | 18 | 7 | 38.9% | 448 | 4% |
| 1979 | 54 | 24 | 44.4% | 448 | 12.1% |
| 1980 | 61 | 29.5 | 48.4% | 448 | 13.6% |
| 1981 | 72 | 28 | 38.9% | 448 | 16.1% |
| 1982 | 43 | 20 | 46.5% | 252 | 17.1% |
| 1983 | 83 | 30 | 36.1% | 448 | 18.5% |
| 1984 | 82 | 41.5 | 50.6% | 448 | 18.3% |
| 1985 | 79 | 37 | 46.8% | 448 | 17.6% |
| 1986 | 74 | 36.5 | 49.3% | 448 | 16.5% |
| 1987 | 64 | 34 | 53.1% | 420 | 15.2% |
| 1988 | 66 | 33.5 | 50.8% | 448 | 14.7% |
| 1989 | 76 | 39 | 51.3% | 448 | 17% |
| 1990 | 48 | 27 | 56.3% | 448 | 10.7% |
| 1991 | 60 | 30 | 50% | 448 | 13.4% |
| 1992 | 42 | 20 | 47.6% | 448 | 9.4% |
| 1993 | 50 | 23 | 46% | 448 | 11.2% |
| 1994 | 79 | 41 | 51.9% | 448 | 17.6% |
| 1995 | 90 | 45 | 50% | 480 | 18.8% |
| 1996 | 57 | 30 | 52.6% | 480 | 11.9% |
| 1997 | 52 | 23.5 | 45.2% | 480 | 10.8% |
| 1998 | 59 | 29 | 49.2% | 480 | 12.3% |
| 1999 | 85 | 46 | 54.1% | 496 | 17.1% |
| 2000 | 71 | 36 | 50.7% | 496 | 14.3% |
| 2001 | 76 | 37 | 48.7% | 496 | 15.3% |
| 2002 | 87 | 47.5 | 54.6% | 512 | 17% |
| 2003 | 61 | 30 | 49.2% | 512 | 11.9% |
| 2004 | 83 | 37 | 44.6% | 512 | 16.2% |
| 2005 | 71 | 32 | 45.1% | 512 | 13.9% |
| 2006 | 71 | 38 | 53.5% | 512 | 13.9% |
| 2007 | 91 | 46 | 50.5% | 512 | 17.8% |
| 2008 | 82 | 50.5 | 61.6% | 512 | 16% |
| 2009 | 108 | 70 | 64.8% | 512 | 21.1% |
| 2010 | 102 | 50 | 49% | 512 | 19.9% |
| 2011 | 128 | 69 | 53.9% | 512 | 25% |
| 2012 | 132 | 62.5 | 47.3% | 512 | 25.8% |
| 2013 | 132 | 65.5 | 49.6% | 512 | 25.8% |
| 2014 | 133 | 78.5 | 59% | 512 | 26% |
| 2015 | 145 | 73 | 50.3% | 512 | 28.3% |
| 2016 | 131 | 66 | 50.4% | 512 | 25.6% |
| 2017 | 104 | 61 | 58.7% | 512 | 20.3% |
| 2018 | 146 | 72 | 49.3% | 512 | 28.5% |
| 2019 | 138 | 71 | 51.4% | 512 | 27% |
And here’s the data in table form (excluding games where both teams threw for 300+ yards).
| Year | 300+ Yard Games | 300+ Yard Wins | Win % | League G | % of G w/ 300+ |
|---|---|---|---|---|---|
| 1960 | 31 | 15.5 | 50% | 268 | 11.6% |
| 1961 | 33 | 25.5 | 77.3% | 308 | 10.7% |
| 1962 | 31 | 17 | 54.8% | 308 | 10.1% |
| 1963 | 40 | 25 | 62.5% | 308 | 13% |
| 1964 | 27 | 12.5 | 46.3% | 308 | 8.8% |
| 1965 | 31 | 20.5 | 66.1% | 308 | 10.1% |
| 1966 | 35 | 25 | 71.4% | 336 | 10.4% |
| 1967 | 32 | 21 | 65.6% | 350 | 9.1% |
| 1968 | 26 | 19 | 73.1% | 364 | 7.1% |
| 1969 | 24 | 15 | 62.5% | 364 | 6.6% |
| 1970 | 20 | 11 | 55% | 364 | 5.5% |
| 1971 | 13 | 6.5 | 50% | 364 | 3.6% |
| 1972 | 8 | 5 | 62.5% | 364 | 2.2% |
| 1973 | 13 | 5.5 | 42.3% | 364 | 3.6% |
| 1974 | 13 | 6.5 | 50% | 364 | 3.6% |
| 1975 | 19 | 10 | 52.6% | 364 | 5.2% |
| 1976 | 22 | 15 | 68.2% | 392 | 5.6% |
| 1977 | 6 | 4 | 66.7% | 392 | 1.5% |
| 1978 | 16 | 6 | 37.5% | 448 | 3.6% |
| 1979 | 44 | 19 | 43.2% | 448 | 9.8% |
| 1980 | 47 | 22.5 | 47.9% | 448 | 10.5% |
| 1981 | 52 | 18 | 34.6% | 448 | 11.6% |
| 1982 | 35 | 16 | 45.7% | 252 | 13.9% |
| 1983 | 53 | 15 | 28.3% | 448 | 11.8% |
| 1984 | 62 | 31.5 | 50.8% | 448 | 13.8% |
| 1985 | 49 | 22 | 44.9% | 448 | 10.9% |
| 1986 | 60 | 29.5 | 49.2% | 448 | 13.4% |
| 1987 | 48 | 26 | 54.2% | 420 | 11.4% |
| 1988 | 48 | 24.5 | 51% | 448 | 10.7% |
| 1989 | 62 | 32 | 51.6% | 448 | 13.8% |
| 1990 | 40 | 23 | 57.5% | 448 | 8.9% |
| 1991 | 48 | 24 | 50% | 448 | 10.7% |
| 1992 | 38 | 18 | 47.4% | 448 | 8.5% |
| 1993 | 40 | 18 | 45% | 448 | 8.9% |
| 1994 | 57 | 30 | 52.6% | 448 | 12.7% |
| 1995 | 66 | 33 | 50% | 480 | 13.8% |
| 1996 | 37 | 20 | 54.1% | 480 | 7.7% |
| 1997 | 44 | 19.5 | 44.3% | 480 | 9.2% |
| 1998 | 53 | 26 | 49.1% | 480 | 11% |
| 1999 | 61 | 34 | 55.7% | 496 | 12.3% |
| 2000 | 55 | 28 | 50.9% | 496 | 11.1% |
| 2001 | 64 | 31 | 48.4% | 496 | 12.9% |
| 2002 | 71 | 39.5 | 55.6% | 512 | 13.9% |
| 2003 | 55 | 27 | 49.1% | 512 | 10.7% |
| 2004 | 65 | 28 | 43.1% | 512 | 12.7% |
| 2005 | 59 | 26 | 44.1% | 512 | 11.5% |
| 2006 | 57 | 31 | 54.4% | 512 | 11.1% |
| 2007 | 71 | 36 | 50.7% | 512 | 13.9% |
| 2008 | 72 | 45.5 | 63.2% | 512 | 14.1% |
| 2009 | 84 | 58 | 69% | 512 | 16.4% |
| 2010 | 74 | 36 | 48.6% | 512 | 14.5% |
| 2011 | 74 | 42 | 56.8% | 512 | 14.5% |
| 2012 | 84 | 38.5 | 45.8% | 512 | 16.4% |
| 2013 | 84 | 41.5 | 49.4% | 512 | 16.4% |
| 2014 | 93 | 58.5 | 62.9% | 512 | 18.2% |
| 2015 | 83 | 42 | 50.6% | 512 | 16.2% |
| 2016 | 77 | 39 | 50.6% | 512 | 15% |
| 2017 | 78 | 48 | 61.5% | 512 | 15.2% |
| 2018 | 88 | 43 | 48.9% | 512 | 17.2% |
| 2019 | 84 | 44 | 52.4% | 512 | 16.4% |
As always, please leave your thoughts in the comments.