
It was the greatest passing season in NFL history… again. More on that in a moment, but first, let’s marvel at the game’s two best players. Aaron Rodgers and Patrick Mahomes were the top two quarterbacks in 2020, and the former MVPs both had magnificent seasons. Unfortunately for Mahomes, he faded slightly down the stretch, while Rodgers went into hyperdrive, throwing 8 TDs and nearly averaging 10 yards per attempt over his final two games.
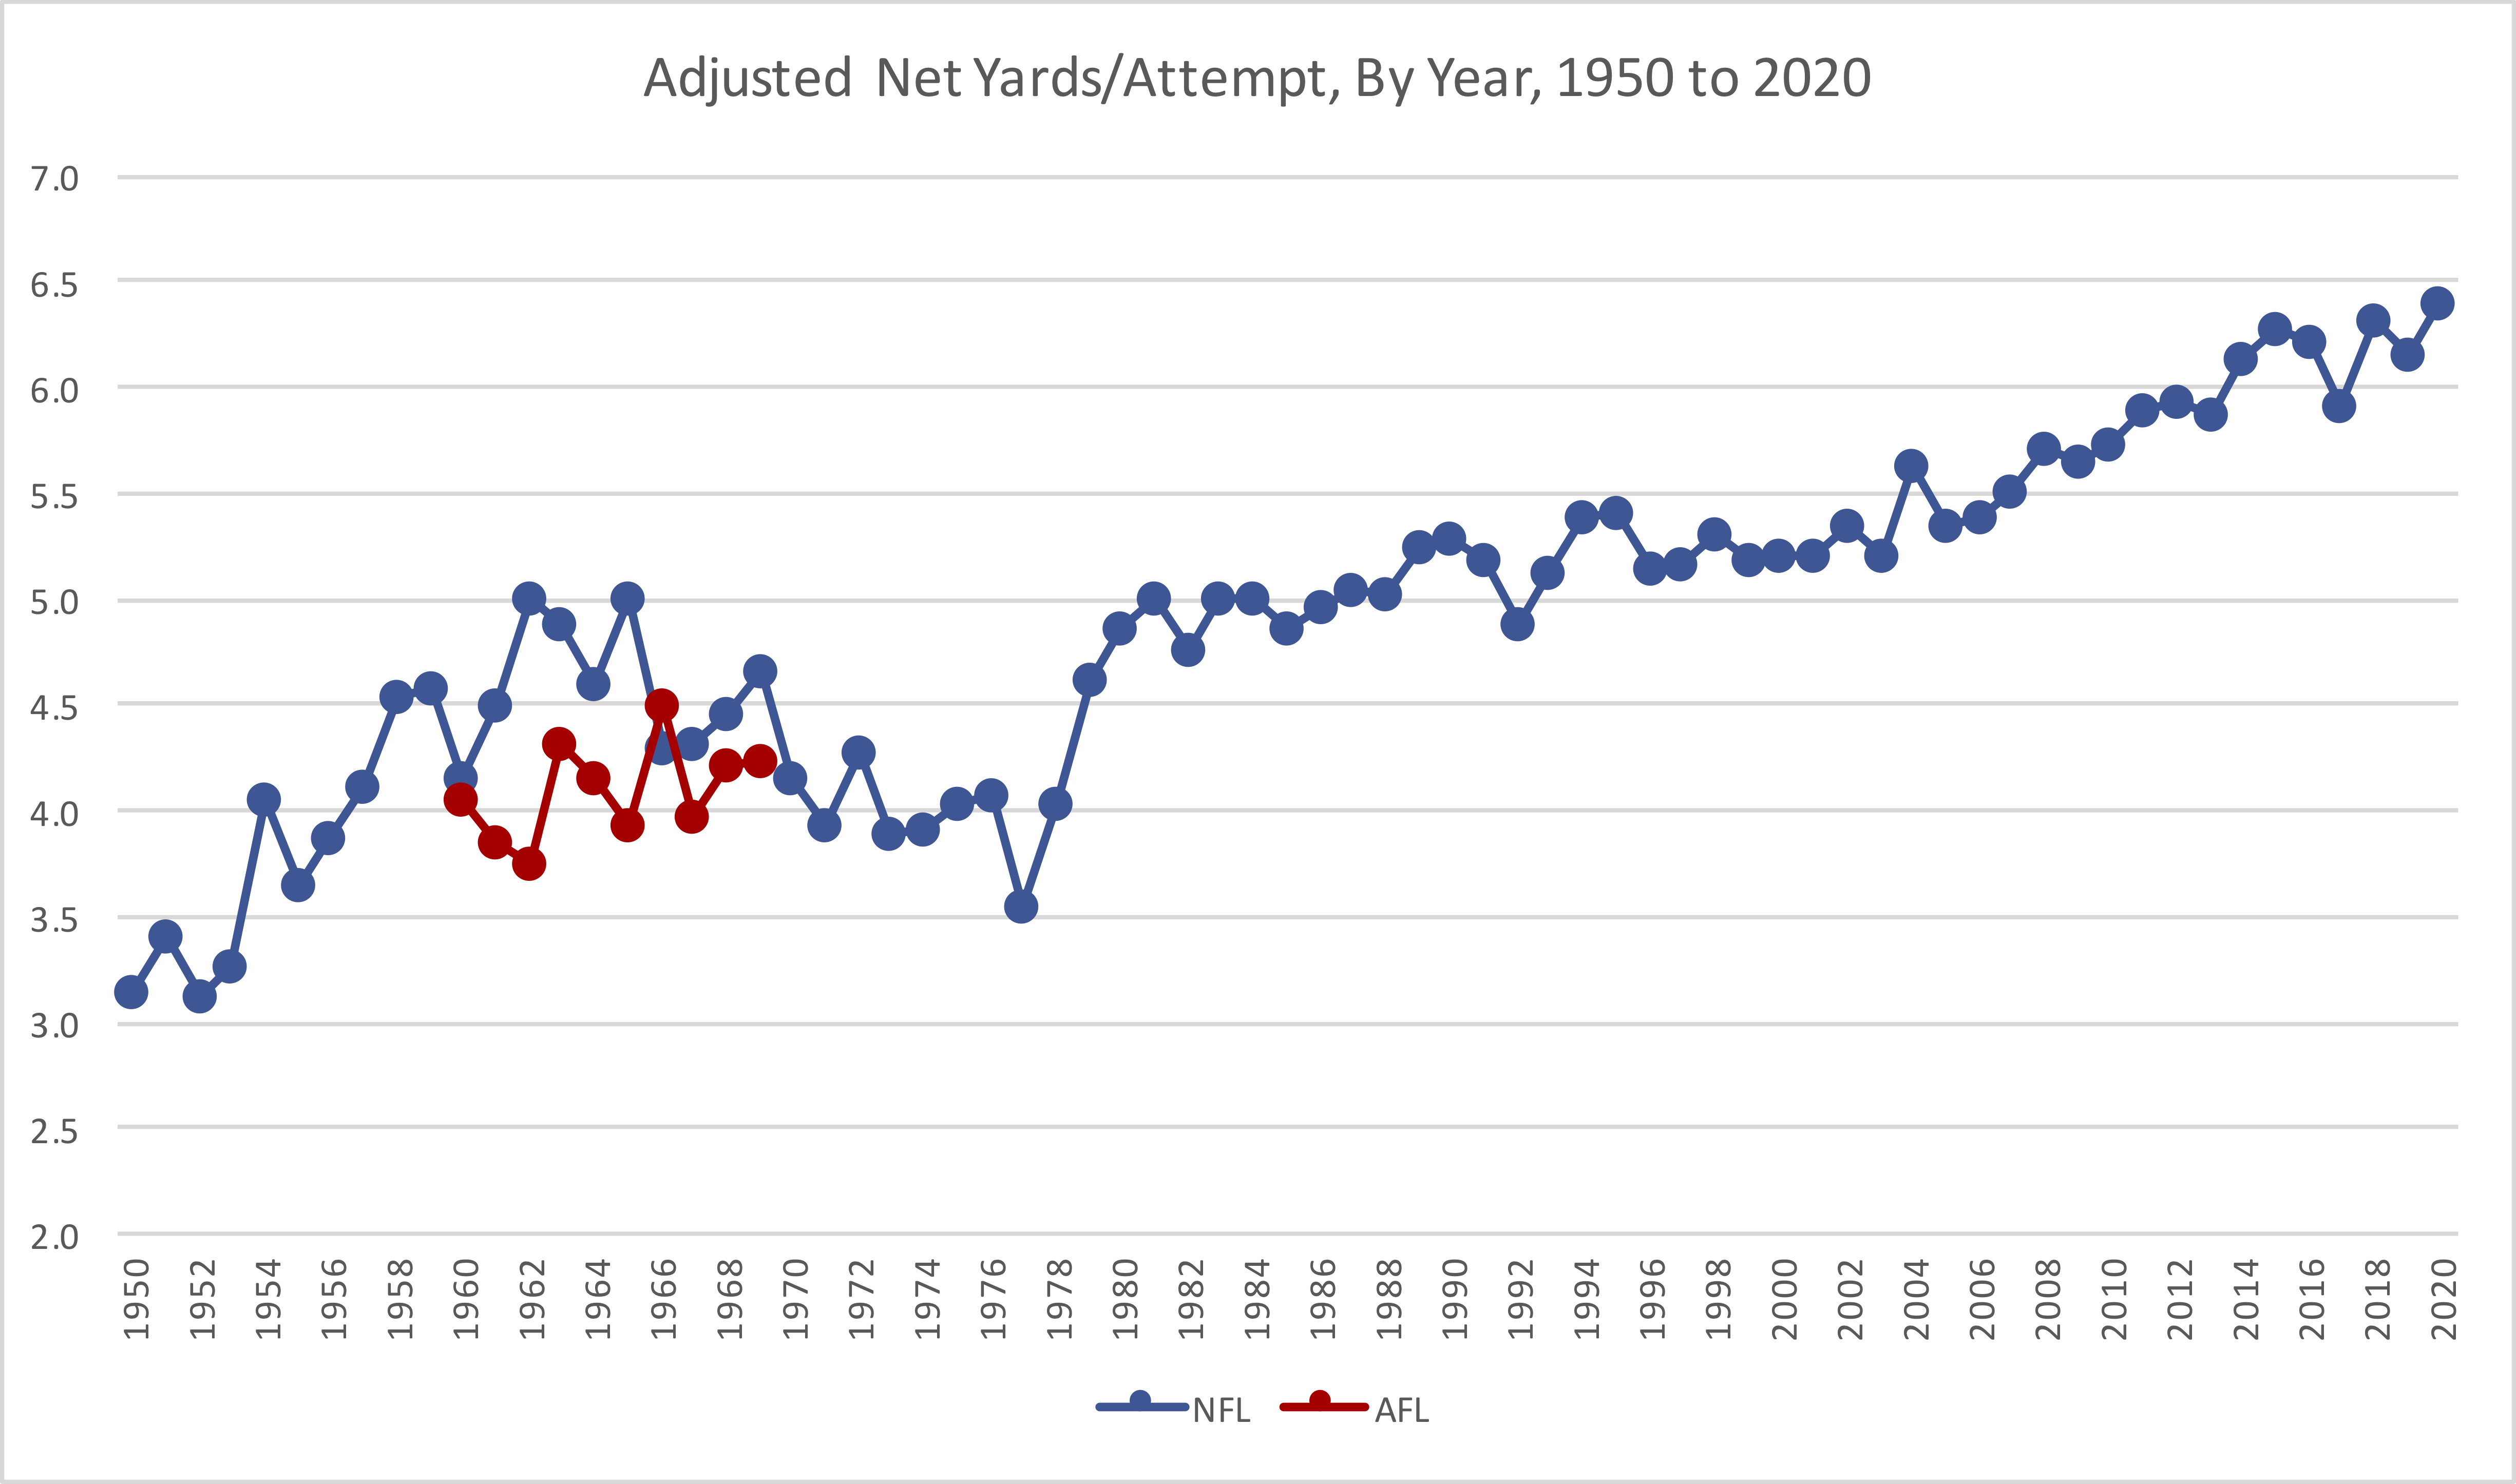
In 2020, the league average was 6.40 ANY/A, the highest rate in NFL history. Rodgers averaged 8.89 Adjusted Net Yards per Attempt, a number that historians might feel sounds familiar: it’s the exact same number Mahomes averaged in his MVP campaign in 2018. In 2007, Tom Brady averaged 8.88 ANY/A, and in 2013, Peyton Manning averaged 8.87 ANY/A. It doesn’t quite crack the top 5 in this metric since 1970, or even make it the best season for Rodgers: he averaged 9.39 ANY/A in 2011.
But with an 8.89 ANY/A average on 546 dropbacks (526 pass attempts plus 20 sacks); since Rodgers averaged 2.49 ANY/A more than league average, we multiply those two numbers to conclude that Rodgers added 1,355 adjusted net yards of passing value over average. [1]That number is outstanding, but not all that noteworthy from a historical perspective. It 30th in history, in a near dead heat with Philip Rivers, 2009. From 2004 to 2019, there were 15 QBs who … Continue reading Mahomes averaged an excellent 8.33 ANY/A, or 1.93 ANY/A better than league average. He had more dropbacks than Rodgers (610), but that wasn’t enough to overcome the efficiency gap; Mahomes produced 1,176 yards of passing value over average. Deshaun Watson (8.22 ANY/A, 593 dropbacks, 1,077 yards of value over average) ranked 3rd in the greatest season by a QB who went 4-12 in NFL history.
But the Mahomes/Rodgers race was the story of the second half of the season. In the chart below, I’ve shown how much cumulative value they provided by week, with Rodgers ultimately pulling ahead only in the final two weeks (and Mahomes, of course, sat in week 17).

Statistically speaking, it’s a narrow but clear win for Rodgers. In addition to leading the NFL in both ANY/A and Value, he also finished first in completion percentage and interception rate and touchdown rate. In fact, Rodgers joined Steve Young (1992) as the only quarterbacks since World War II to lead the NFL in completion percentage, interception rate, and touchdown rate in the same season.
Here are the full passing stats for each quarterback who threw 224 pass attempts in 2020.
| Rk | Quarterback | Tm | Age | Att | Yds | TD | Int | Sk | Yds | ANY/A | Value |
|---|---|---|---|---|---|---|---|---|---|---|---|
| 1 | Aaron Rodgers * | GNB | 37 | 526 | 4299 | 48 | 5 | 20 | 182 | 8.89 | 1355 |
| 2 | Patrick Mahomes * | KAN | 25 | 588 | 4740 | 38 | 6 | 22 | 147 | 8.33 | 1176 |
| 3 | Deshaun Watson * | HOU | 25 | 544 | 4823 | 33 | 7 | 49 | 293 | 8.22 | 1077 |
| 4 | Josh Allen * | BUF | 24 | 572 | 4544 | 37 | 10 | 26 | 159 | 7.82 | 845 |
| 5 | Ryan Tannehill | TEN | 32 | 481 | 3819 | 33 | 7 | 24 | 173 | 7.9 | 757 |
| 6 | Tom Brady | TAM | 43 | 610 | 4633 | 40 | 12 | 21 | 143 | 7.53 | 709 |
| 7 | Derek Carr | LVR | 29 | 517 | 4103 | 27 | 9 | 26 | 150 | 7.53 | 610 |
| 8 | Kirk Cousins | MIN | 32 | 516 | 4265 | 35 | 13 | 39 | 256 | 7.43 | 569 |
| 9 | Drew Brees | NOR | 41 | 390 | 2942 | 24 | 6 | 13 | 89 | 7.6 | 482 |
| 10 | Philip Rivers | IND | 39 | 543 | 4169 | 24 | 11 | 19 | 118 | 7.18 | 437 |
| 11 | Baker Mayfield | CLE | 25 | 486 | 3563 | 26 | 8 | 26 | 162 | 6.96 | 282 |
| 12 | Matthew Stafford | DET | 32 | 528 | 4084 | 26 | 10 | 38 | 254 | 6.89 | 275 |
| 13 | Justin Herbert | LAC | 22 | 595 | 4336 | 31 | 10 | 32 | 218 | 6.84 | 272 |
| 14 | Russell Wilson * | SEA | 32 | 558 | 4212 | 40 | 13 | 47 | 301 | 6.82 | 251 |
| 15 | Ryan Fitzpatrick | MIA | 38 | 267 | 2091 | 13 | 8 | 14 | 65 | 6.85 | 126 |
| 16 | Lamar Jackson | BAL | 23 | 376 | 2757 | 26 | 9 | 29 | 160 | 6.7 | 118 |
| 17 | Matt Ryan | ATL | 35 | 626 | 4581 | 26 | 11 | 41 | 257 | 6.52 | 77 |
| 18 | Kyler Murray * | ARI | 23 | 558 | 3971 | 26 | 12 | 27 | 176 | 6.45 | 28 |
| 19 | Teddy Bridgewater | CAR | 28 | 492 | 3733 | 15 | 11 | 31 | 205 | 6.37 | -17 |
| 20 | Gardner Minshew II | JAX | 24 | 327 | 2259 | 16 | 5 | 27 | 147 | 6.23 | -60 |
| 21 | Jared Goff | LAR | 26 | 552 | 3952 | 20 | 13 | 23 | 161 | 6.27 | -77 |
| 22 | Ben Roethlisberger | PIT | 38 | 608 | 3803 | 33 | 10 | 13 | 118 | 6.27 | -82 |
| 23 | Mitchell Trubisky | CHI | 26 | 297 | 2055 | 16 | 8 | 18 | 125 | 6 | -127 |
| 24 | Nick Mullens | SFO | 25 | 326 | 2437 | 12 | 12 | 19 | 139 | 5.79 | -212 |
| 25 | Joe Burrow | CIN | 24 | 404 | 2688 | 13 | 5 | 32 | 231 | 5.72 | -300 |
| 26 | Tua Tagovailoa | MIA | 22 | 290 | 1814 | 11 | 5 | 20 | 136 | 5.4 | -312 |
| 27 | Andy Dalton | DAL | 33 | 333 | 2169 | 14 | 8 | 24 | 183 | 5.34 | -380 |
| 28 | Cam Newton | NWE | 31 | 368 | 2657 | 8 | 10 | 31 | 195 | 5.44 | -383 |
| 29 | Drew Lock | DEN | 24 | 443 | 2933 | 16 | 15 | 19 | 123 | 5.31 | -504 |
| 30 | Alex Smith | WAS | 36 | 252 | 1582 | 6 | 8 | 22 | 139 | 4.39 | -552 |
| 31 | Nick Foles | CHI | 31 | 312 | 1852 | 10 | 8 | 18 | 145 | 4.69 | -567 |
| 32 | Dwayne Haskins | WAS | 23 | 241 | 1439 | 5 | 7 | 20 | 141 | 4.15 | -589 |
| 33 | Daniel Jones | NYG | 23 | 448 | 2943 | 11 | 10 | 45 | 286 | 4.92 | -731 |
| 34 | Sam Darnold | NYJ | 23 | 364 | 2208 | 9 | 11 | 35 | 234 | 4.16 | -896 |
| 35 | Carson Wentz | PHI | 28 | 437 | 2620 | 16 | 15 | 50 | 326 | 3.98 | -1180 |
And here is the same data for the players who finished with at least 1 pass attempt but did not qualify for the passing crown. The notable case here is Dak Prescott, who played only 5 games but still threw 222 passes. His 7.72 ANY/A average would have ranked 6th overall.
| Quarterback | Tm | Age | Att | Yds | TD | Int | Sk | Yds | ANY/A | Value |
|---|---|---|---|---|---|---|---|---|---|---|
| Dak Prescott | DAL | 27 | 222 | 1856 | 9 | 4 | 10 | 66 | 7.72 | 304 |
| C.J. Beathard | SFO | 27 | 104 | 787 | 6 | 0 | 9 | 71 | 7.4 | 112 |
| Jakobi Meyers | NWE | 24 | 2 | 43 | 2 | 0 | 0 | 0 | 41.5 | 70 |
| Jarvis Landry | CLE | 28 | 4 | 74 | 1 | 0 | 0 | 0 | 23.5 | 68 |
| Blaine Gabbert | TAM | 31 | 16 | 143 | 2 | 0 | 1 | 7 | 10.35 | 67 |
| Jamison Crowder | NYJ | 27 | 1 | 43 | 1 | 0 | 0 | 0 | 63 | 57 |
| Russell Gage | ATL | 24 | 2 | 39 | 1 | 0 | 0 | 0 | 29.5 | 46 |
| Trace McSorley | BAL | 25 | 10 | 90 | 1 | 0 | 0 | 0 | 11 | 46 |
| Cole Beasley | BUF | 31 | 1 | 20 | 1 | 0 | 0 | 0 | 40 | 34 |
| Cedrick Wilson Jr. | DAL | 25 | 2 | 23 | 1 | 0 | 0 | 0 | 21.5 | 30 |
| Mason Rudolph | PIT | 25 | 43 | 324 | 2 | 1 | 1 | 8 | 7.07 | 29 |
| Chad Henne | KAN | 35 | 38 | 248 | 2 | 0 | 2 | 4 | 7.1 | 28 |
| Isaiah McKenzie | BUF | 25 | 1 | 12 | 1 | 0 | 0 | 0 | 32 | 26 |
| Julian Edelman | NWE | 34 | 2 | 38 | 0 | 0 | 0 | 0 | 19 | 25 |
| Matt Barkley | BUF | 30 | 21 | 197 | 1 | 1 | 1 | 7 | 7.5 | 24 |
| Zay Jones | LVR | 25 | 1 | 29 | 0 | 0 | 0 | 0 | 29 | 23 |
| Taylor Heinicke | WAS | 27 | 19 | 137 | 1 | 0 | 1 | 7 | 7.5 | 22 |
| Marcus Mariota | LVR | 27 | 28 | 226 | 1 | 1 | 0 | 0 | 7.18 | 22 |
| Logan Thomas | WAS | 29 | 1 | 28 | 0 | 0 | 0 | 0 | 28 | 22 |
| Andy Lee | ARI | 38 | 1 | 26 | 0 | 0 | 0 | 0 | 26 | 20 |
| Lynn Bowden Jr. | MIA | 23 | 2 | 32 | 0 | 0 | 0 | 0 | 16 | 19 |
| Odell Beckham Jr. | CLE | 28 | 1 | 18 | 0 | 0 | 0 | 0 | 18 | 12 |
| Joseph Charlton | CAR | 23 | 1 | 28 | 0 | 0 | 1 | 5 | 11.5 | 10 |
| Sam Koch | BAL | 38 | 1 | 15 | 0 | 0 | 0 | 0 | 15 | 9 |
| Greg Ward | PHI | 25 | 1 | 15 | 0 | 0 | 0 | 0 | 15 | 9 |
| Jaquan Johnson | BUF | 25 | 1 | 13 | 0 | 0 | 0 | 0 | 13 | 7 |
| Tommy Townsend | KAN | 24 | 1 | 13 | 0 | 0 | 0 | 0 | 13 | 7 |
| Golden Tate | NYG | 32 | 2 | 18 | 0 | 0 | 0 | 0 | 9 | 5 |
| Tyler Boyd | CIN | 26 | 2 | 16 | 0 | 0 | 0 | 0 | 8 | 3 |
| Tyrod Taylor | LAC | 31 | 30 | 208 | 0 | 0 | 2 | 1 | 6.47 | 2 |
| Kyle Allen | WAS | 24 | 87 | 610 | 4 | 1 | 7 | 44 | 6.39 | -1 |
| Easton Stick | LAC | 25 | 1 | 4 | 0 | 0 | 0 | 0 | 4 | -2 |
| A.J. McCarron | HOU | 30 | 1 | 20 | 0 | 0 | 1 | 12 | 4 | -5 |
| Jamal Agnew | DET | 25 | 1 | 0 | 0 | 0 | 0 | 0 | 0 | -6 |
| Keenan Allen * | LAC | 28 | 1 | 0 | 0 | 0 | 0 | 0 | 0 | -6 |
| Randall Cobb | HOU | 30 | 1 | 0 | 0 | 0 | 0 | 0 | 0 | -6 |
| Riley Dixon | NYG | 27 | 1 | 0 | 0 | 0 | 0 | 0 | 0 | -6 |
| Alex Erickson | CIN | 28 | 1 | 0 | 0 | 0 | 0 | 0 | 0 | -6 |
| Chris Jones | DAL | 31 | 1 | 0 | 0 | 0 | 0 | 0 | 0 | -6 |
| Brett Kern | TEN | 34 | 1 | 0 | 0 | 0 | 0 | 0 | 0 | -6 |
| D.J. Moore | CAR | 23 | 1 | 0 | 0 | 0 | 0 | 0 | 0 | -6 |
| Zach Pascal | IND | 26 | 1 | 0 | 0 | 0 | 0 | 0 | 0 | -6 |
| Isaiah Wright | WAS | 23 | 1 | 0 | 0 | 0 | 0 | 0 | 0 | -6 |
| Geno Smith | SEA | 30 | 5 | 33 | 0 | 0 | 1 | 3 | 5 | -8 |
| Travis Kelce* | KAN | 31 | 2 | 4 | 0 | 0 | 0 | 0 | 2 | -9 |
| Logan Woodside | TEN | 25 | 3 | 7 | 0 | 0 | 0 | 0 | 2.33 | -12 |
| Tyler Bray | CHI | 29 | 5 | 18 | 0 | 0 | 0 | 0 | 3.6 | -14 |
| Tyler Huntley | BAL | 22 | 5 | 15 | 0 | 0 | 0 | 0 | 3 | -17 |
| Case Keenum | CLE | 32 | 10 | 46 | 0 | 0 | 0 | 0 | 4.6 | -18 |
| Jameis Winston | NOR | 26 | 11 | 75 | 0 | 0 | 2 | 11 | 4.92 | -19 |
| Joshua Dobbs | PIT | 25 | 5 | 2 | 0 | 0 | 0 | 0 | 0.4 | -30 |
| Jimmy Garoppolo | SFO | 29 | 140 | 1096 | 7 | 5 | 11 | 77 | 6.19 | -33 |
| Taysom Hill | NOR | 30 | 121 | 928 | 4 | 2 | 14 | 87 | 6.16 | -34 |
| Nathan Peterman | LVR | 26 | 5 | 25 | 0 | 0 | 2 | 16 | 1.29 | -36 |
| Chris Streveler | ARI | 25 | 16 | 105 | 1 | 1 | 2 | 10 | 3.89 | -45 |
| Sammy Watkins | KAN | 27 | 1 | 0 | 0 | 1 | 0 | 0 | -45 | -51 |
| Garrett Gilbert | DAL | 29 | 38 | 243 | 1 | 1 | 2 | 23 | 4.88 | -61 |
| Jacoby Brissett | IND | 28 | 8 | 17 | 0 | 0 | 2 | 15 | 0.2 | -62 |
| David Blough | DET | 25 | 10 | 49 | 0 | 1 | 1 | 10 | -0.55 | -76 |
| John Wolford | LAR | 25 | 38 | 231 | 0 | 1 | 2 | 8 | 4.45 | -78 |
| Jalen Hurts | PHI | 22 | 148 | 1061 | 6 | 4 | 13 | 59 | 5.85 | -89 |
| Brian Hoyer | NWE | 35 | 24 | 130 | 0 | 1 | 2 | 18 | 2.58 | -100 |
| Brett Rypien | DEN | 24 | 40 | 295 | 2 | 4 | 1 | 0 | 3.78 | -108 |
| Nate Sudfeld | PHI | 27 | 12 | 32 | 0 | 1 | 2 | 16 | -2.07 | -119 |
| Joe Flacco | NYJ | 35 | 134 | 864 | 6 | 3 | 7 | 69 | 5.53 | -123 |
| Colt McCoy | NYG | 34 | 66 | 375 | 1 | 1 | 5 | 24 | 4.59 | -129 |
| Chase Daniel | DET | 34 | 43 | 264 | 1 | 2 | 3 | 29 | 3.59 | -130 |
| Kendall Hinton | DEN | 23 | 9 | 13 | 0 | 2 | 1 | 1 | -7.8 | -142 |
| Brandon Allen | CIN | 28 | 142 | 925 | 5 | 4 | 7 | 51 | 5.33 | -160 |
| Jarrett Stidham | NWE | 24 | 44 | 256 | 2 | 3 | 4 | 21 | 2.92 | -167 |
| Ben DiNucci | DAL | 24 | 43 | 219 | 0 | 0 | 7 | 73 | 2.92 | -174 |
| Jeff Driskel | DEN | 27 | 64 | 432 | 3 | 2 | 11 | 98 | 4.05 | -176 |
| Robert Griffin III | BAL | 30 | 14 | 42 | 0 | 2 | 3 | 20 | -4 | -177 |
| Ryan Finley | CIN | 26 | 32 | 164 | 1 | 2 | 9 | 63 | 0.76 | -232 |
| Phillip Walker | CAR | 25 | 56 | 368 | 1 | 5 | 4 | 31 | 2.2 | -252 |
| Mike Glennon | JAX | 31 | 179 | 1072 | 7 | 5 | 9 | 53 | 4.97 | -270 |
| Jake Luton | JAX | 24 | 110 | 624 | 2 | 6 | 7 | 52 | 2.92 | -407 |
Finally, let’s look at the league average ANY/A averages throughout history. The graph below shows the NFL (and AFL) ANY/A in each season since 1950. As you can see, 2020 was a record year.
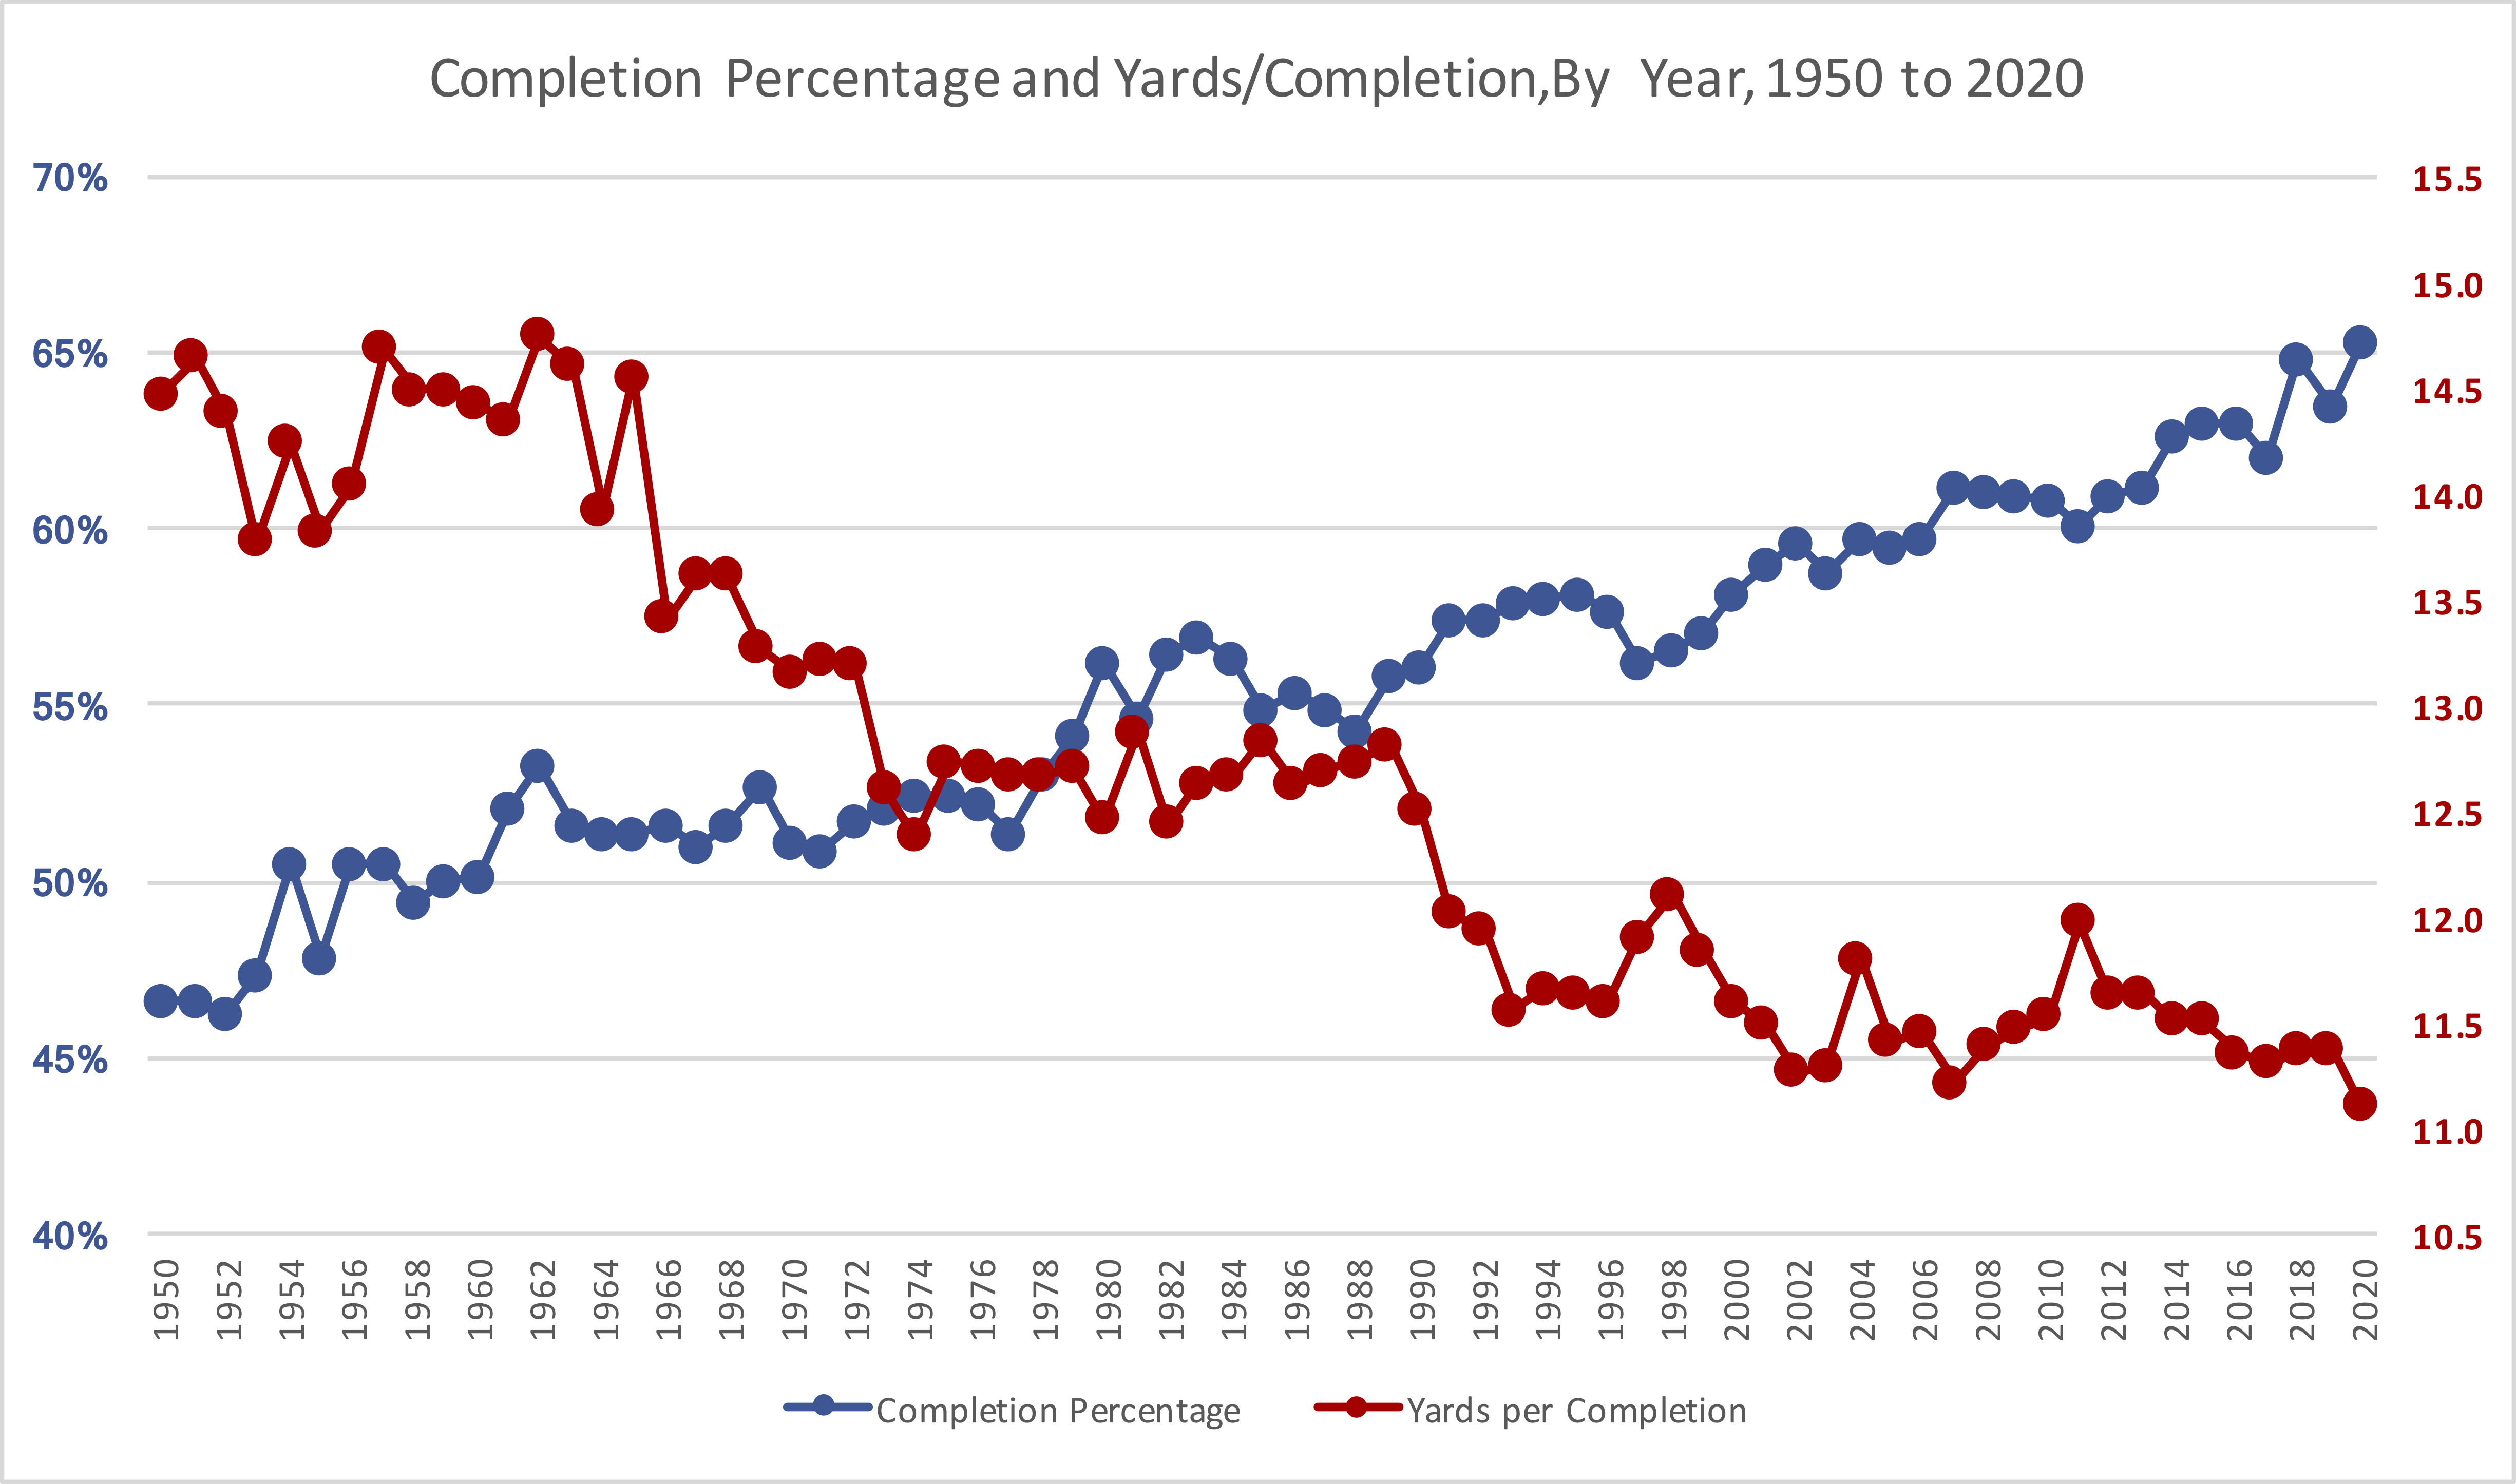
And I will close with one of my favorite charts every year, now updated for 2020. This shows the NFL averages in each season since 1950 for Completion Percentage in blue against the LEFT Y-Axis, and Yards per Completion in red against the RIGHT Y-Axis.
Please leave your thoughts in the comments.
References
| ↑1 | That number is outstanding, but not all that noteworthy from a historical perspective. It 30th in history, in a near dead heat with Philip Rivers, 2009. From 2004 to 2019, there were 15 QBs who qualified for the passing title and had a Relative ANY/A of at least 2.50, including most of the MVP seasons you can remember. Rodgers’s season numbers are outstanding, but the era is doing some of work in boosting his numbers; in other words, don’t listen to anyone who says this is one of the 10 greatest seasons in quarterback history, because it was not. |
|---|