
A few months ago, I calculated the concentration index for each passing offense in the NFL. For new readers, don’t be scared: a passing offense’s Concentration Index is simple to calculate, and it measures how concentrated a team’s passing offense is among a small or large number of players. To calculate, you take each player’s receiving yards and divide that by his team’s total receiving yards. Once you get that number, you square it, and then do that for each player on the offense and add the totals. The most concentrated passing offense in 2019 was in New Orleans. For the Saints, Michael Thomas gained 38.9%; the square of that is 15.2%. Jared Cook was second on the team with 705 yards, or 15.9% of the team’s receiving yards; the square of that number is 2.5%. Do this for every player, and the Saints have a total Concentration Index of 21.1%… which is highly concentrated, at least by 2019 standards. Here is the full table: [continue reading…]
Saints WR Michael Thomas had another dominant season in 2019. He easily led the NFL in receiving yards with 1,725, and he also was responsible for 38.9% of all Saints receiving yards. That was the largest percentage of a team’s receiving pie for any one player in 2019, followed by Bronco Courtland Sutton in a distant second place (32.7%), and Bears WR Allen Robinson (32.1%); only three other players (Buffalo’s John Brown, Cleveland’s Jarvis Landry, and Minnesota’s Stefon Diggs) topped 30%.
Regular readers know that I like to calculate something called the Concentration Index for passing offenses: it’s relatively simple to calculate, and it measures how concentrated a team’s passing offense is among a small or large number of players. To calculate, you simple take each player’s receiving yards, divide that by his team’s total receiving yards, square that result, and then add that number for each player on the offense. For the Saints, Thomas is at 38.9%; the square of that is 15.2%, so that’s the number we use. Jared Cook was second on the team with 705 yards, or 15.9% of the team’s receiving yards; the square of that number is 2.5%. Do this for every player, and the Saints have a total Concentration Index of 21.1%… which is highly concentrated. [continue reading…]
Last year at this time, I looked at which teams were spreading it around the most in their passing offenses. And this time last year, the Indianapolis Colts had the most diverse passing offense in the NFL. This season, that honor …. again belongs to the Colts.
T.Y. Hilton is the team’s leading receiver and has “only” 22% of the team’s receiving yards; Eric Ebron and and Zach Pascal are next on the team and neither has more than 13% of the team’s receiving yards. Indianapolis is the only team in the NFL where its top three leaders in receiving yards have less than half of the team’s receiving yards. The table below shows the Colts receivers; the final column is the square of the percentage of team’s receiving yards, which is how we calculate the concentration index. [continue reading…]
The New York Giants have a very top-heavy salary cap structure. The team’s top five 2019 salary cap hits belong to Eli Manning, Nate Solder, Janoris Jenkins, Alec Ogletree, and Kevin Zeitler, and total a whopping $76.7 million. Meanwhile, the Giants players with the 6th through 51st largest cap hits total just $71.5 million. That’s absurdly top-heavy (and comes after moving on from Damon Harrison, Olivier Vernon and Odell Beckham over the last few months). The Giants organization has really embraced a “star and duds” approach.
Consider the Buffalo Bills, whose top-5 largest 2019 cap hits belong to Star Lotulelei, Mitch Morse, Jerry Hughes, LeSean McCoy, and Trent Murphy and total $50.6M. The rest of the top 51 salary cap hits on the roster total $107.5M. The Bills do not have a single player with a 2019 salary cap hit of $11.8M or greater; meanwhile, every other team in the NFL has at least two such players.
The Giants and Bills are at the extreme ends of salary cap/roster construction. One way to measure how concentrated (or not concentrated) a team’s salary cap is by using the Concentration Index, described here. In short, we do the following steps:
1) Calculate the 2019 salary cap hit of the top 51 players on each team’s roster. Thanks to Over The Cap, I was able to collect this information.
2) For each player on each team, calculate the percentage of team salary cap dollars spent on that player. For example, Kirk Cousins of the Vikings has a 2019 cap hit of $29M, and the Vikings top 51 players have a cap hit of $184M. Therefore, Cousins is taking up 15.8% of Minnesota’s 2019 cap spend.
3) Square the result for each player (so Cousins’s 15.8% becomes 2.5%), and then sum those results for each player on each team to get team grades.
By squaring the results, you give more weight to players taking up a larger percentage of their team’s pie. Matthew Stafford ($29.5M cap charge) has both the highest 2019 Cap charge in the league and since the Lions top 51 players only have cap hits totaling $160M, has the highest percentage of team cap charge at 18.4%. When you square that result, you get 3.4%. Meanwhile, for Buffalo, Lotulelei’s $11.5M charge represents 7.3% of Buffalo’s top 51 largest cap hits, and then drops to just 0.5% when you square the result.
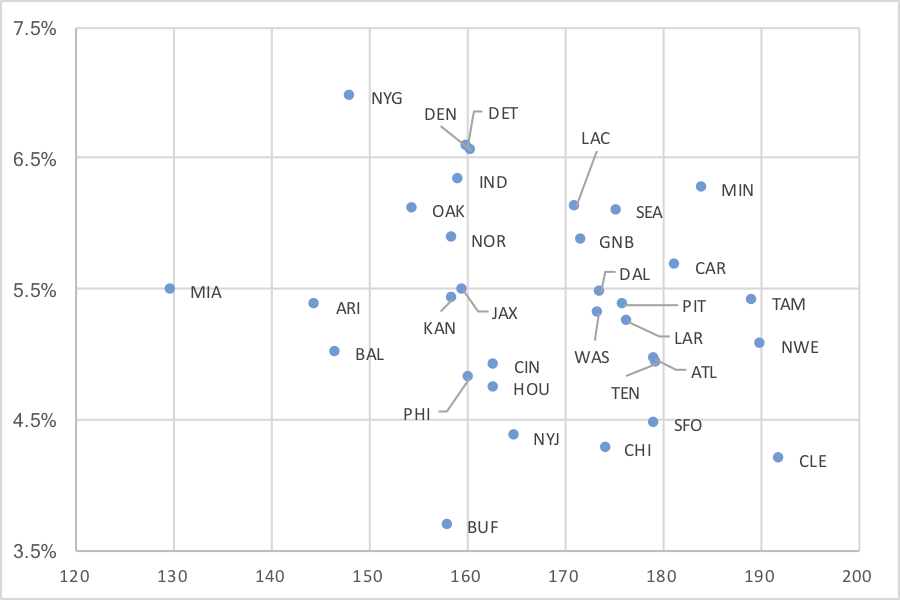
When you sum those squared results for each team, the Giants stand out as the team with the largest concentration of salary cap dollars in the fewest players, at 7.0%. Meanwhile, the Bills have dispersed their salary cap dollars in the widest manner, at just 3.7%.
Another interesting team is Cleveland. The Browns are similar to Buffalo, and have spread their salary cap dollars around: their concentration index is just 4.2%, the second lowest in the league. But Cleveland also has spent the most 2019 salary cap dollars on its top 51 players, at a whopping $192M! Think about what that means: the Browns are paying a ton of money to their players in the aggregate, but spreading it around a lot. That must mean that Cleveland is paying a lot of people good money, and well, that’s exactly what’s happening. The Browns are paying 14 players at least $6.6M in 2019 cap dollars. No other team has more than 11 such players.
The graph below shows the results of today’s post. The X-Axis shows the 2019 salary cap dollars each team has spent on its top 51 players (no dead money is included). The Y-Axis shows the concentration index for each team for these 51 players. As you can see, the Giants (highly concentrated) are at the top of the chart, the Bills are at the bottom, the Browns are at the far right (lots of $$ spent), and the Dolphins (little $$ spent) are at the far left.
Which teams are throwing the most to one receiver? Which teams are spreading it around the most? A good way to answer that is by using a Concentration Index. Let’s use Andrew Luck and the Indianapolis Colts as an example. Eric Ebron is the team’s leading receiver with 326 receiving yards, which represents 18.2% of the team’s total 1,796 receiving yards. To calculate a team’s concentration index in receiving yards, you need to square the percentage of receiving yards by each player, and sum the results. For example, 18.2% squared is 3.3%; do that for every player on Indianapolis and the total is 12.6%.

As it turns out, that’s the most diverse passing attack in the NFL. The most concentrated passing attack? That’s in Detroit:

The table below shows the concentration index for each team through six weeks, along with each team’s passing efficiency (as measured by ANY/A). Here’s how you read the top line. Detroit has the highest concentration index. The Lions have 1,404 receiving yards and have averaged 6.17 ANY/A, which ranks 20th in the NFL. Tate is the team’s leading receiver with 31% of the Lions receiving yards, and the team has a concentration index of 23%. [continue reading…]
Last year, I wrote about whether sacks are more highly concentrated among a few players now than they were in the ’80s or ’90s. Spoiler: the answer was no. But today I wanted to update that post for the 2017 season. Let’s use the Patriots as an example. New England defensive players recorded 41 sacks, but no player filled the shoes left by the departing Chandler Jones. In fact, no Patriots defensive player had even seven sacks. Trey Flowers led the team with 6.5 sacks, and Kyle Van Noy and Deatrich Wise Jr. were the only other players with more than four sacks.
How do you calculate a team’s concentration index? Flowers had 6.5 of the Patriots defenders’ 41 sacks [1]Note that the Patriots had one sack as a defense that was not assigned to any player, so the New England defense was credited with 42 sacks. For purposes of this post, I excluded sacks for all teams … Continue reading, or 15.9%. We square that number to calculate the concentration index; 15.9% squared is 2.5%. Do that for every player on the Patriots defense with at least one sack, and you get the following results:

New England stood out as the team with the least concentrated pass rush. And for the second year in a row, the Raiders (thanks to Khalil Mack and Bruce Irvin) stood out in the opposite direction. Only the Cardinals — who saw Chandler Jones (after being traded from the team with the least concentrated pass rush) lead the league with both 17.0 sacks and 46.0% of his team’s sacks — had a more concentrated pass rush in 2017.
| CI Rk | Team | Sacks | Sacks Rk | Conc Index |
|---|---|---|---|---|
| 1 | Cardinals | 37 | 17 | 24.7% |
| 2 | Raiders | 31 | 24 | 22.5% |
| 3 | Cowboys | 38 | 15 | 20.6% |
| 4 | Vikings | 36 | 19 | 19.9% |
| 5 | Giants | 27 | 29 | 19.3% |
| 6 | Dolphins | 30 | 26 | 18.4% |
| 7 | Chargers | 43 | 5 | 18.1% |
| 8 | Redskins | 41 | 9 | 17.8% |
| 9 | Lions | 35 | 20 | 17.8% |
| 10 | Jaguars | 55 | 2 | 16.5% |
| 11 | Buccaneers | 22 | 32 | 16.4% |
| 12 | Chiefs | 31 | 24 | 16.2% |
| 13 | Broncos | 33 | 22 | 15.6% |
| 14 | Bengals | 41 | 9 | 15.1% |
| 15 | Saints | 42 | 6 | 14.5% |
| 16 | Panthers | 50 | 3 | 14.5% |
| 17 | Ravens | 41 | 9 | 14.4% |
| 18 | Eagles | 38 | 15 | 13.5% |
| 19 | Seahawks | 39 | 13 | 13.2% |
| 20 | Falcons | 39 | 13 | 13.1% |
| 21 | Rams | 48 | 4 | 13.1% |
| 22 | Packers | 37 | 17 | 12.7% |
| 23 | Texans | 32 | 23 | 12.3% |
| 24 | Titans | 42 | 6 | 12% |
| 25 | Colts | 25 | 31 | 11.4% |
| 26 | Steelers | 56 | 1 | 11.4% |
| 27 | Browns | 34 | 21 | 10.9% |
| 28 | Bills | 26 | 30 | 10.7% |
| 29 | Jets | 28 | 28 | 10.6% |
| 30 | 49ers | 30 | 26 | 9.6% |
| 31 | Bears | 42 | 6 | 9.4% |
| 32 | Patriots | 41 | 9 | 9% |
| Average | 37.2 | 14.8% |
Overall, the league was slightly less concentrated (14.7%) than it was in 2016 (15.3%), but well within the normal range. Since 2002, the average team has had a pass rush concentration index of 15.0%.
There also, at least in 2017, wasn’t much of a correlation between having a lot of sacks and having a highly (or lowly) concentrated pass rush: The graph below plots team sacks on the X-Axis and Concentration Index on the Y-Axis.

What stands out to you?
References
| ↑1 | Note that the Patriots had one sack as a defense that was not assigned to any player, so the New England defense was credited with 42 sacks. For purposes of this post, I excluded sacks for all teams that were not assigned to a player. |
|---|