
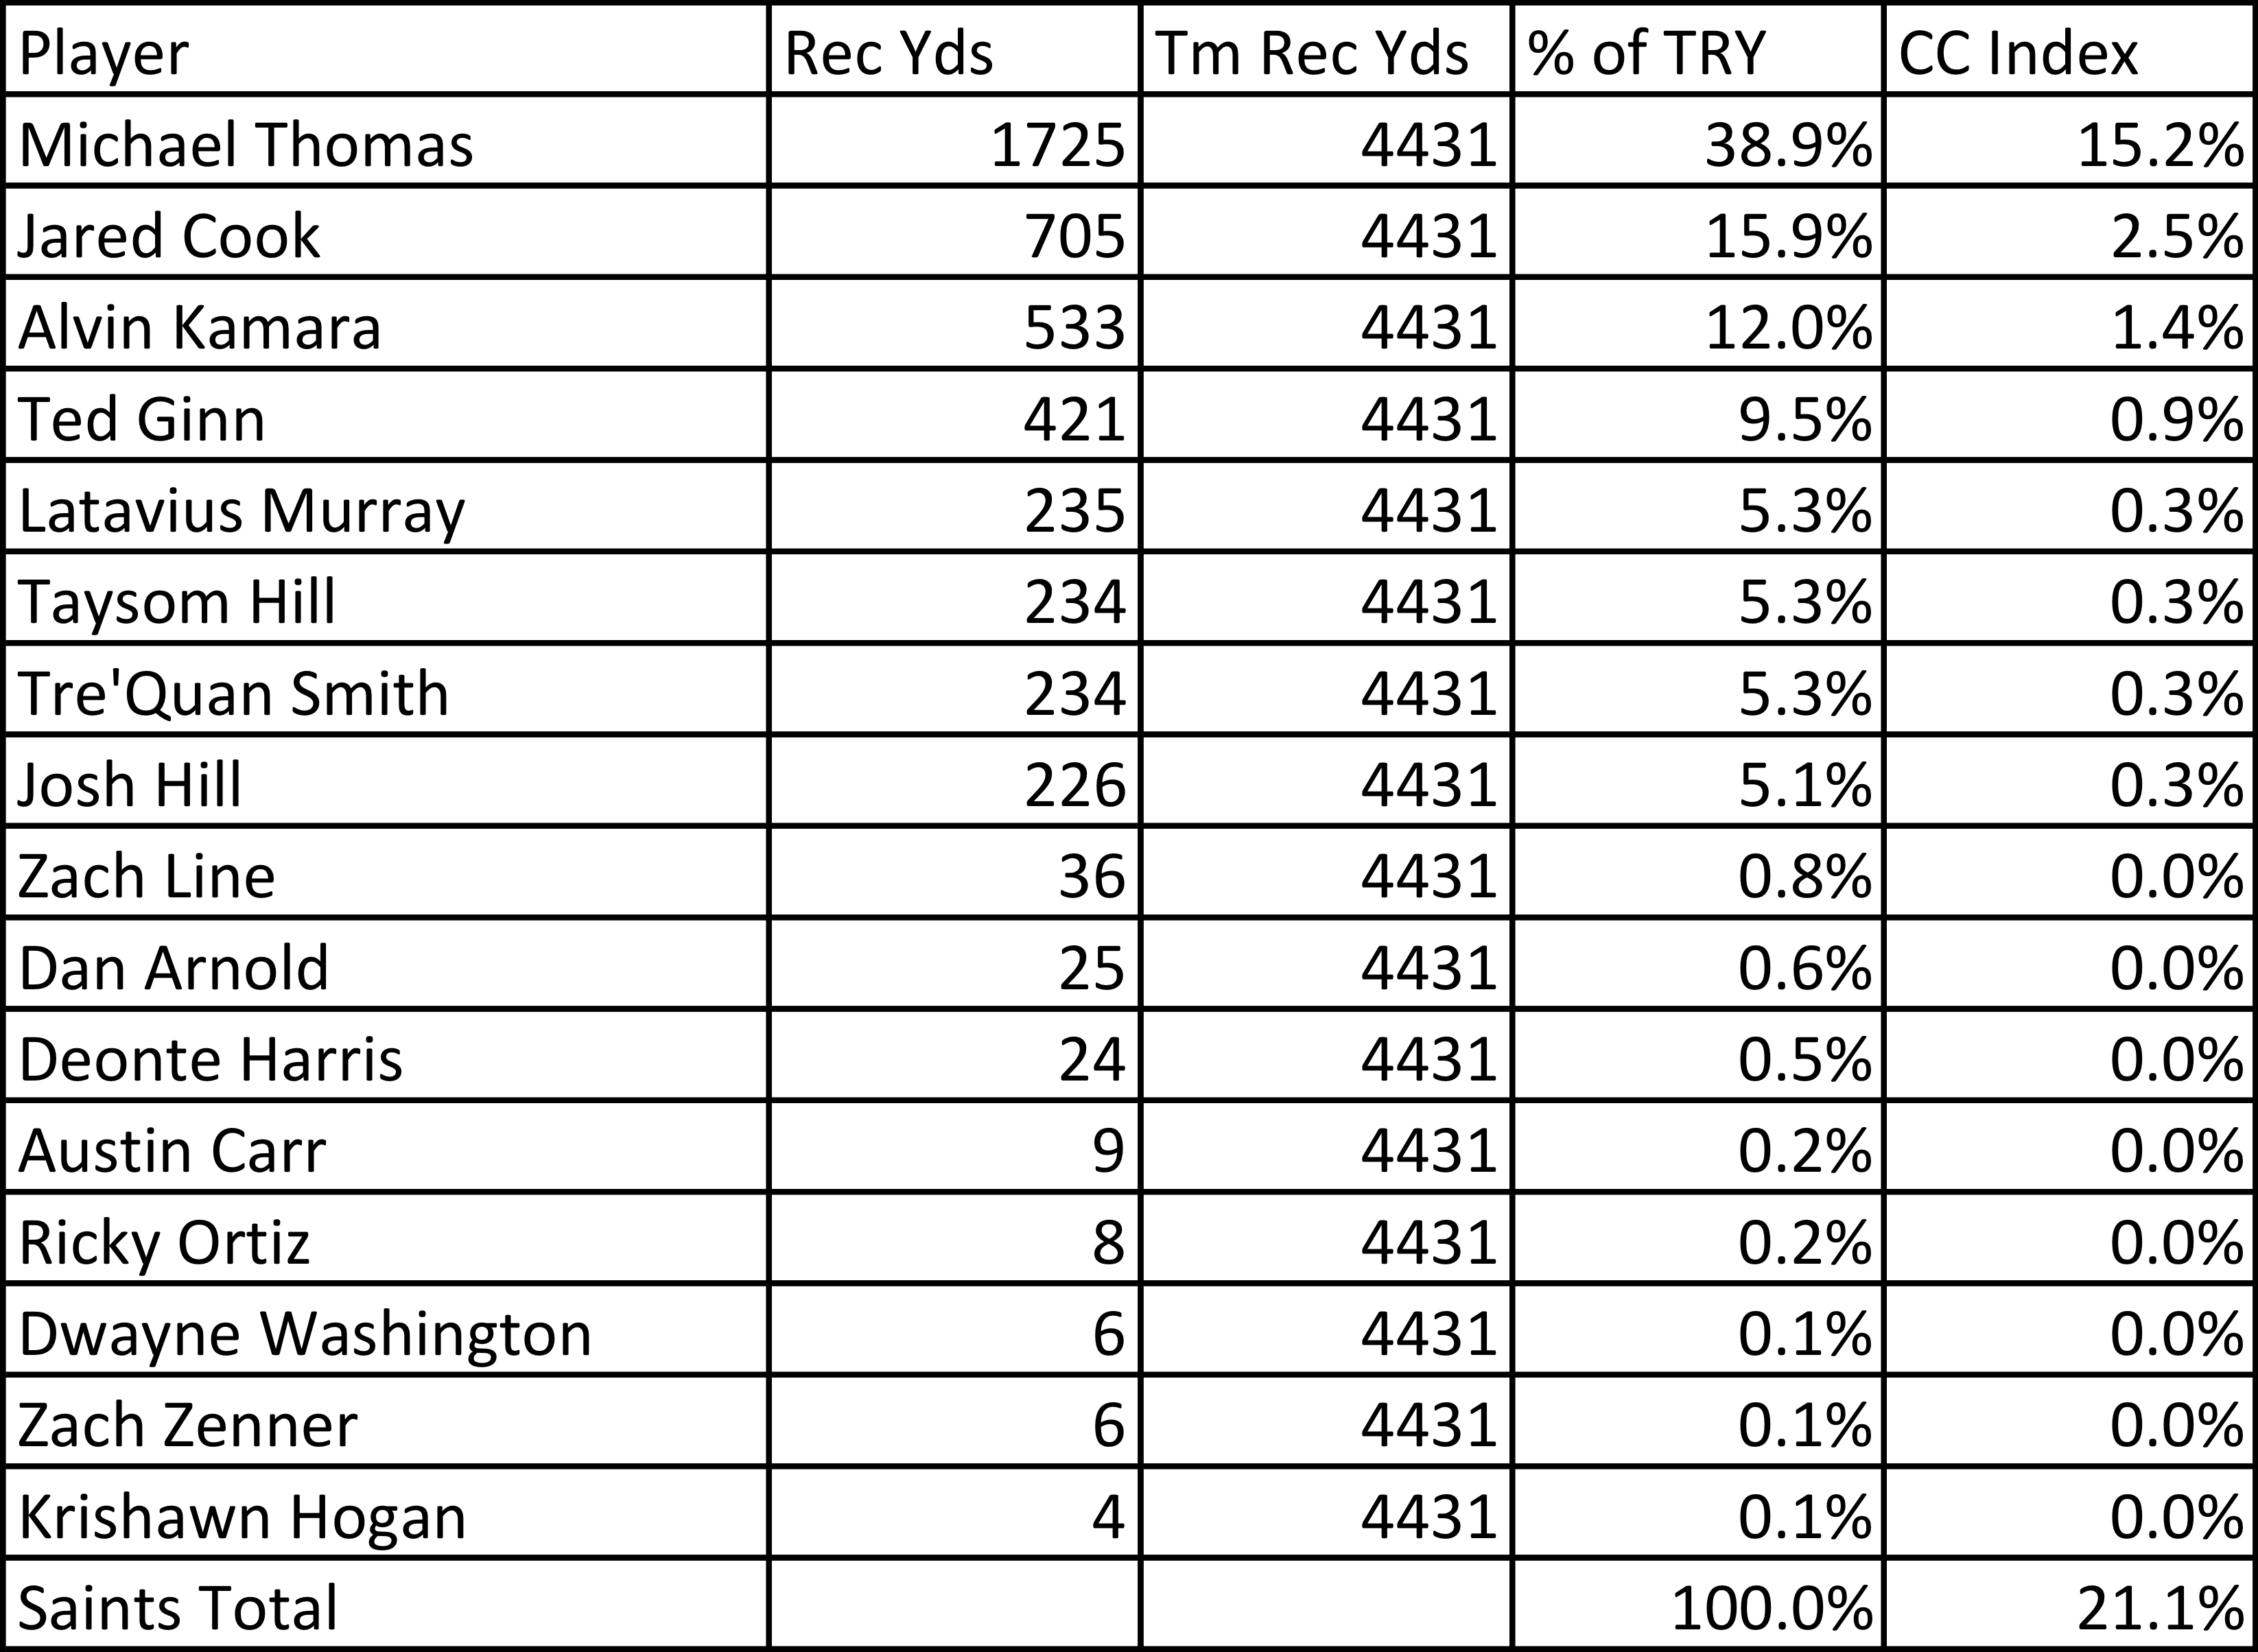
A few months ago, I calculated the concentration index for each passing offense in the NFL. For new readers, don’t be scared: a passing offense’s Concentration Index is simple to calculate, and it measures how concentrated a team’s passing offense is among a small or large number of players. To calculate, you take each player’s receiving yards and divide that by his team’s total receiving yards. Once you get that number, you square it, and then do that for each player on the offense and add the totals. The most concentrated passing offense in 2019 was in New Orleans. For the Saints, Michael Thomas gained 38.9%; the square of that is 15.2%. Jared Cook was second on the team with 705 yards, or 15.9% of the team’s receiving yards; the square of that number is 2.5%. Do this for every player, and the Saints have a total Concentration Index of 21.1%… which is highly concentrated, at least by 2019 standards. Here is the full table:
 The least-concentrated aerial attack in 2019 was the Colts, and you can see that breakdown here. On average, the 32 teams had a concentration index of 15.3%, or 0.153. In the abstract, that doesn’t mean much, but what if we calculate the average concentration index for the NFL (and AFL) for each season since 1950?
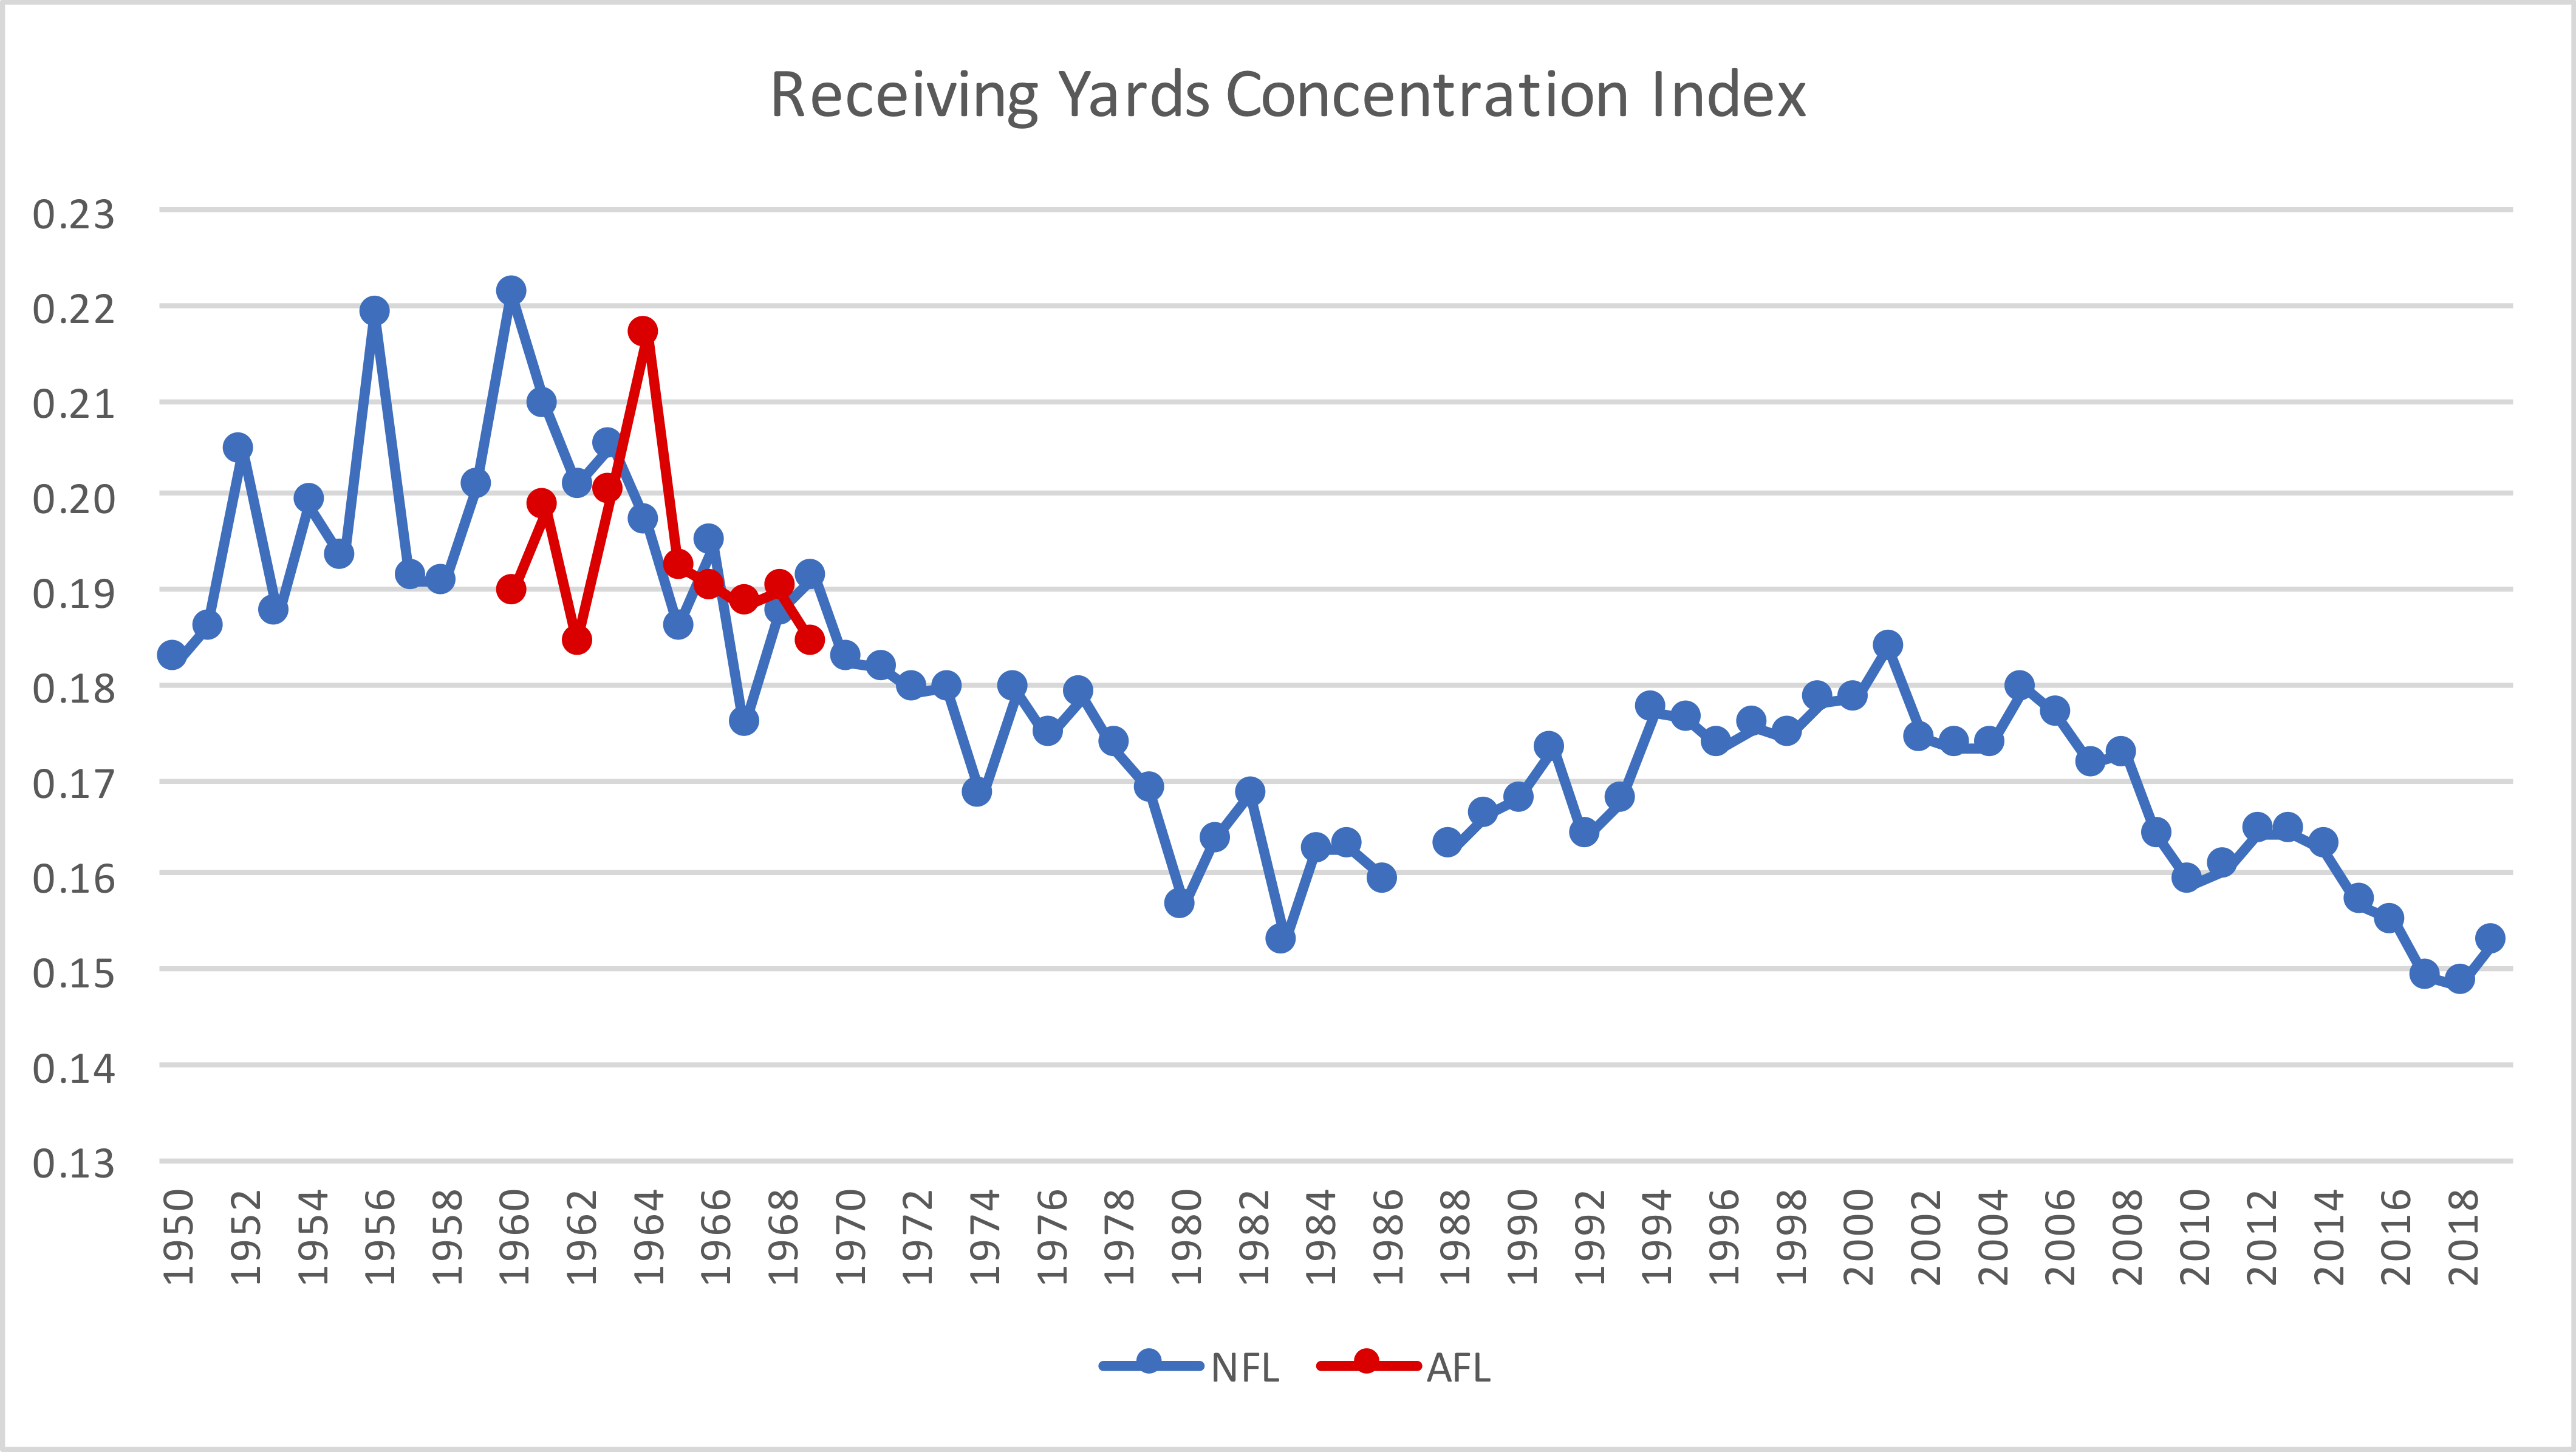 The two lowest seasons were 2018 (14.8%) and 2017 (14.9%), with 2019 and 1983 right behind those years. [1]Note that I excluded the 1987 season, which featured replacement players and therefore skewed the results; technically, the CC Index for the NFL that season was 12.9%. This means that teams are spreading the ball around much more than they used to, which is a noteworthy if unsurprising result.
It also explains why passing numbers have exploded but receiving numbers have not quite kept up in recent years. I looked at the top 10 leaders in receiving yards in each NFL season since 1950, and plotted that average in blue in the graph below against the Left Y-Axis. I also calculated the average gross passing yards for the top 10 passing offenses in each NFL season, and plotted that in red against the Right Y-Axis. While there is normally a close correlation, you can see that in recent years, the blue line is below the red one. Meanwhile, in 1995, the top receivers had astronomical seasons, while gross passing numbers were not out of line with historical numbers.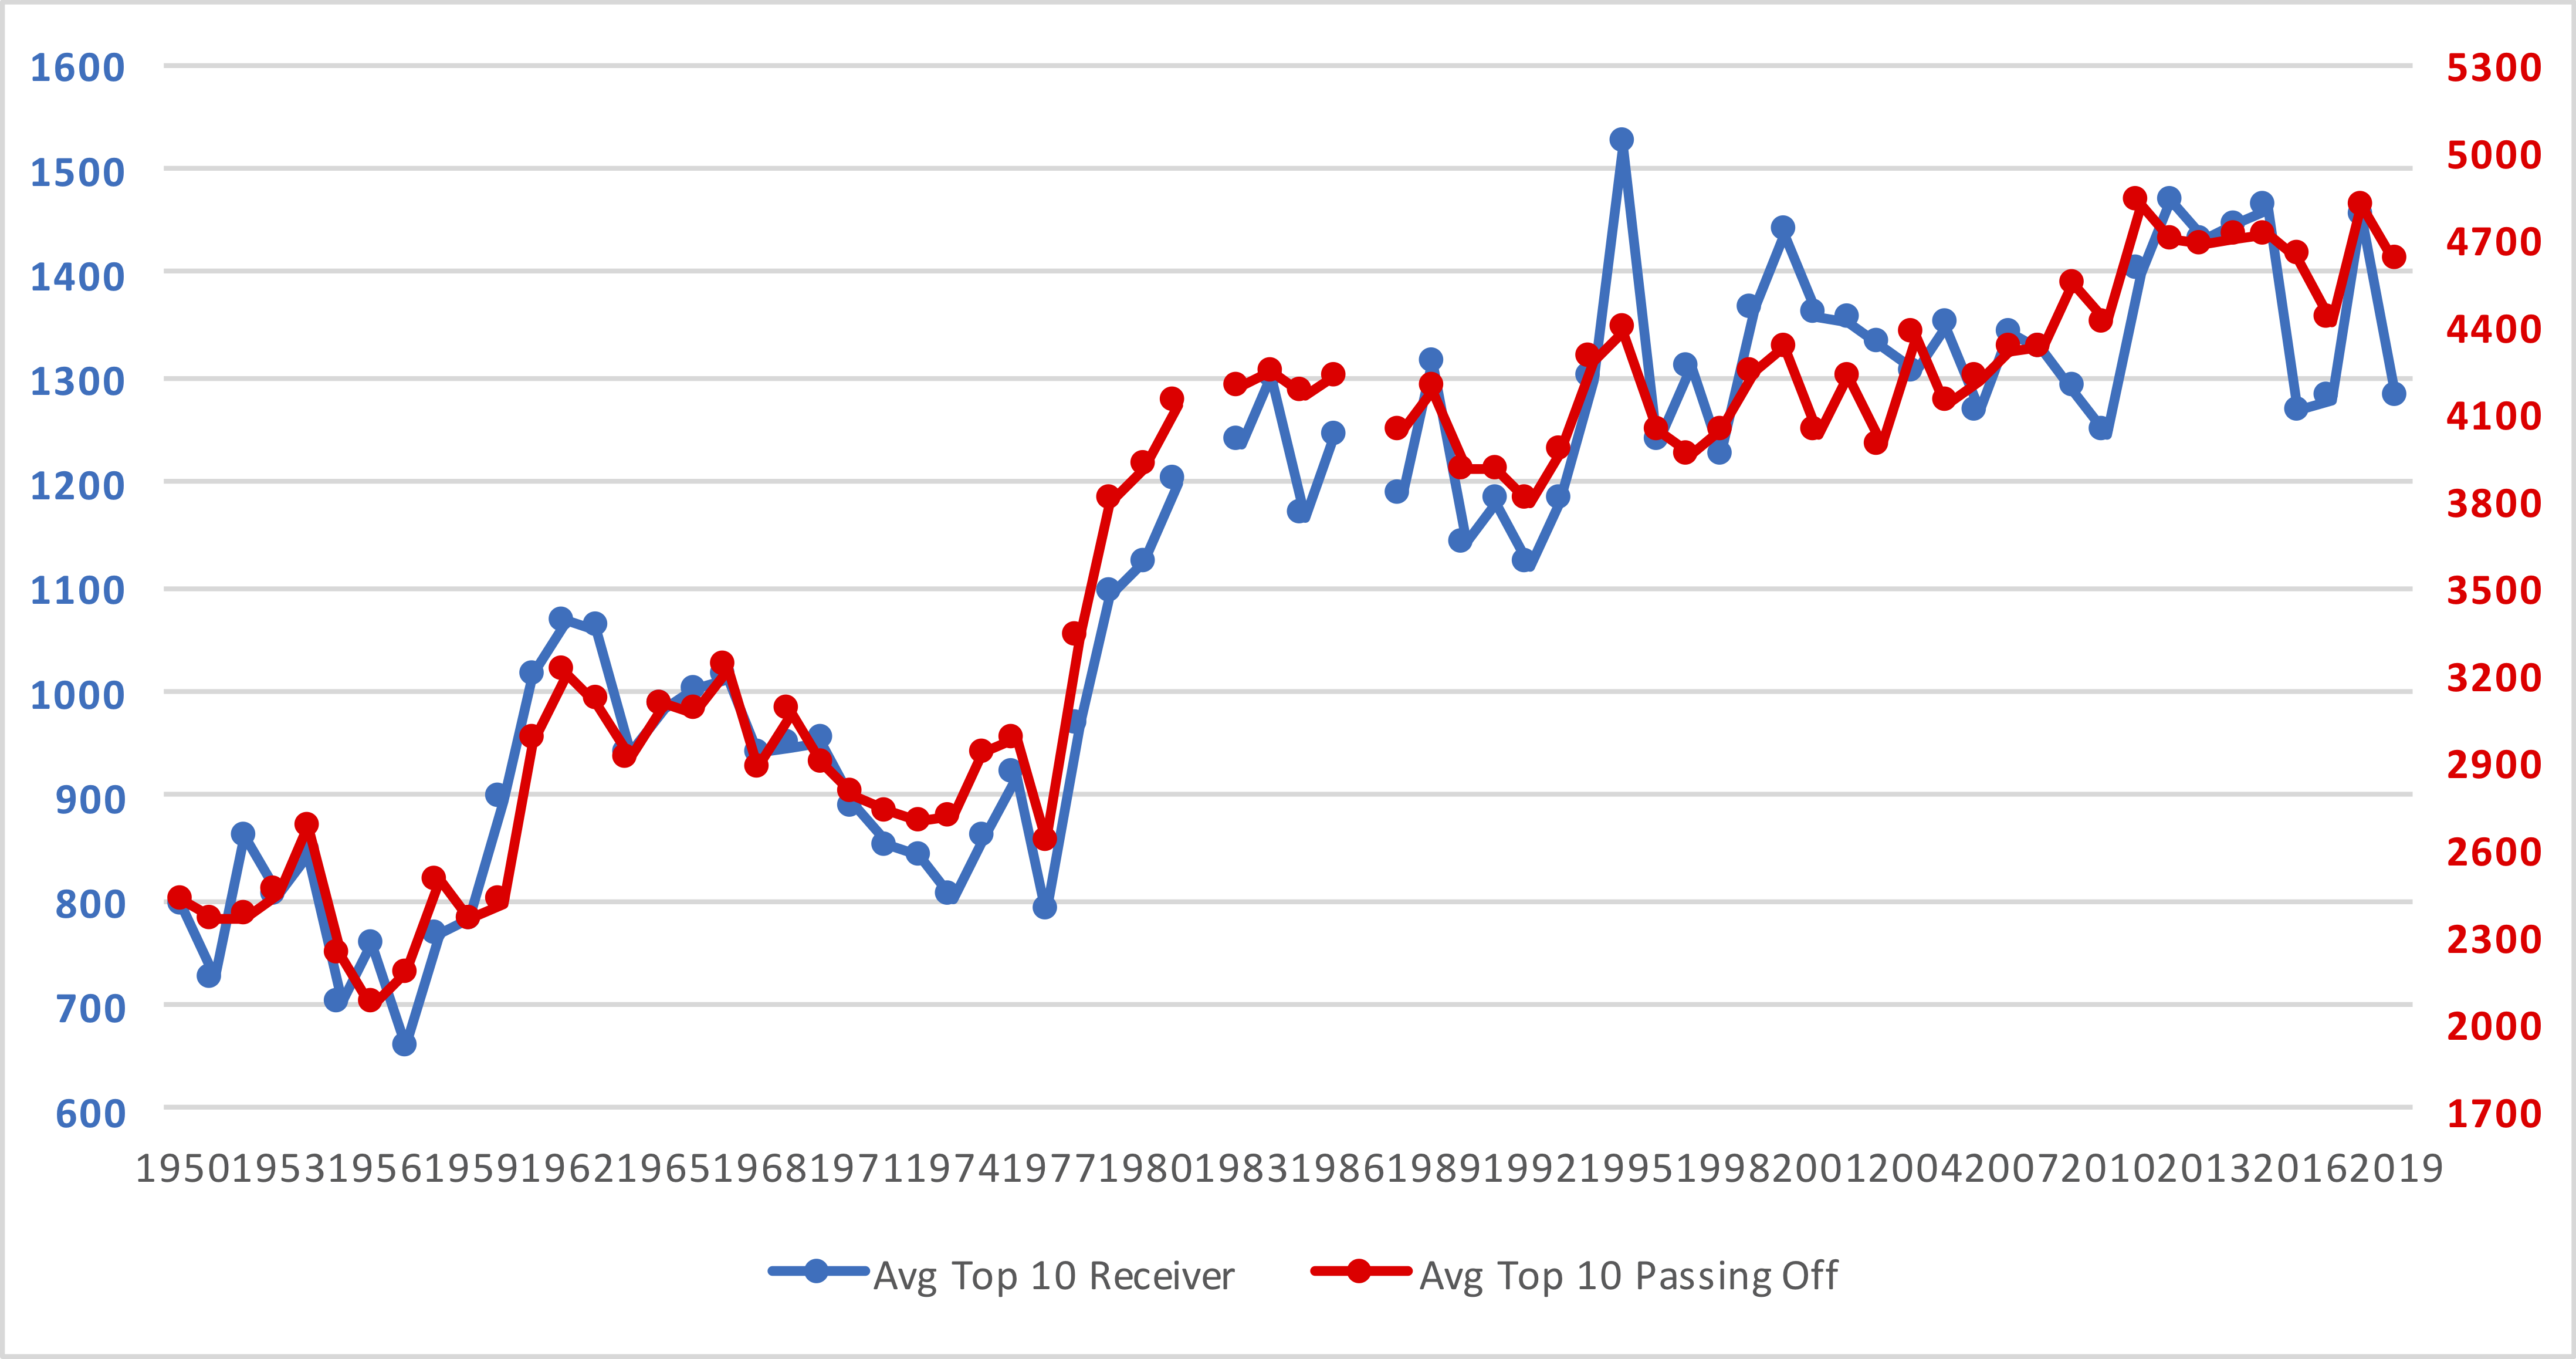 What stands out to you? Please leave your thoughts and follow-up requests in the comments below.
References
| ↑1 | Note that I excluded the 1987 season, which featured replacement players and therefore skewed the results; technically, the CC Index for the NFL that season was 12.9%. |
|---|