≡ Menu

Andrew Luck Retires: How Good Was He Really?

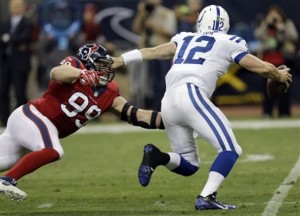
Seven years ago, Andrew Luck entered the NFL as one of the greatest quarterback prospects of all time. He was expected to become this generation’s John Elway or Peyton Manning, and he never looked the part more so than on this touchdown pass:

Those who witnessed the Luck era will not soon forget it. The hype accompanied Luck was massive, because he was a perfect prospect. He not only had an arm that could do this, with little help from his legs…

But he also had legs that could do this, with a little help from his arms…

[continue reading…]

{ 0 comments }

In 2017, Indianapolis ranked 30th in points and 31st in yards. The Colts also ranked 29th in Net Yards per Attempt and 31st in touchdown passes.

This year, with Andrew Luck back, the Colts rank 5th in points and 9th in yards, while ranking 13th in NY/A and 2nd in touchdown passes. No offense has improved more from 2017 to 2018 than the Colts, and Luck is a big reason why.

Early on this season, it looked like there was something wrong with Luck; through 3 games, he was averaging just 5.34 yards per attempt! Since then, he’s upped his average to 7.63 yards per attempt; that’s actually below the median over that time frame, but coupled with his stellar sack rate and remarkable TD/INT numbers, and he’s been a very valuable quarterback over the last two months.

There are three remarkable Luck numbers this season, but chances are you have only heard of two of them. The Colts star has now gone five straight games without a sack, making him just the 5th player since 1981 to go five straight games with 20+ pass attempts and zero sacks. And Luck has thrown at least 3 touchdown passes in seven straight games, a feat that puts him in even rarer company.

But perhaps the biggest reason for the Colts success right now is how excellent Luck has been on third downs. On average, teams have picked up a first down on 36.9% of all third down pass plays this year. Luck has done it at a rate of 51.9%, making him the most valuable third down passer this season. [continue reading…]

{ 0 comments }

Yesterday, I looked at how long it took the best quarterbacks to break out. Today, I want to apply what we learned from that post to 15 current NFL quarterbacks with fewer than 50 starts, all of whom were 26 years old or younger during the 2013 season.
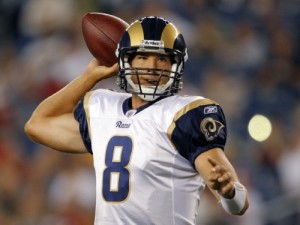
Bradford looks to check down

Bradford looks to check down.

Sam Bradford (49 career starts): Career Relative Adjusted Net Yards per Attempt of -0.68.

Bradford was overrated after he put up good counting stats but weak efficiency numbers as a rookie; he posted a -1.0 RANY/A in 2010, a -1.4 average in 10 starts in 2011, was at -0.3 in 16 starts in 2012, and then +0.2 in seven starts last year. Yesterday, we noted that great quarterbacks who came to terrible teams (Warren Moon and Drew Brees, in addition to former number one picks like Troy Aikman, Terry Bradshaw, Vinny Testaverde, and Steve Young) struggled initially. Bradford would seem to fit that mold, although he’s now 49 starts into his career. Are there other reasons to give him a pass?

St. Louis had the third-youngest offense in the NFL last year, and the man who has gained the most yards from Bradford over the last four years is Brandon Gibson. The former first overall pick has received very little help, and been saddled with a revolving door of mediocre receivers.

On the other hand, Kellen Clemens posted better numbers than Bradford last year, at least when you adjust for strength of schedule. As Bill Barnwell pointed out last week, Bradford’s big problem is his inability to throw the ball down the field, which jives with some of the work I’ve done Bradford’s historically low yards per completion averages.  If not for Bradford’s first season of above-average work last year, I’d say his odds of ever being a franchise quarterback are very low.  But there has been some progression, and he does fit the mold of number one pick being saddled with bad teammates.  Of course, the presence of Brian Schottenheimer is enough to make me skeptical of Bradford’s ability to put it all together this year.  Perhaps the best case scenario is a Testaverde-like revival with another team years from now.

Cam Newton (48 career starts): Career RANY/A of +0.30.

Not much to see here. Newton’s RANY/A has moved from +0.3 as a rookie to +0.7 in 2012 to -0.2 last year; it went under the radar because #QBWINZ, but Newton did have a down season in 2013.  It’s hard to find any reasons for optimism for the Panthers this year after a mass exodus in the offseason, but that doesn’t say much about Newton’s long-term prospects.   Add in his rushing ability, and Newton has shown enough to say that he’s still in contention (if he’s not already there) to go down as a franchise quarterback.

Andy Dalton (48 career starts): Career RANY/A of -0.01.

Look at that, Dalton is almost perfectly average! Bill Barnwell did a nice job profiling Dalton last week, and it does seem like what you see is what you will get from Dalton.  After posting slightly below-average RANY/A numbers in 2011 and 2012, he was above-average (+0.4) last year.  But the Bengals have one of the most talented offenses in the NFL if you exclude the quarterback position; at this point, you’d be hard-pressed to find many folks who believe Dalton will turn into a future star.

Of the 42 quarterbacks I looked at yesterday, 13 failed to be significantly above-average during any of their first three 16-game samples.  Dalton doesn’t really resemble any of them: Bradshaw/Testaverde/Elway/Vick were former number one picks; Brady/Favre/Krieg/Kelly were on the border of being good enough on to not make the list, and were certainly ahead of where Dalton is now; McNabb and Cunningham were running quarterbacks.  Moon played for a terrible team, and Gannon and Theismann sat for long stretches.  That’s the full thirteen. The best case scenario may be that Dalton turns into a Krieg or a poor man’s Jim Kelly.  Of course, he could also win a Super Bowl by riding the coattails of one of the more talented (and youngest) rosters in the league.

Christian Ponder (35 career starts): Career RANY/A of -1.19.

There are always excuses to be made for bad quarterbacks, and I’m sure that there are still some Vikings fans who believe in Ponder.  He produced a -1.7 RANY/A as a rookie, improved to -0.9 in 2012, but was back at -1.1 in nine starts last year.  Minnesota may not have a ton of talent at wide receiver, but Ponder’s failure to produce even with Greg Jennings is yet another strike against him. The Vikings drafted Teddy Bridgewater at the end of the first round in the 2014 draft, which seems like the beginning of the end for the former Florida State star.
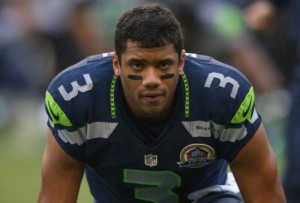
Wilson is watching game tape right now.

Wilson is watching game tape right now.

Russell Wilson (32 career starts): Career RANY/A of +1.15.

Franchise quarterback achievement badge mode: unlocked.

Ryan Tannehill (32 career starts): Career RANY/A of -0.80.

Tannehill was at -0.7 RANY/A in 2012 and at -0.9 RANY/A last year; neither of those numbers put his future prospects in a positive light.  There are excuses, to be sure: he was a raw prospect, the Dolphins offensive line was the worst in the NFL, he and Mike Wallace have the chemistry of a pair of tomatoes, etc., but the numbers are bleak enough to cast doubt on Tannehill’s future.  Unless the argument is that Tannehill landed on one of the very worst offenses in the league — which would allow you to lump him in with the Aikmans, Bradshaws, Breeses, and Testaverdes of the world — there is simply no precedent for a quarterback being this below average for this long and then turning into a franchise passer. [1]I suppose one could point to Phil Simms, but I’d object for a couple of reasons. For one, Simms didn’t crack my initial list, checking in at #86 in my GQBOAT series.  Then again, … Continue reading Barnwell is a little (and only a little) more bullish on Tannehill than I am, but 2014 would appear to be Tannehill’s last chance to convince the Dolphins that he was not a wasted pick.  There are a couple of mitigating factors here — the running game has been terrible, and as an immediate starter, Tannehill is at a disadvantage relative to other quarterbacks on this list — but I’m not going to lose sleep over whether this prediction will look bad in a few years.

Andrew Luck (32 career starts): Career RANY/A of -0.06.

Since starting this site, Luck has been one of the quarterbacks I’ve profiled the most.  He wins without much help and is an ESPN QBR star, but he’s below average in ANY/A.  I’m inclined to grade Luck on a curve — after all, the Colts team he inherited didn’t look any better than the ’70 Steelers or ’89 Cowboys or ’87 Bucs.  On the other hand, Reggie Wayne and T.Y. Hilton have given Luck some excellent targets, which has probably been enough to boost his ANY/A to league-average proportions.

Perhaps the best comparison will be to another quarterback drafted first overall by the Colts who had a magical history of producing comebacks: John Elway.  In any event, Luck’s already a franchise quarterback.
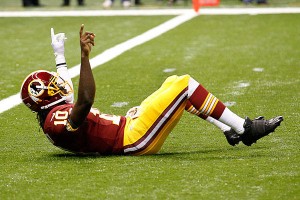
Can RG3 get up from a disastrous 2013?

Can RG3 get up from a disastrous 2013?

Robert Griffin III (29 career starts): Career RANY/A of +0.5.

Griffin’s career RANY/A is like measuring the temperature of a person with a foot in the freezer and a foot in a frying pan.  As a rookie, he had a RANY/A of +1.5; last year, it was -0.4, and that number doesn’t begin to explain how ugly things were in D.C.  The simplest explanation is that Griffin is a franchise quarterback who struggled last year as he recovered from ACL surgery and dealt with an ego-maniacal head coach.  But it’s hard to just assume Griffin is a franchise quarterback after 2013.  If Griffin one day turns into a Hall of Famer, we’ll remember that it was obvious from the start, as he had one of the greatest rookie seasons ever.  If he flames out, the first chapter of that book has already been written, too.

Blaine Gabbert (27 career starts): Career RANY/A of -2.15.

Spoiler alert: Gabbert is not a franchise quarterback.  He started at -2.2 RANY/A as a rookie on a team not dissimilar from the ’89 Cowboys; he’s followed that up, however, with a -1.2 RANY/A in 2012 and a -4.7 RANY/A over three starts last year. Suffice it to say if Gabbert turns into a franchise quarterback, it will have taken the greatest reclamation project in NFL history.

Colin Kaepernick (23 career starts): Career RANY/A of +1.06.

Kaepernick was mind-bogglingly efficient in 2012, producing a +1.6 RANY/A over 13 games and seven starts.  That number dropped to +0.8 RANY/A last year, but much of that is due to the loss of Michael Crabtree.  With an all-star crew of receivers set to take the field in 2014, I expect another very strong year out of Kaepernick. He may not be a finished product, but he already has the label (and contract) of a franchise quarterback.

Jake Locker (18 career starts): Career RANY/A of -0.25.

Maybe it’s because I’m a college football guy, too, but doesn’t it feel like Locker has already been around forever? I can’t believe he only has 18 career starts. And his RANY/A is nearly league-average, even if it doesn’t feel like Locker has been even that good.  I was not a fan of him as a prospect, but he has been better than I feared.  While we shouldn’t compare Locker’s first 18 starts to those of a quarterback who started immediately, I think Locker has shown enough that you can’t just write him off just yet.  On the other hand, his numbers last year were a bit inflated by one of the NFL’s easiest schedules. Like Tannehill, this is the crucial season for Locker, who also carries with him the injury prone label. But if Locker can stay healthy and produce strong numbers, Ken Whisenhunt may prove that he really is a quarterback whisperer (to the extent he’s not whispering to someone named Skelton, or Kolb, or Anderson, or Leinart, or Lindley, or Hall….)

Nick Foles (16 career starts): Career RANY/A of +1.45

Foles had a rookie RANY/A of -0.8 before posting an absurd +3.3 RANY/A in 2013. Even the bigger Eagles homer would admit that much of Foles’ success was due to good fortune, the presence of Chip Kelly, or both.  Foles may not have arrived just yet as a franchise quarterback, but if he turns into one, nobody will ever question when we first saw a glimpse of that ability.

Geno Smith (16 career starts): Career RANY/A of -1.70.

Smith was bad — really bad — for long stretches as a rookie.  But he finished the season well, and terrible rookie numbers on a talent-deficient offense are not the death knell for a quarterback’s career.  The Jets need to see a lot more from him this year, though, and he’ll need to produce roughly league-average numbers to make the Jets think he’s not just another Mark Sanchez.

Mike Glennon (13 career starts): Career RANY/A of -0.9.

Glennon had a very different rookie campaign than Smith, but the acquisition of Josh McCown sends Glennon to the bench, at least for now.  We don’t know how he’ll fare in (or when he’ll see) his next three starts, but Glennon’s performance through 16 starts likely won’t be enough to write him off.

EJ Manuel (10 career starts): Career RANY/A of -1.0.

Manuel had a rough rookie year, especially when you consider how much worse he looked than Thaddeus Lewis. On the other hand, ten starts of bad (but not horrendous) play certainly isn’t enough to write off Manuel, not when Smith was worse for a longer stretch.  Still, as with Smith, this is a big year for Manuel, especially after the team went out and acquired Clemson’s Sammy Watkins.

References

References
1 I suppose one could point to Phil Simms, but I’d object for a couple of reasons. For one, Simms didn’t crack my initial list, checking in at #86 in my GQBOAT series.  Then again, I’ve made the argument that Simms’ numbers underrate him because of his terrible receivers, so I would morally classify Simms as a franchise quarterback. However, the Giants teams of the late ’70s and early ’80s were so terrible that he really has more in common with the Aikmans of the world than someone like Tannehill. Here is how Simms fared compared to the other Giants quarterbacks during Simms’ first three years and 1978, the year before he came to New York. That’s U-G-L-Y. But if Dolphins fans want to point to Simms as a pro-Tannehill example, so be it.
{ 9 comments }

Andrew Luck and Quarterback Help

Luck confuses defenders, statisticians

Luck confuses defenders, statisticians.

It’s no secret that Andrew Luck’s efficiency numbers aren’t quite up to par with his reputation. Over the past two seasons, Luck ranks just 18th in ANY/A, far behind some of the other young quarterbacks in the NFL. Nick Foles, Russell Wilson, and Colin Kaepernick rank in the top 6th in that metric, Robert Griffin is 11th, Cam Newton is 14th, and even Andy Dalton is 16th. Luck tends to fare much better in ESPN’s QBR than in ANY/A (and Andy Benoit wrote an interesting pro-Luck piece yesterday), but today I wanted to try to quantify another issue: quarterback help.

A quick disclaimer: there are probably a zillion different ways to quantify quarterback help. This is certainly not not not the best way, but it’s the way that was easiest and most intuitive to me. On the scale of “this feels right” to “rigorous quantitative analysis” this certainly falls closer to the former end of the scale. But it’s Friday and we’re having fun, so here’s what I did.

1) Calculate how many standard deviations from average each team was in Points Allowed (negative means fewer points allowed).

2) Calculate how many standard deviations from average each team was in Pass Ratio (negative means more run-heavy).

3) Add the two standard deviations to see how much each team relied on each quarterback’s arm.

Here were the 2013 results. According to this, no quarterback was asked to do more than Matt Ryan. Here’s how to read the table below: The Falcons allowed 443 points last year, which was 1.05 standard deviations more than the average team. Atlanta also passed on 68.7% of all plays, which was 1.99 standard deviations above average. Add those together, and the Falcons get a grade of +3.04, the most in the NFL in 2013. [continue reading…]

{ 14 comments }
Luck's rushing ability makes him a QBR star

Luck's rushing ability makes him a QBR star.

A few weeks ago, I put ESPN’s Total QBR under the microscope. Today, I want to look at the quarterbacks whose passing statistics most differ from their QBR grades.

Total QBR grades go back to 2006, so to start, I ran a regression using Adjusted Net Yards per Attempt to predict Total QBR. The best-fit formula was:

Total QBR = -13.5 + 11.23 * ANY/A

For those curious, the R^2 was 0.80, indicating a very strong relationship between ANY/A and Total QBR. What this formula tells us is that a passer needs to average 5.65 ANY/A to be “projected” to have a QBR of 50; from there, every additional adjusted net yard per attempt is worth 11.2 points of QBR. Last year, Peyton Manning averaged 8.87 ANY/A, which projects to a QBR of 86.2. In reality, Manning had a QBR of “only” 82.9; this means Manning’s QBR says he wasn’t quite as amazing as his excellent efficiency numbers would indicate (to say nothing of his otherworldly gross numbers). One likely reason for this result is that Manning ranked 29th in average pass length in the air (according to NFLGSIS) and 6th in yards after the catch per completion; this matters because ESPN gives more credit to quarterbacks on the yards they accumulate through the air. (Throughout this post, we will be forced to deal with educated guesses, because Total QBR is a proprietary formula.)

As it turns out, Manning rating higher in actual QBR than projected QBR is a stark departure from prior years. In 2012, he finished 7.2 points higher in actual QBR than projected QBR, but that’s nothing compared to his time with the Colts. In five years in Indianapolis during the Total QBR era, Manning finished at least 10 points higher in actual QBR each season.

Along with Manning, Matt Ryan and Andrew Luck are the two quarterbacks who are most likely to over-perform relative to their “projected” ratings. Let’s be careful about exactly what this means: whatever the ingredients that go into the QBR formula that don’t go into the ANY/A formula, Manning, Ryan, and Luck seem to have a lot of them.

Luck is a fascinating case. In 2012, he ranked just 20th in ANY/A, but 11th in QBR. I wrote several articles during Luck’s rookie season about how his QBR ratings surpassed his standard stats. [1]Although now I can’t recall if his 2012 ratings were inflated because of his 4th quarter comebacks.  And I can’t check, because once ESPN decided to cap the clutch weight associated with … Continue reading Last year, he ranked 16th in ANY/A and 9th in QBR. Does this make Luck the quarterback most underrated (if you buy into QBR) by his traditional passing numbers (if you buy into ANY/A)? [continue reading…]

References

References
1 Although now I can’t recall if his 2012 ratings were inflated because of his 4th quarter comebacks.  And I can’t check, because once ESPN decided to cap the clutch weight associated with each play, they retroactively applied the current formula across past years.
{ 11 comments }

Superman wears #12 in Indianapolis now.

Superman wears #12 in Indianapolis now.

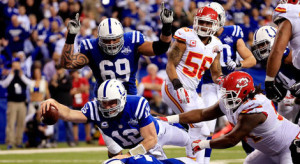
The NFL playoffs began in very entertaining fashion in Indianapolis. The Chiefs lost Jamaal Charles on the first drive of the game to a concussion, but stormed out to a 38-10 lead. Then the Colts pulled off the second greatest comeback in NFL history, eventually winning 45-44. The much-maligned Alex Smith had the game of his life, finishing 30 of 46 for 378 yards, with 4 touchdowns and no interceptions while also rushing for 57 yards.

Of course, Andrew Luck had an incredible game, too, even if it wasn’t necessarily as efficient. Luck went 29/45 for 443 yards and 4 touchdowns to counter his 3 interceptions, rushed for 45 yards, and recovered a Donald Brown fumble and ran it in for the touchdown.

Which made me wonder: where does this game rank among the greatest quarterback battles? To make life simpler, I’m only going to look at passing statistics, although obviously both players added some value on the ground. Smith averaged 9.23 Adjusted Net Yards per Attempt, defined as (Passing Yards + 20*TD – 45*INT – Sack Yards) divided by (Pass Attempts + Sacks). The NFL average in 2013 was 5.87 ANY/A, which means Smith produced 3.36 ANY/A over average. And, since he had 48 pass attempts (including sacks), that means Smith provided 161 yards over average.

Luck’s averages were hurt by the three interceptions, but he still produced 8.23 ANY/A and therefore 2.41 ANY/A over average. That means, over his 46 dropbacks, he produced 111 yards of value over average. So where does that mean this game ranks among all playoff games since 1970? My initial thought was to simply add the two value over average numbers, but that ended up producing a list dominated by great games by one quarterback. To counter this, I decided to only look at games where both quarterbacks were above average and to instead take the Harmonic Mean of their values. This wound up producing a pretty good list, and it places Luck/Smith at #9. [continue reading…]

{ 5 comments }

When it comes Patriots/Colts, it’s easy to want to focus on Tom Brady vs. Andrew Luck. Or to marvel at the sheer number of star players these teams have lost in the last 12 months. If you played college in the state of Florida, you’re probably not going to be playing in this game: T.Y. Hilton is the last star standing with Vince Wilfork, Aaron Hernandez, Brandon Spikes, and Reggie Wayne gone. The Patriots also have placed Rob Gronkowski, Sebastian Vollmer, Jerod Mayo, Tommy Kelly and Adrian Wilson on injured reserve, while Devin McCourty and Alfonzo Dennard are both questionable. Also, of course, Brady is probable with a shoulder.

The Colts just put defensive starters Gregory Toler and Fili Moala on injured reserve, adding to a list that already included Wayne, Ahmad Bradshaw, Vick Ballard, Dwayne Allen, Donald Thomas, Montori Hughes, and Pat AngererLaRon Landry and Darrius Heyward-Bey are both questionable, and the latter’s injury caused the team to sign ex-Patriot Deion Branch.

All the injuries and changing parts make this a pretty tough game to analyze. So I’m not going to, at least not from the usual perspective. Instead, I want to take a 30,000 foot view of the game. According to Football Outsiders, the Patriots were the most consistent team in the league this season, while the Colts were the fourth least consistent team. Rivers McCown was kind enough to send me the single-game DVOA grades for both teams this season, and I’ve placed those numbers in the graph below with the Colts in light blue and the Patriots in red. The graph displays each team’s single-game DVOA score for each game this season, depicted from worst (left) to best (right). For Indianapolis, the graph spans the full chart, from the worst game (against St. Louis) to the best (against Denver). As you can see, the portion of the graph occupied by New England is much narrower, stretching from Cincinnati to Pittsburgh. [continue reading…]

{ 7 comments }

New York Times: Post-Week 5, 2013

This week at the New York Times, I fawn over Andrew Luck:

Luck ranks fourth in ESPN’s Total QBR metric, which includes two of the hidden areas where Luck excels: rushing and third-down passing.

Luck has produced the most value on the ground of any quarterback in the league, according to Total QBR, slightly better than Michael Vick. Luck has scrambled on third down five times in five games, and he has picked up a first down each time. That doesn’t include a designed third-down run for a touchdown to ice the game in San Francisco.

Luck doesn’t run often — excluding kneel-downs, he has just 15 carries — but he makes the most of them with an average of 9.3 yards per carry. Against Oakland, his 19-yard touchdown on third-and-4 was the game winner.

Another reason for the Colts’ success: Luck has played at his best in the biggest situations. According to Albert Larcada from ESPN Stats and Information, Luck has played extremely well but in some under-the-radar ways on third down.

His third-down pass attempts have led to six defensive pass interference or defensive holding calls — those are ignored by traditional statistics but help a team just as much as a completion, and no other other quarterback has drawn more than four such penalties.

Luck has been sacked just once on 47 dropbacks on third down, another underrated quarterback skill. Add in Luck’s excellent play on third downs generally, and Lacarda says that Luck has a league-leading (and near-perfect) 97.6 QBR on third down. To put that in context, Peyton Manning is second at 90.2. As a team, Indianapolis has converted on 50 percent of its third downs, the second-highest rate in the league behind the Broncos (58.3).

You can read the full article here, which also includes some Geno Smith trivia.

{ 0 comments }

Scott Kacsmar recently wrote about Robert Griffin III’s struggles on third downs last season. Despite Griffin’s otherworldly rate stats, that was one area where he really struggled in 2012. I thought it would be interesting to take a look at how all quarterbacks fared on “third downs” last season. I put that in quotes because I’m including fourth down data, but don’t want to write third and fourth down throughout this post. Regular readers may recall I did something similar last November, but now we can work with full 2012 season numbers.

To grade third down performance, I included sacks but threw out all rushing data (not for any moral reason, just in the interest of time). The first step in evaluating third down performance is to calculate the league average conversion rate on third downs for each distance. Next, I came up with a best-fit smoothed line based on the data, which is based off the following formula:

Conversion Rate = -0.0001 * Distance^2 – 0.0224 * Distance + 0.5301

Take a look at the table below. For example, there were 309 passes (i.e., pass attempts or sacks — scrambles are not included) and the league-wide conversion rate was 51.1%. Using the best-fit formula, the smoothed rate is 50.8%. There is nothing groundbreaking here — the conversion rates drop as the “to go” number increases, but it helps to quantify what we already know.

To GoPassesFirst DownsRateSmoothed Rate
130915851.1%50.8%
241520850.1%48.5%
348720742.5%46.2%
451222744.3%43.9%
555922640.4%41.6%
654122842.1%39.2%
752118134.7%36.8%
842614333.6%34.5%
936511631.8%32%
1072822030.2%29.6%
112137133.3%27.2%
121533925.5%24.7%
131352417.8%22.2%
141072220.6%19.7%
151432215.4%17.2%
166258.1%14.6%
17681217.6%12%
185036%9.5%
195335.7%6.8%
204836.3%5%

[continue reading…]

{ 23 comments }

Last week, I wrote about how the 2012 Redskins were powered by a pair of rookies in Robert Griffin III and Alfred Morris. The only team whose rookies had more passing/rushing/receiving yards in NFL history was the 2012 Colts, while the only non-expansion team with a higher percentage of yards from rookies was the ’55 Colts.

In the comments, Shattenjager pointed out that the list I presented was pretty quarterback-heavy. So I thought a fun thing to do would be to use PFR’s Approximate Value (AV) system instead of yards, and re-run the numbers.

The table below shows all non-expansion teams since 1950 that had at least 25% of their AV come from rookies. For each team, I’ve listed their record and winning percentage, total team AV, their rookie AV, and the percentage compiled by rookies. Then I listed their top four rookies in terms of AV.
[continue reading…]

{ 3 comments }

Russell Wilson is too awesome for snide comments.

Russell Wilson is too awesome for snide comments.

Since 1990, there have been 48 rookie quarterbacks that threw at least 224 pass attempts, the necessary amount to qualify for the league’s efficiency ratings. There are many conventional ways to measure rookie quarterbacks, but the off-season lets us play around with more obscure measures.

For example, have you ever considered how rookie quarterbacks performed compared to how their teams passed in the prior year? David Carr, Tim Couch, and Kerry Collins took over expansion teams, but we can compare the passing stats of the other 45 rookie quarterbacks to the team stats from the prior season. To compare across eras, I am grading each individual and team relative to the league average each season.

Let’s start with Net Yards per Attempt. Ben Roethlisberger averaged 7.41 NY/A in 2004 when the league average was 6.14; therefore, Roethlisberger was at 121% of league average. Meanwhile, the 2003 Steelers under Tommy Maddox were at 99% of league average. For each of the 45 rookie quarterbacks, I plotted them in the graph below. The Y-axis shows how the quarterback performed as a rookie, while the X-axis shows how his team performed in the prior season. Because it makes sense to think of “up and to the right” as positive, the X-axis goes in reverse order. Take a look – I have an abbreviation for each quarterback next to his data point:
[continue reading…]

{ 2 comments }

Checkdowns: Most Game Winning Drives in First 12 games

Scott Kacsmar, friend of Football Perspective and the leading writer on quarterback comebacks, noted that Andrew Luck has 5 game-winning drives in his first 12 games. Where does that rank historically?

To be clear, game-winning drives are not an official statistic, and while Kacsmar has gone through thousands of games to record data on the subject, we can’t confirm that the below list in 100% complete. With that disclaimer out of the way, the table below displays all quarterbacks with at least 3 game-winning drives in their first 12 NFL games:

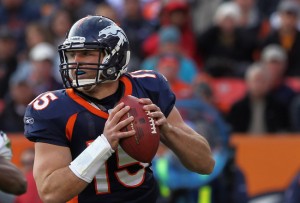
Tim Tebow led a game-winning drive in half of his first twelve starts.

If we look just at quarterbacks in their first 12 starts, well, a different name vaults to the top of the list. Tim Tebow launched a phenomenon known as Tebow-mania last year, thanks to his dramatic comebacks seemingly every week last November and December.

Luck’s career trajectory looks to be on a much better path than Tebow, Jay Schroeder or John Skelton, but hey, I don’t make the trivia, I just present it.

The table below shows how many game-winning drives were led by quarterbacks in their first 12 starts. Thanks to Scott Kacsmar and Pro-Football-Reference.com for the data.
[continue reading…]

{ 6 comments }

NYT Fifth Down: Post-week 13

This week at the New York Times, I blush when discussing Andrew Luck, praise the great Calvin Johnson as he tries to surpass Jerry Rice (but with a caveat), and take a look at some other random stats (including some absurd numbers from Adrian Peterson). Trivia: Brandon Marshall has gained over 1,000 yards on both the Bears and Broncos in seasons in which Jay Cutler was his primary quarterback both seasons. Can you name the only two other wide receivers to gain 1,000 yards with multiple teams but the same passer?

It’s not supposed to be this easy.

Sure, Steve Young and Aaron Rodgers followed Joe Montana and Brett Favre and excelled, but the fact that those examples are so memorable shows that they are the exception to the rule.

You’re not supposed to be able to replace a Hall of Fame quarterback with another star. In Indianapolis, the Colts got a taste of what life is often like for a team in the first year after a franchise quarterback’s exit: Curtis Painter, Dan Orlovsky and Kerry Collins earned every bit of their combined 2-14 record in 2011. But after the Colts bottomed out, Indianapolis’s fortunes changed dramatically. With the first pick in the 2012 draft, the team selected Stanford’s Andrew Luck, and the Colts appear set to be an annual contender for the next decade. Again.

Luck ranks fourth in passing yards this season, and he has shouldered the load for a Colts team that is below average in rushing, stopping the run and stopping the pass. Luck ranks “only” 19th in Adjusted Net Yards per Attempt and 14th in Net Yards per Attempt, unimpressive numbers only outside of the context of a rookie quarterback playing for what was the worst team in the N.F.L. a year ago. Luck passes the eye test and at least one advanced metric (before last night’s game, Luck ranked 6th in ESPN’s Total QBR), but part of what’s impressive about him is that even when he isn’t playing well, he remains capable of carrying his team to victory. Luck struggled for much of the game against Detroit on Sunday but still managed to pull out a most improbable victory.

In the first 56 minutes of the game, Luck was 17 for 39 for 279 yards with three interceptions. His team trailed the Lions, 33-21, with under three minutes remaining. At that point, Advanced NFL Stats calculated Indianapolis’s odds of winning at 2 percent.

But Luck led them on two scoring drives, and the Colts became just the seventh team to win a game despite trailing by 12 or more points with so little time remaining since 2000. Two of the other instances involved Peyton Manning with the Colts. In 2003, Manning led the Colts on a marvelous comeback against the Buccaneers on “Monday Night Football.” Six years later, Indianapolis trailed New England, 34-21, with 2:30 remaining. A Colts touchdown was followed by three Patriots plays that gained 8 yards, setting up Bill Belichick’s infamous 4th-and-2 decision.

It will be a long time before Luck could be considered anywhere near Manning’s class in terms of body of work, but his performance against the Lions is now alongside many of Manning’s memories in the annals of great Colts moments. Luck’s game-winning touchdown to Donnie Avery was just the 13th game-winning touchdown pass in the final seconds of a game since 2000.

Statistically, Andrew Luck may not be having the best year, but he has played an enormous part in the Colts’ magical run. At 8-4, the Colts are almost certainly going to make the playoffs; if they do, they will join the 2008 Miami Dolphins and 1982 Patriots on the list of N.F.L. teams to make the playoffs a year after going 2-14 or worse.

Luck will also set a couple of rookie records. With the game-winning drive he led against the Lions, he tied Ben Roethlisberger and Vince Young for the most fourth-quarter game-winning drives (five) by a rookie quarterback. By defeating Detroit and earning his eighth win, he broke a tie with Sam Bradford and now has the most wins among rookie quarterbacks selected first over all since 1950. Luck’s next victory will give him nine wins this season, tying him with Chris Chandler for the franchise record for wins by a rookie quarterback.

Calvin Johnson and the Lions’ Passing Game

Calvin Johnson led the league with 1,681 receiving yards last season and was named a first-team All-Pro by The Associated Press for the first time in his career. His encore performance may be even better.

He has gained a mind-boggling 1,428 receiving yards this season, joining Elroy Hirsch (1,495 yards in 1951) on the short list of N.F.L. players to top the 1,400-yard mark in a team’s first 12 games (in the A.F.L., Charley Hennigan and Lance Alworth each reached that mark once as well).

You can read the full post (and the answer to the trivia question) here.

{ 1 comment }

NYT Fifth Down: Post-week 7

A couple of weeks ago, I wrote the differing rookie seasons of Andrew Luck and Robert Griffin III. The numbers still hold — Griffin dominating in all traditional stats, while Luck throwing more passes downfield than any other quarterback — so I sat down with ESPN’s Jeff Bennett to figure out why Luck ranks ahead of Griffin in ESPN’s QBR.

After seven weeks, Robert Griffin III of the Redskins has exceeded even the most optimistic expectations. He leads the N.F.L. with a 70.4 completion percentage, and could become the first rookie to lead the league in that category since Parker Hall with the Rams in 1939.

Griffin also ranks first in yards per attempt with an 8.5 average, and could become the first rookie since another Ram, Bob Waterfield in 1945, to lead the N.F.L. in that statistic. Only two rookies in professional football history have ever led the league in both completion percentage and yards per attempt. The first was another Redskin, Sammy Baugh, in 1937; the last was Greg Cook, in the American Football League in 1969 (his career was ruined by a shoulder injury that year).

Griffin’s statistical domination of the record book has been astounding. And that’s before we get to the fact that he has 468 rushing yards and 6 touchdowns in seven games, putting Cam Newton’s rookie rushing records in both categories (706 and 14) in jeopardy.

Griffin will always be compared to the man selected one spot before him in the 2012 draft, Andrew Luck. And on the surface, there’s no comparison. Luck ranks 32nd in completion percentage (53.6) and 25th in yards per attempt (6.7). Whereas Griffin ranks third in traditional passer rating (101.8) behind Aaron Rodgers and Peyton Manning, Luck is tied with Brandon Weeden (72.3) and ahead of only Matt Cassel for last place.

But traditional statistics don’t always tell the full story, especially when we’re dealing with a sample size that’s smaller than half a season. Those watching Luck have usually come away thinking that he’s the next great quarterback, despite the raw numbers. Fortunately, there’s a way to fill in the rather large gap between perception and statistical production. One of those tools is ESPN’s Total QBR, which ranks Luck as the sixth-best quarterback in the N.F.L. this season. That’s even ahead of Griffin, who is eighth in QBR.

Jeff Bennett of ESPN Stats & Information, in a telephone interview, was able to help explain why Luck was not only the best rookie quarterback this season, but also perhaps the most underrated quarterback in the N.F.L.

Difficulty of Throws

It’s a gross generalization, but Luck plays in a vertical offense while Griffin plays in a horizontal one. Griffin ranks first in completion percentage while Luck ranks 32nd, but that has as much to do with the throws they’re asked to make as each quarterback’s accuracy. Luck‘s average pass attempt has traveled 10.2 yards past the line of scrimmage, the longest average pass distance in the league (this was before “Monday Night Football”; Jay Cutler was second at 9.9 entering the game). Griffin averages 7.9 yards downfield per pass attempt, slightly below the league average of 8.2.

And Luck’s long average pass distance isn’t simply a product of throwing lots of incomplete passes down the field. His average pass distance on completions is 8.6 yards past the line of scrimmage, also highest in the N.F.L. (Cutler was fourth at 8.3 entering Monday night). Griffin’s completions come an average of 5.8 yards from the line of scrimmage, well below the league average of 6.5.

Those numbers agree with Brian Burke’s data at Advanced NFL Stats, which show that Griffin has thrown only 14 percent of his passes 15-plus yards past the line of scrimmage, the lowest rate in the league. Luck has thrown only 11 percent of his passes at or behind the line of scrimmage, while Griffin is in an offense that has let him throw 44 passes at or behind the line, accounting for 23 percent of his attempts. Coach Mike Shanahan and his offensive coordinator, Kyle Shanahan, deserve credit for molding an offense that fits Griffin’s strengths. Unfortunately for Luck, nothing is being made easy for him in Indianapolis.

Yards After the Catch

Casting Luck as a downfield thrower is true, but only half the story. Unlike many rookie quarterbacks, whether through design or lack of talent, Luck rarely has a running back as a checkdown option. According to Footballguys.com, Colts running backs have been targeted on just 7 percent of all Indianapolis passes, the lowest mark in the league. Conversely, Colts receivers have been targeted on 72 percent of Indianapolis attempts, the highest mark in the N.F.L.

In the same vein, much of Griffin’s production has come via yards after the catch. On average, passers in 2012 have gained 56 percent of their yards through the air and 44 percent on yards after the catch by their receivers. For Griffin, 51.4 percent of his yards have come via his receivers after the catch, the fifth-highest mark in the league. Luck, in large part because of his downfield passing, has gained 68.9 percent of his yards through the air, the highest percentage in the league, and therefore has been helped the least in terms of yards after the catch.

However, simply putting the stats in this context does not mean that Luck has been a better passer than Griffin; rather, it is to simply close the extraordinary gap created by traditional statistics. Griffin’s completion percentage and yards per attempt average are still more impressive even after adjusting for the difficulty of his throws. If we looked simply at their passing numbers, even ESPN’s Total QBR would rank Griffin ahead of Luck, by a score of 68.7 to 60.7. And while you know there is more to being a quarterback than just passing, you might be surprised to learn that looking at those things actually vaults Luck ahead of Griffin.

You can read the rest of the article here.

{ 1 comment }

Extreme Outliers: Rookie Edition

Griffining: Playing for a coach that tries to help you.

Both Andrew Luck and Robert Griffin III have been very successful this year. Griffin ranks 2nd in Y/A, 2nd in AY/A, 4th in NY/A, and 4th in ANY/A, an incredible performance nearly across the board (he’s 23rd in sack rate) by the Redskins rookie. He also is leading the league with a 69.1% completion rate and ranks 5th in passer rating. Luck ranks only 23rd in Y/A, 22nd in AY/A, 21st in NY/A, and 18th in ANY/A, respectable numbers for a rookie but on the surface, little more than that. He does rank 7th in sack rate, which is an excellent sign, but he ranks last in the NFL in completion percentage (in the non-Mark Sanchez division) and only 25th in passer rating.

But there are some other stats out there that paint a different picture. ESPN’s Total QBR ranks Griffin 11th overall — slightly below most of his other metrics — but ranks Luck as the fourth most effective quarterback so far this season. Also, despite Griffin’s edge in most metrics, the Colts and Redskins are essentially tied in three key drive metrics — points per drive, yards per drive and drive success rate — and I don’t think that’s because Donald Brown is so awesome. As Nate Dunlevy pointed out to me, one reason for this is that Luck has accumulated a large number of rushing first downs: Luck is tied for the league lead with Arian Foster on third down rushes that resulted in a first down. And once you account for strength of schedule, Luck vaults to #1 on the QBR list.

But let’s put aside effectiveness for right now. Some advanced metrics show you that they’ve been skinning cats in very different ways:

  • According to Advanced NFL Stats, Luck has thrown a pass 15 yards past the line of scrimmage on 24.3% of his throws, the 5th highest rate in the league. Griffin ranks 32nd with a deep rate of just 12.2%, ahead of only Matt Hasselbeck.
  • If you completely removed Yards After the Catch from the equation, Luck would rank in the top 10 at 4.5 yards per attempt while Griffin would rank 25th with just 3.5 yards per attempt.
  • Griffin ranks third behind just Christian Ponder and Philip Rivers when it comes to percentage of passing yards that are due to YAC, at 58.7%; Luck ranks 32nd, ahead of only John Skelton and Mark Sanchez, with only 33.4% of his yards coming on yards after the catch by his receivers.
  • According to Footballguys.com’s subscriber content, the Colts have targeted their wide receivers on 72.1% of their passes, the second highest rate in the league behind the Rams. The Colts are also last in the league with only 6.4% of their passes aimed at running backs (this also jives with the numbers from Mike Clay of Pro Football Focus.). The Redskins are more middle of the road in these metrics, but Andrew Luck is being forced to rely on his wide receivers with no real receiving threat in the backfield to help him out. As a result, it’s probably not too surprising that his completion percentage is so low.

Luck has also excelled in the two-minute drill and no-huddle situations early this year, although Griffin has been no slouch in those departments, either. But it’s clear that the Colts — rightly or wrongly — aren’t treating Luck with kid gloves. In fact, one could argue that they’re treating him no differently than they did Peyton Manning. Luck is averaging 44.3 pass attempts per game so far this season, second behind only Drew Brees. With a mediocre defense and a bad running game, the Colts are basically putting each game in the hands of Luck to win. Griffin is averaging only 27.8 pass attempts per game right now, and the Redskins have done a fantastic job molding the offense to to suit Griffin’s strengths.

Griffin’s numbers are better right now — ESPN excluded, of course — but that may be a reflection that the Shanaclan is more nurturing than Bruce Arians. Griffin’s success is outstanding, but Luck has been doing just as well under much more challenging conditions.

Update: Jeff Bennett, one of the creators behind ESPN’s Total QB, e-mailed me some notes this morning:

We break rushing out into two categories, scrambles and designed rushes. The quarterback receives more credit for scrambles then designed rushes – the reason being designed rushes are, well, designed to help the quarterback get more yards on the rush. Scrambles are not. Whatever positive or negative that comes from those is mostly on the quarterback.

So back to Luck. He has nine first down rushes this season on scrambles, most in the NFL. Seven of the nine have come on 3rd down, which generally is more important since the alternative to not picking up a 1st down is likely a punt instead of 2nd or 3rd down. No one else in the league has more than three 1st down rushes on scrambles.

Luck’s average pass is traveling 9.8 yards downfield this season. That is the third longest average pass distance in the league (behind Joe Flacco and Jay Cutler). Griffin averages 7.2 yards, a full yard below league average.

The average quarterback this season is getting 56% of their passing yards via “air yards” (meaning 44% of yards are coming after the catch). Griffin has 43% of his yards through the air. Luck has 68%.

{ 3 comments }