≡ Menu

Farewell to one of the greats

Farewell to one of the greats

Detroit Lions superstar wide receiver Calvin Johnson has likely retired. He had a pretty incredible six-year peak: Megatron gained 8,548 receiving yards in his last six years, the most by any player during their age 25-30 seasons. I don’t think there’s much of a debate that Johnson is a Hall of Famer, although I do think he’s not quite an inner circle member of the Hall.

The big reason for that is Johnson’s numbers have always been inflated by playing on a pass-happy team.  I’ve looked at this before, but (a) those numbers are now two years stale and (b) I want to use a different methodology today. So here’s what I did:

1) Calculate the number of pass attempts per game for each team in every season.

2) For the top 200 players, I then calculated the number of career games for that player.

3) Then, in each season, weight the number of team pass attempts per game by the percentage of games that player played relative to his entire career. For example, Johnson played 11.9% of his career games in 2012, and that year, the Lions threw 46.3 pass attempts per game. Therefore, for Johnson’s career, 46.3 pass attempts per game will be given a weight of 11.9%. Do this for every season of each player’s career, and you will derive the average pass attempts per game for that player. [continue reading…]

{ 20 comments }

Over the last three seasons, Calvin Johnson has caught 5,137 yards of passes. That’s an incredible amount, and the most by a player over any three-year span in NFL history. That stat by itself isn’t proof of Johnson’s greatness – after all, Detroit has thrown 2,040 passes over the last three years, also the most in any three-year span in football history. But records are not just about greatness: records are a function of era, teammates, and many more elements than pure ability.

So can Calvin Johnson break Jerry Rice’s career receiving yards record? The odds are very long that Johnson will go down in history as a better receiver than Rice, but his odds at breaking his receiving yards record – almost by definition – are a little higher. The man known as Megatron has 9,328 career receiving yards, the third most of any player through his age 28 season. That gives him a 1,462-yard lead on Rice at this age, although Johnson will have to keep up his outstanding pace for a very long time if he wants to capture the record. As the graph below shows, Johnson has had an edge on Rice in career receiving yards through every age of his career to date, but it was Rice’s work in his thirties that separated the GOAT from the pack: [continue reading…]

{ 18 comments }

Over the last three years, Calvin Johnson has 5,137 receiving yards in 46 games.  That’s an average of 111.7 receiving yards per game, the most by any player over a three-year stretch in NFL history.  That mark comes with a bit of an asterisk, of course, as the Lions have attempted 2,040 passes since the start of the 2011 season, also an NFL record; that’s why I like using True Receiving Yards and various other WR Ranking Systems rather than just raw receiving yards.

But hey, trivia is trivia, and Johnson is the current record holder.  But prior to 2013, do you know who held the record for receiving yards per game over a three-year stretch? The answer is not Jerry Rice, or else this would be a really lame trivia question.  Rice averaged 101.0 receiving yards per game from 1993 to 1995, and is one of just three players to average over 100 receiving yards per game for a three-year stretch.  Megatron also averaged 101.4 receiving yards per game from 2010 to 2012, but he only became the 3-year king after the conclusion of the 2013 season.

Trivia hint 1 Show


Trivia hint 2 Show


Trivia hint 3 Show


Click 'Show' for the Answer Show


I suspect you’ll also be surprised to see who would is number 4 on the list of most receiving yards per game over a three-year span (counting each player only once, of course).

Trivia hint 1 Show


Trivia hint 2 Show


Trivia hint 3 Show


Click 'Show' for the Answer Show
[continue reading…]

{ 7 comments }
Megatron at his best

Megatron at his best.

In his seven-year career, Calvin Johnson has already recorded 9,328 receiving yards. And for those curious about these sorts of things, he’s the career leader in receiving yards per game at 88.0, too. But Johnson has also benefited greatly from playing on teams that have thrown a weighted average of 635 pass attempts per season.

What is a weighted average of team pass attempts? I’m defining it as an average of pass attempts per season weighted by the number of receiving yards by that player. Why use that instead of a simple average? When thinking about whether a receiver played for a run-heavy or pass-happy team, we tend to think of that receiver during his peak years. If he caught 10 passes for 150 yards as a rookie on a very pass-happy team, that should not be given the same weight as the number of pass attempts his team produced in his best season. For example, here is how I derived the 635 attempt number for Megatron.

Twenty-one percent of his career receiving yards came in 2012, when Detroit passed 740 times (excluding sacks). Therefore, 21% of his team pass attempts average comes from that season, while 18% comes from his 2011 season, 16% from his 2013 season, and so on. In the table below, the far right column shows how we get to that 635 figure: by multiplying in each season the percentage of career receiving yards recorded by him in that season by Detroit’s Team Pass Attempts.

YrRecYdTPAPercTM * %
2013149263416%101.4
2012196474021.1%155.8
2011168166618%120
2010112063312%76
200998458510.5%61.7
2008133150914.3%72.6
20077565878.1%47.6
Total93284354100%635.2

There are 121 players with 7,000 career receiving yards. Unsurprisingly, Johnson has the highest weighted average number of team pass attempts, which must be recognized when fawning over his great raw totals. Marques Colston is just a hair behind Johnson, but no other player has an average of 600+ team pass attempts.

The table below contains data for all 121 players (by default, the table displays only the top 25, but you can change that). Here’s how to read it, starting with the GOAT: Jerry Rice ranks first in career receiving yards, and he played from 1985 to 2004. Rice played in 303 games, gained 22,895 receiving yards, and his teams threw a weighted average of 547 passes per season. Among these 121 players, that rank Rice as playing for the 25th highest or most pass-happy team. Rice also averaged 76 receiving yards per game, which ranks 5th among this group. [continue reading…]

{ 16 comments }

True Receiving Yards, Part I

One of many Rams greats to wear #29

One of many Rams greats to wear #29.

As you guys know, Neil Paine is the man. Here’s the latest reason: he came up with a metric called True Receiving Yards, the latest in a long line of thoughts in our Wide Receiver Project. So, what are True Receiving Yards?

We start with Adjusted Catch Yards, defined as 5 * Receptions + Receiving Yards + 20 * Receiving Touchdowns.

1) Then, we convert each player’s Adjusted Catch Yards to the same scale as pure receiving yards using the following formula:

Adjusted Catch Yards * League Receiving Yards / League Adjusted Catch Yards

2) Next, we adjust for how often the receiver’s team passed.  We use the following formula:

[Result in Step 1] * League_Avg_Team_Pass_Attempts / Team_Pass_Attempts

For purposes of this post, Team Pass Attempts include sacks.

3) Then we adjust for the league passing environment, by using this formula:

[Result in Step 2] * by (214.54/Avg_Team_Receiving_Yards_Per_Game).

Why 214.54? Because that’s how many yards the average NFL team has passed for in each season since 1970.

4) Finally, we need to adjust for schedule length. This one’s pretty simple:

[Result in Step 2] * 16 / Team Games

As it turns out, the single-season leader in True Receiving Yards is….. Harold Jackson for the 1973 Rams. That will probably surprise some folks; heck, it surprised me. So let’s walk through Jackson’s season by comparing it to Calvin Johnson’s 2012. Jackson caught 40 passes for 874 yards and 13 touchdowns. That gives him 1,334 Adjusted Catch Yards, while Megatron’s 122-1964-5 translates to 2,674 Adjusted Catch Yards, more than twice what Jackson produced.

1) First, we need to convert those ACY numbers into receiving yards.  In 1973, that conversion ratio is 65.5%, and in 2012, it was 64.5%; this means Jackson is credited with 874 receiving yards (ironically, his actual number) while Johnson is pushed down to only 1,725 yards. This is because Johnson had a ton of yards but only five touchdowns.  In other words, based on his receptions, receiving yards, and receiving touchdowns, Johnson was more like a 1,725-yard receiver last year.

2) Jackson’s Rams had just 288 Team Pass Attempts, while the average team in 1973 averaged 373.3 pass attempts. So we need to bump Jackson up by 29.6%, which would give him 1,132 receiving yards. The 2012 Lions had 769 Team Pass Attempts compared to a league average of 592.4; therefore, we need to give Johnson credit for only 77% of his ACY, bringing him down to 1,329 receiving yards.

3) Next, we adjust for league environment. In 1973, the average team passed for 159 yards per game, which means we need to bump Jackson up by 34.6% (the result of 214.54 divided by 159); this gives him 1,524 receiving yards. For Megatron, since the average team in 2012 passed for 246 yards per game, we need to multiply his result in step 2 by 87.2%, leaving him with only 1,159 receiving yards.

4) For Calvin Johnson, that’s it: he is credited with 1,159 True Receiving Yards, after reducing his numbers for playing in a pass-happy offense, playing in a pass-happy era, and not having many touchdowns. For Jackson, his 1,524 gets pro-rated to a 16-game season, giving him 1,742 True Receiving Yards.
[continue reading…]

{ 33 comments }

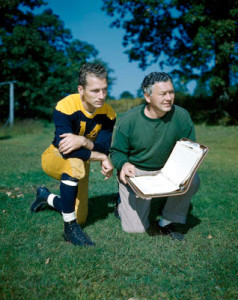
Don Hutson and Curly Lambeau

Don Hutson is down with era adjustments.

I’ve written several posts about how to grade wide receivers and did a three-part series on one ranking system two weeks ago. Grading wide receivers requires one to adjust for era, but there are many different ways to do that.

Calvin Johnson caught 122 passes last year for 1,964 yards and five touchdowns. In 1973, Harold Carmichael had 67 receptions, 1,116 yards and nine scores. Which season was better? You might be inclined to think Johnson’s season was much better regardless of era, but both receivers led their respective leagues in both receptions and receiving yards. But let’s think about it another way.

In 1973, all the players on the 26 teams in the NFL combined for a total of 4,603 catches and 58,009 receiving yards. That means Carmichael was responsible for 1.46% of all receptions and 1.92% of all receiving yards. Of course, with only 26 teams, we need to multiply those numbers by 26/32 make for an apples-to-apples comparison of the modern environment. If we want to transport Carmichael into 2012, that means he needs to be credited with 1.18% of all receptions and 1.56% of all receiving yards accumulated last year. That would give him 128 catches and 1,970 receiving yards, and thanks to recording 1.93% of all receiving touchdowns in 2012, 14.6 touchdowns.

This analysis is actually unfair to active players, as there are more three-, four-, and five-wide receiver sets than ever before. Elroy Hirsch gained 1,495 receiving yards in 12 games — an outstanding rate of production in any era — but that translates to an absurd 2,667 receiving yards in 2012. In Don Hutson’s magical 1942 season, after multiplying by 10/32, he gained 2.3% of the league’s receptions, 2.8% of the receiving yards, and 4.9% of the touchdowns — for a 254/3501/37 stat line.
[continue reading…]

{ 6 comments }

The predictive value of target data, part II

On Monday, I argued that target data has some predictive value. I wanted to update that post with a few observations.

Wide Receiver Targets

In the original post, I looked at year-to-year data for all players with at least 500 receiving yards in Year N and at least 8 games played for the same team in Years N and N+1. But it makes more sense to limit the sample to only wide receivers if we want to predict how wide receivers project in the next season.

There are 554 pairs of wide receiver seasons that meet the above criteria. [1]I have again pro-rated all seasons to sixteen games. The best fit formula to project future receptions based on prior receptions and prior targets is:

Year N+1 Receptions = 14.0 + 0.547 * Yr_N_Rec + 0.124 * Yr_N_Tar

The R^2 is 0.39, and while the receptions variable is statistically significant by any measure, the targets variable just barely qualifies (p = 0.044) as such. Still, this tells us that for every 8 additional targets a receiver sees in Year N, we can expect one more reception in Year N+1, holding his number of receptions equal.

If we want to project receiving yards instead of receptions, we get:

Year N+1 Receiving Yards = 180.3 + 0.434 * Yr_N_RecYd + 2.55 * Yr_N_Tar

The R^2 is 0.33, implying a slightly less strong relationships, which makes sense: yards are more variable to large outliers than receptions, so you would expect receiving yards to be slightly harder to predict. Another interesting note: the targets variable here is statistically significant at the p = 0.0003 level, and as expected, the receiving yards variable is statistically significant at all levels. Holding receiving yards equal, a receiver would need an additional 19 targets to increase his projected number of receiving yards by 50, so the practical effect may not be all that large.

Addressing the multicollinearity problem
[continue reading…]

References

References
1 I have again pro-rated all seasons to sixteen games.
{ 2 comments }

Analyzing the leaders in targets in 2012

Reggie Wayne led the NFL in targets last year, but that’s a little misleading since the Colts ranked 6th in pass attempts. As a percentage of team targets, Wayne ranked second in the league, but he was a distant number two to Brandon Marshall, who saw two out of every five Bears passes in 2013.

But that doesn’t make him the best receiver. It was easier for Marshall to receive a high number of targets because the rest of the Chicago supporting cast was weak, so Jay Cutler consistently looked Marshall’s way. Chicago ranked 25th last year in Adjusted Net Yards per Attempt, so essentially we have a player on a bad passing offense receiving a ton of targets. It’s not all that obvious how you compare a player like that to Roddy White, who deserves credit for being in a great passing offense but loses targets because of the presence of Julio Jones and Tony Gonzalez (of course, without them, would Matt Ryan start looking like Jay Cutler?)

I identified the leader in targets for each team, and then calculated the percentage of team targets each leading receiver had in 2012. The table below lists that percentage on the Y-Axis; the X-Axis represents the number of ANY/A that player’s team averaged. Someone like Marshall (represented by the first four letters of his last name and the first two letters of his first name, MarsBr) will therefore be high and to the left, while Randall Cobb is low and to the right:

2012 targets
[continue reading…]

{ 16 comments }

The off-season is here.

But Football Perspective isn’t going anywhere. I prefer off-season writing to in-season writing, as football theory and history is more compelling to me than figuring out whether to rank the Lions ahead of the Bills. At the old Pro-Football-Reference Blog, we did some of our best work in the off-season, and I hope for the same results here.

Evan Silva just published a great piece detailing what each team needs in the off-season, but you’re not going to find that type of article here in the off-season. I will have some draft articles, but I don’t intend on staying topical all that often. My first big off-season project is to come up with a wide receiver ranking system.

I won’t bore you with all the details yet, but I think grading wide receivers (or for that matter, receiving tight ends) is much, much more complicated than people realize. I hope you guys are excited to participate the discussion, as I am in the early stages of this project and will go where the research takes me. One possible result I envision: the ultimate wide receiver ranking system does not exist, but a series of four or five ranking systems might give us the complete picture of a wide receiver.

Let me start with a question: which team had a better passing offense last year, Houston or Detroit? For now, try to ignore what we saw out of Matt Schaub in the post-season and just focus on the regular season results.
[continue reading…]

{ 34 comments }

Three weeks ago, I set forth the argument that perhaps Calvin Johnson was not even the most productive receiver in his own division. While Megatron racked up the numbers, I argued that you have to account for the situation. The relevant situation here is that the Lions ran an incredible 1,160 plays compared to just 999 for the Bears, and Detroit attempted 740 passes while Chicago threw only 485 times.

When one team throws 255 more passes than the other, I don’t think it’s appropriate to compare the receivers based on their raw receiving yards. One thing we could look at is yards per team attempt. The table below lists the number of team attempts for each wide receiver, his raw receiving statistics, and also his yards per attempt. The table is sorted by yards per team passing attempt. And while it is not relevant when discussing Marshall and Megatron, I have also included a Pro-rated Yards per Attempt column, which pro-rates the number of team attempts for the number of games played by the receiver (this helps Percy Harvin, of course).

RkPlayerTmGTmAttRecYdsYPRTDY/APY/A
1Brandon MarshallCHI16485118150812.8113.113.11
2Andre JohnsonHOU16554112159814.342.882.88
3Calvin JohnsonDET16740122196416.152.652.65
4Michael CrabtreeSFO164368511051392.532.53
5A.J. GreenCIN1654097135013.9112.52.5
6Vincent JacksonTAM1656672138419.282.452.45
7Demaryius ThomasDEN1658894143415.3102.442.44
8Steve SmithCAR1649073117416.142.42.4
9Roddy WhiteATL1661592135114.772.22.2
10Reggie WayneIND16628106135512.852.162.16
11Brian HartlineMIA1650474108314.612.152.15
12Wes WelkerNWE16641118135411.562.112.11
13Dez BryantDAL1665892138215122.12.1
14Steve JohnsonBUF1651179104613.262.052.05
15Victor CruzNYG1653986109212.7102.032.03
16Julio JonesATL1661579119815.2101.951.95
17Sidney RiceSEA16405507481571.851.85
18Eric DeckerDEN1658885106412.5131.811.81
19Mike WilliamsTAM165666399615.891.761.76
20Greg OlsenCAR164906984312.251.721.72
21Marques ColstonNOR1667183115413.9101.721.72
22Randall CobbGNB155588095411.981.711.82
23Golden TateSEA154054568815.371.71.81
24Dwayne BoweKAN134755980113.631.692.08
25Jeremy KerleyNYJ164935682714.821.681.68
26Cecil ShortsJAX145865597917.871.671.91
27Anquan BoldinBAL155606592114.241.641.75
28Jason WittenDAL1665811010399.431.581.58
29Lance MooreNOR156716510411661.551.65
30Davone BessMIA135046177812.811.541.9
31Malcom FloydSDG145285681414.551.541.76
32Torrey SmithBAL165604985517.481.531.53
33Tony GonzalezATL16615939301081.511.51
34Justin BlackmonJAX165866486513.551.481.48
35Jimmy GrahamNOR156718598211.691.461.56
36Mike WallacePIT155746483613.181.461.55
37Miles AustinDAL166586694314.361.431.43
38Pierre GarconWAS104424463314.441.432.29
39Josh GordonCLE165665080516.151.421.42
40Heath MillerPIT155747181611.581.421.52
41Brandon LloydNWE166417491112.341.421.42
42James JonesGNB165586478412.3141.411.41
43Percy HarvinMIN94836267710.931.42.49
44Jeremy MaclinPHI156186985712.471.391.48
45Brandon LaFellCAR144904467715.441.381.58
46Nate WashingtonTEN165404674616.241.381.38
47Antonio BrownPIT135746678711.951.371.69
48T.Y. HiltonIND156285086117.271.371.46
49Jermaine GreshamCIN165406473711.551.361.36
50Jordy NelsonGNB125584974515.271.341.78
51Larry FitzgeraldARI166087179811.241.311.31
52Santana MossWAS16442415731481.31.3
53Owen DanielsHOU155546271611.561.291.38
54Hakeem NicksNYG135395369213.131.281.58
55Brandon MyersOAK166297980610.241.281.28
56Vernon DavisSFO164364154813.451.261.26
57Chris GivensSTL155574269816.631.251.34
58Andre RobertsARI156086475911.951.251.33
59Danario AlexanderSDG105283765817.871.251.99
60Donnie AveryIND16628607811331.241.24
61Brandon GibsonSTL165575169113.551.241.24
62Rob GronkowskiNWE116415579014.4111.231.79
63Leonard HankersonWAS164423854314.331.231.23
64Danny AmendolaSTL115576366610.631.21.74
65Jermichael FinleyGNB165586166710.921.21.2
66Dennis PittaBAL16560616691171.191.19
67Denarius MooreOAK156295174114.571.181.26
68Martellus BennettNYG165395562611.451.161.16
69Kendall WrightTEN15540646269.841.161.24
70Josh MorganWAS164424851010.621.151.15

Why can't we throw it like the Lions do??

Why can't we throw it like the Lions do??


As it turns out, Calvin Johnson was neither the best Johnson nor the best receiver in his division, at least as measured by this metric. I’m not convinced or even arguing that yards/attempt is the best way to rank receivers, but I do think the statistic represents an improvement on just receiving yards. Since receiving yards are so highly correlated with attempts, some adjustment needs to be made, and I plan on providing more analysis on how to grade wide receivers this off-season.
[continue reading…]

{ 3 comments }

NYT Fifth Down: Post-week 16

This week at the New York Times I looked at some record-breaking performances from week 16.

Sunday was a record-setting day in the N.F.L. In case you missed it …

  • The rookie Minnesota Vikings kicker Blair Walsh connected on a 56-yard field goal in the second quarter against the Texans, making him the first kicker with nine field goals of 50 yards or longer in a season. Even more impressive: Walsh is 9 of 9 from 50-plus yards this year.
  • Kansas City rushed for 352 yards against the Colts, easily breaking the record for rushing yards gained in a losing effort and also for rushing yards differential in a loss. How do you lose when you rush for so many yards? Brady Quinn threw an interception that was returned for a touchdown and threw another pick in the Colts’ end zone. Another Chiefs drive ended on a fumble inside the Colts’ 20-yard-line. But the turning point of the game may have been when Quinn was stuffed on a fourth-and-1, one of the few times in the game that the Colts’ run defense won the battle at the line of scrimmage.
  • In the same game, Jamaal Charles recorded the 750th carry of his career, giving him enough rushing attempts to be eligible for the career yards-per-carry title. Jim Brown averaged 5.22 yards per carry during his Browns career. That’s now second highest among running backs in N.F.L. history. Charles has a mind-boggling 5.82 average gain over his five-year career.
  • Brown might take a back seat to another running back this season. Buffalo’s C.J. Spiller has averaged 6.48 yards per carry this year on 183 carries, the highest single-season average of any player with that many carries. The previous record holder was Brown, who averaged 6.40 yards per rush in 1963.
  • It’s been another remarkable season for Atlanta’s Tony Gonzalez, but he actually was nudged out of the record books this weekend. In 2004, Gonzalez set the single-season record for receptions by a tight end with 102, but Dallas’s Jason Witten caught his 103rd pass of the season in overtime against the Saints on Sunday.
  • The Seattle Seahawks have outscored their last three opponents, 150-30. That 120-point margin of victory is the largest differential in a three-game span in 70 years. In 1942, the Chicago Bears won three straight games and did it with a combined 127-7 score; the year before, Chicago outscored its opponents, 136-14, over a three-game stretch.

Mega Record for Megatron

Of course, the most noteworthy individual record to fall this past weekend was Jerry Rice’s single-season receiving record of 1,848 yards. Calvin Johnson needed only 15 games to break the record Saturday night, and with 1,892 yards, he has a good chance of becoming the first N.F.L. receiver to hit the 2,000-yard mark.

With 225 yards against the Falcons, he also became the first player to gain 100 receiving yards in eight straight games and to collect 10 receptions in four straight games. For Johnson, it was his fifth career game (including the postseason) with at least 200 receiving yards, tying him with Lance Alworth and Rice for the most 200-yard games since 1960.

Detroit has averaged 47 pass attempts per game, and will set the single-season record for attempts on its 12th pass attempt Sunday. Most of those passes have come from the right arm of Matthew Stafford, who threw 663 passes in 2011, (now) the fourth-highest number ever. On his seventh pass in Week 17 against the Bears, he’ll set the record, and he needs just 15 passes to become the first quarterback with 700 pass attempts in a season.

You can check out the full post here.

{ 1 comment }

NYT Fifth Down: Post-week 15

A double post at the New York Times this week.

Did you know that Alex Smith is seven attempts away from qualifying for eligibility for certain rate-based statistics? If Jim Harbaugh wants to game the system — and this is Harbaugh — he could ptobably that Smith breaks the completion percentage record, set by Drew Brees in 2011.

I also looked at how the playoff field will be very familiar this year:

With two weeks remaining in the N.F.L. regular season, seven teams have clinched a playoff berth and several more can clinch this weekend. Chances are, two weeks from now, the teams in the playoffs will look pretty familiar to N.F.L. fans.

In the A.F.C. in 2011, the Patriots, the Ravens, the Texans and the Broncos won the East, North, South and West Divisions. New England, Houston and Denver have already clinched their divisions in 2012, and even the free-falling Ravens are still the favorites to win the A.F.C. North. That would give the conference four repeat division winners, a first since the league moved to the four-division format in 2002.

Last year, the Pittsburgh Steelers and Cincinnati Bengals were the two wild-card teams. Well, those two teams are currently battling for a wild-card spot, and it would be a surprise if both teams are left out of the playoffs. That would leave one spot in the A.F.C., which is most likely going to go to the Indianapolis Colts. The Colts did not make the playoffs in 2011 — in fact, the team had the worst record in the league — but they did make the playoffs every year from 2002 to 2010.

From 2009 to 2011, half of the conference — the Ravens (6), Jets (6), Patriots (5), Steelers (4), Colts (4), Broncos (2), Texans (2), and Bengals (2) — played in 31 of the A.F.C.’s 33 playoff games, and barring the miraculous (the 6-8 Dolphins are technically still alive), that won’t change this year. The last time a Tom Brady-led team didn’t make the playoffs was in 2002; the last time Peyton Manning’s team missed out on the postseason was in 2001. In the A.F.C., some things never change.

The N.F.C. features only slightly more turnover. Green Bay is going to the playoffs for the fourth straight season while Atlanta will be there for the fourth time in the five-year Matt Ryan/Mike Smith“>Mike Smith era. San Francisco has a good chance of securing a first-round bye for the second year in a row. That leaves just three remaining spots.

Seattle, winner of a playoff game just two years ago, is likely to be back in the postseason as well. The Giants, winners of two of the last five Super Bowls, will make the playoffs if they win their final two games. Chicago and Dallas are no strangers to the playoffs, and one might make it again this year. The real “surprise” teams in the N.F.C. are Minnesota — which did go to the N.F.C. championship game three years ago — and Washington. Andrew Luck and Robert Griffin III were the first two picks in the draft and may power their teams to the playoffs this year. When it comes to the 2012 season, that qualifies as unpredictable.

Your weekly updates on Adrian Peterson and Calvin Johnson

At this point, it’s getting impossible to write a statistical column without talking about Adrian Peterson“>Adrian Peterson. The Vikings gained just 322 yards against the Rams on Sunday, but Adrian Peterson“>Adrian Peterson ran for 212, accounting for 66 percent of the Minnesota offense. It was the fourth time this season — and in the last two months — that Peterson has rushed for at least 8 yards per carry on 15-plus carries; since 1960, only Barry Sanders (5) and Peterson have accomplished such a feat in a season.

In one of the most incredible stats of this or any year, Peterson has rushed for 1,313 yards in his last eight games, the most by a player in an eight-game stretch since at least 1960. From 1960 to 2011, only four men rushed for 1,200 yards in that span. In 1977, Walter Payton rushed for 1,221 yards over an eight-game stretch; three years later, Earl Campbell rushed for 1,245 yards in half a season. In 2005, Kansas City’s Larry Johnson gained 1,244 rushing yards in the last eight games of the year. Before Peterson, Eric Dickerson held the record for rushing yards in an eight-game stretch; Dickerson rushed for 1,292 yards in the last five games of the ’84 season and the first three games of 1985.

For more on Peterson and Calvin Johnson, along with some interesting week 15 stats, check the full article here.

{ 0 comments }

I’ve noted a few times this year that Calvin Johnson, in his pursuit of Jerry Rice’s single-season receiving record, has quite an advantage on his side. The Lions have attempted more passes through 13 games of any team ever, and seem likely to break the pass attempts record.

Obviously it’s easier to gain more receiving yards when your team is throwing the ball nearly every play. That’s why when I came up with my Greatest WR Ever series, I looked at receiver performance per pass attempt.

I don’t have time for a nuanced analysis of wide receiver, but let’s just look at a simple statistic: receiving yards per team pass attempt. That’s what the table below shows, along with each player’s rank in receiving yards (the far left column). Brandon Marshall has 1,342 receiving yards while the Bears have only attempted 444 passes this year (including sacks). That means he’s averaging more than three yards per team pass attempt, which is incredible. Of course, it also speaks to the lack of other weapons in Chicago.

Ryds RkPlayerTmRecRydsTDTMATTYds/AttY/A Rk
2Brandon MarshallCHI101134294443.021
7Vincent JacksonTAM56114584422.592
4Andre JohnsonHOU82120934712.573
1Calvin JohnsonDET96154656182.54
6A.J. GreenCIN791151104782.415
5Demaryius ThomasDEN74119785032.386
12Steve SmithCAR6099924252.357
9Wes WelkerNWE95111645192.158
3Reggie WayneIND94122045692.149
8Roddy WhiteATL77114055352.1310
11Victor CruzNYG76100494792.111
14Brian HartlineMIA6292514422.0912
28Michael CrabtreeSFO6676153831.9913
13Julio JonesATL6399775351.8614
22Dwayne BoweKAN5980134361.8415
10Dez BryantDAL75102895671.8116
45Sidney RiceSEA4565873651.817
26Steve JohnsonBUF6177654321.818
24Davone BessMIA6177814421.7619
19Anquan BoldinBAL5882844821.7220
35Jeremy KerleyNYJ5272824351.6721
31Mike WilliamsTAM4673674421.6722
20Cecil ShortsJAX4382475001.6523
39Greg OlsenCAR5469154251.6324
25Randall CobbGNB7177774841.6125
15Marques ColstonNOR6588985591.5926
42Percy HarvinMIN6267734291.5827
23Eric DeckerDEN6479085031.5728
29Torrey SmithBAL4375374821.5629
18Tony GonzalezATL8183175351.5530
16Jason WittenDAL9288015671.5531
27Malcom FloydSDG5477555031.5432
17Lance MooreNOR5384845591.5233
32Josh GordonCLE4273254871.534
21Miles AustinDAL5581955671.4435
30Rob GronkowskiNWE53748105191.4436
34Mike WallacePIT5972885091.4337
47Hakeem NicksNYG5065234791.3638
44Jordy NelsonGNB4665864841.3639
59Brandon LaFellCAR3457744251.3640
72Golden TateSEA3749273651.3541
40Heath MillerPIT6167975091.3342
52Jermaine GreshamCIN5563654781.3343
70Vernon DavisSFO3850653831.3244
53Owen DanielsHOU5262264711.3245
49Nate WashingtonTEN3964844991.346
33Brandon MyersOAK7072845611.347
38DeSean JacksonPHI4570025411.2948
36Jimmy GrahamNOR6471085591.2749
58Chris GivensSTL3658434641.2650
{ 13 comments }

NYT Fifth Down: Post-week 13

This week at the New York Times, I blush when discussing Andrew Luck, praise the great Calvin Johnson as he tries to surpass Jerry Rice (but with a caveat), and take a look at some other random stats (including some absurd numbers from Adrian Peterson). Trivia: Brandon Marshall has gained over 1,000 yards on both the Bears and Broncos in seasons in which Jay Cutler was his primary quarterback both seasons. Can you name the only two other wide receivers to gain 1,000 yards with multiple teams but the same passer?

It’s not supposed to be this easy.

Sure, Steve Young and Aaron Rodgers followed Joe Montana and Brett Favre and excelled, but the fact that those examples are so memorable shows that they are the exception to the rule.

You’re not supposed to be able to replace a Hall of Fame quarterback with another star. In Indianapolis, the Colts got a taste of what life is often like for a team in the first year after a franchise quarterback’s exit: Curtis Painter, Dan Orlovsky and Kerry Collins earned every bit of their combined 2-14 record in 2011. But after the Colts bottomed out, Indianapolis’s fortunes changed dramatically. With the first pick in the 2012 draft, the team selected Stanford’s Andrew Luck, and the Colts appear set to be an annual contender for the next decade. Again.

Luck ranks fourth in passing yards this season, and he has shouldered the load for a Colts team that is below average in rushing, stopping the run and stopping the pass. Luck ranks “only” 19th in Adjusted Net Yards per Attempt and 14th in Net Yards per Attempt, unimpressive numbers only outside of the context of a rookie quarterback playing for what was the worst team in the N.F.L. a year ago. Luck passes the eye test and at least one advanced metric (before last night’s game, Luck ranked 6th in ESPN’s Total QBR), but part of what’s impressive about him is that even when he isn’t playing well, he remains capable of carrying his team to victory. Luck struggled for much of the game against Detroit on Sunday but still managed to pull out a most improbable victory.

In the first 56 minutes of the game, Luck was 17 for 39 for 279 yards with three interceptions. His team trailed the Lions, 33-21, with under three minutes remaining. At that point, Advanced NFL Stats calculated Indianapolis’s odds of winning at 2 percent.

But Luck led them on two scoring drives, and the Colts became just the seventh team to win a game despite trailing by 12 or more points with so little time remaining since 2000. Two of the other instances involved Peyton Manning with the Colts. In 2003, Manning led the Colts on a marvelous comeback against the Buccaneers on “Monday Night Football.” Six years later, Indianapolis trailed New England, 34-21, with 2:30 remaining. A Colts touchdown was followed by three Patriots plays that gained 8 yards, setting up Bill Belichick’s infamous 4th-and-2 decision.

It will be a long time before Luck could be considered anywhere near Manning’s class in terms of body of work, but his performance against the Lions is now alongside many of Manning’s memories in the annals of great Colts moments. Luck’s game-winning touchdown to Donnie Avery was just the 13th game-winning touchdown pass in the final seconds of a game since 2000.

Statistically, Andrew Luck may not be having the best year, but he has played an enormous part in the Colts’ magical run. At 8-4, the Colts are almost certainly going to make the playoffs; if they do, they will join the 2008 Miami Dolphins and 1982 Patriots on the list of N.F.L. teams to make the playoffs a year after going 2-14 or worse.

Luck will also set a couple of rookie records. With the game-winning drive he led against the Lions, he tied Ben Roethlisberger and Vince Young for the most fourth-quarter game-winning drives (five) by a rookie quarterback. By defeating Detroit and earning his eighth win, he broke a tie with Sam Bradford and now has the most wins among rookie quarterbacks selected first over all since 1950. Luck’s next victory will give him nine wins this season, tying him with Chris Chandler for the franchise record for wins by a rookie quarterback.

Calvin Johnson and the Lions’ Passing Game

Calvin Johnson led the league with 1,681 receiving yards last season and was named a first-team All-Pro by The Associated Press for the first time in his career. His encore performance may be even better.

He has gained a mind-boggling 1,428 receiving yards this season, joining Elroy Hirsch (1,495 yards in 1951) on the short list of N.F.L. players to top the 1,400-yard mark in a team’s first 12 games (in the A.F.L., Charley Hennigan and Lance Alworth each reached that mark once as well).

You can read the full post (and the answer to the trivia question) here.

{ 1 comment }

Profiling Pat Studstill

Lions wide receiver present.

On Sunday, Calvin Johnson became just the second player in NFL history to gain at least 125 receiving yards in five consecutive games. He’s also the second Lion to hit those marks.

As you’ve probably figured it out by the title, the only player with 125+ receiving yards in five straight games prior to Johnson was Patrick Lewis Studstill Jr., who had an 11-year career with the Lions, Rams, and Patriots. Studstill was a first-team All-Pro wide receiver in 1966, when he led the NFL in receiving yards. Beginning in week 5 of that season, Studstill topped 115 receiving yards in six straight weeks. Those were six highest single-game yardage totals of his career.

Studstill was a receiver and punter at the University of Houston in the late ’50s, but his senior season was a disaster. Head coach Hal Lahar was your typical coach of the era when it came to rules, and Studstill violated a major one — by getting married. Lahar benched Studstill for his entire senior year, and as a result, Studstill went undrafted. One of the Cougars assistant coaches, Red Conkright, was a former NFL player who would later become the last head coach of the Oakland Raiders before Al Davis. Conkright vouched for Studstill, who received a tryout in Detroit. Because of his versatility and speed, he was able to make the Lions roster in 1961.

Studstill didn’t see the field much during his rookie season, but did manage a 100-yard kickoff return touchdown against the Bears. An injury to Terry Barr in 1962 opened the door for Studstill to begin making a contribution on offense. In the last 9 games of the season, Sutdstill caught 31 passes for 446 yards, second on the team in both categories to Pro Bowler Gail Cogdill.
[continue reading…]

{ 12 comments }

NYT Fifth Down: Post-week 10

This week at the New York Times I looked at several interesting statistical developments in both the 2012 season and in week 10.

Even in today’s pass-happy N.F.L., it pays to have one of the best running backs. In one of the bigger surprises of the season, the best of the best is Minnesota’s Adrian Peterson.

He’s a four-time Pro Bowler and a two-time first-team All-Pro selection, but few expected a big year out of Peterson. That’s because last year, on Christmas Eve, Peterson tore the anterior cruciate ligament and medial collateral ligament in his left knee against the Redskins. Such a brutal injury often permanently robs a player of his elite ability; the rule of thumb tells us that it’s not until the second full season after the injury that the player regains his old form, if he ever does.

An injury so late in the 2011 season had most people figuring his 2012 season would be a lost year. Instead, Peterson leads the league in rushing with 1,128 yards and is on pace for a remarkable 1,804. Peterson is the first player since 2009 to rush for 1,100 yards in his team’s first 10 games, and he’s showing no signs of slowing. He has rushed for 629 yards in his last four games, including an impressive 171 rushing yards in a victory over the Lions on Sunday.

Peterson is also averaging 5.75 yards per rush the season, the most among players with at least 100 carries. He joins Jim Brown, Walter Payton, Barry Sanders and Chris Johnson as players with 1,100 or more rushing yards and such a high yards-per-carry average after his team’s first ten games.

Minnesota’s passing game ranks 26th in Adjusted Net Yards per Attempt and last in the league in yards per completion, a sign of an offense that doesn’t stretch the field through the air. But despite a passing attack that doesn’t scare any defense, thanks to Peterson, Minnesota is 6-4 and a potential playoff team.

The Return of Megatron

For most of the season, N.F.L. fans wondered what was wrong with Calvin Johnson. It wasn’t until the final minutes of Detroit’s loss to the Vikings on Sunday that Matthew Stafford and Johnson connected on a touchdown pass this season (Johnson did catch a touchdown pass from Shaun Hill earlier this year). Well, after a 207-yard game against Minnesota, Johnson is again leading the league in receiving yards. With 974 yards in nine games, Johnson is actually ahead of last year’s pace, when he gained a league-high 1,681 yards. The big difference: in 2011, he caught 16 touchdown passes, but he has only two in 2012.

Continued Dominance in New England

When it comes to the Patriots, mind-boggling offensive numbers are the norm. That means we occasionally ignore just how impressively the New England machine is operating. The Patriots lead the league in points scored, yards gained and first downs. Since 1990, only the 1993 49ers, the 1997 Broncos, the 2001 Rams and the 2007 Patriots have finished first in each metric.

The Patriots are averaging 33.2 points per game, 3.1 points more than the second-place Broncos. At 430.3 yards per game, the Patriots far outpace the rest of the league; Detroit (406.1) is the only other team averaging more than 400 yards per game.

But where New England really stands out is the 259 first downs it has gained. Last year, New Orleans set the N.F.L. record for first downs in a season with 416; the 2011 Patriots also broke the old record (held by the 2003 Kansas City Chiefs) with 399. This year’s team is on pace for an incredible 460 first downs. And the Patriots are on pace to crush the record in a surprising way: New England leads the N.F.L. in rushing first downs with 92, and Stevan Ridley leads all running backs with 54 rushing first downs.

You can read the full article here.

{ 1 comment }