≡ Menu

Let’s compare two groups of 2018 receivers.

Group A

Adam Thielen
Odell Beckham
DeAndre Hopkins
Zach Ertz
Julio Jones

Group B

Brandin Cooks
George Kittle
Mike Evans
Tyreek Hill
Cooper Kupp

Which group of receivers would you rather have going forward? I think you know the answer to that question.

The receivers in Group A are the top 5 receivers this season as measured by one simple metric: yards multiplied by targets.

The receivers in Group B are the top 5 receivers this season as measured by another simple metric: yards divided by targets, based on a the players who rank in the top 50 this season in targets.

Here’s how to read the table below. Brandin Cooks has played 5 games this year and has seen 33 targets and gained 452 receiving yards. If you multiply his yards by his targets, he has 14,916, and his Yards x Target rank is 28th. On the other hand, he has averaged 13.7 Yards per Target, which ranks 1st in the league through five weeks. [continue reading…]

{ 1 comment }

Corey Coleman and Rookie WR Targets

corey coleman brownsThe Browns wide receiver depth chart is really, really thin.  As a result, Cleveland attacked the wide receiver position in the Draft, starting with Baylor Bear Corey Coleman at 15, making him the first wide receiver taken. The Browns followed that up with Auburn’s Ricardo Louis in the fourth round, and UCLA’s Jordan Payton and Colorado State’s Rashard Higgins in the fifth round. The veterans on the depth chart? There’s only Andrew Hawkins, Taylor Gabriel, Marlon Moore, and Terrelle Pryor (who has made a position switch from quarterback) remaining, after the team released Brian Hartline in late May.

Last year, the Browns threw 609 passes (ignoring sacks), the 11th most in the NFL. If you expect Cleveland to be bad again this year — which just about everybody does — that number may only go up. In 2013, Cleveland threw 679 times, as Josh Gordon and Jordan Cameron had breakout years. [1]In between, the Browns went 7-9 with an excellent pass defense that kept the team in games; I am not expecting that to happen again. Gordon is a key variable here, of course: his status for the 2016 season remains up in limbo and is in the commissioner’s discretion. [continue reading…]

References

References
1 In between, the Browns went 7-9 with an excellent pass defense that kept the team in games; I am not expecting that to happen again.
{ 16 comments }

The Travis Kelce Post

Last year, Jeff Cumberland finished #2 in DVOA among all tight ends.  This really happened.  Of course, that required some digging, so I wrote the following about Cumberland in the 2014 Football Outsiders Almanac:

What’s going on here? How did Cumberland produce such strong numbers, and wind up second in DVOA among tight ends? Among the 52 tight ends with at least 20 targets, Cumberland ranked fifth in yards gained through the air (per reception) and seventh in yards gained after the catch (per reception). Incredibly, [Ladarius] Green ranked first in both of those metrics, but there’s generally an inverse relationship between those two statistics: you either catch passes downfield, or you gain a lot of yards after the catch, but rarely both. In fact, Green and Cumberland were the only two tight ends to rank in the top 15 in both categories, which underscores just how impressive Cumberland’s efficiency numbers were in 2013.

So is Cumberland coming off a sneaky strong season and about to break out? There’s no denying that his efficiency numbers were great, but sometimes, the best course of action is to take a step back and look at the bigger picture. In 2012, Cumberland finished second on the team with 53 targets. In the offseason, New York allowed Dustin Keller to head to Miami, but instead of handing the job to Cumberland, signed Kellen Winslow. As a result, Cumberland wound up seeing only 40 targets in 2013. If the Jets were as high on Cumberland as his numbers would suggest, he would have managed to pick up more than 2.5 targets per game in one of the league’s most anemic passing attacks. Then, New York drafted Jace Amaro in the second round of the 2014 draft. Efficiency numbers are fun to look at, but the revealed preference of the Jets organization would seem to trump those metrics. And it appears as though the organization views Cumberland as a role player and little more.

Cumberland split time with Winslow, and his low target numbers were a strong indicator that he was an average talent. [1]In his defense, Cumberland was tied for 11th in yards per route run, but that’s (1) still a far cry from #2 and (2) more a reflection of the weakness of the 2013 Jets supporting cast. Yards per target is not a good stat because it is not very sticky; yards per route run is quite a bit better.  After all, a route run is more the analog of a “pass attempt” than a target, so YPRR is really the receiver’s version of yards per attempt.

The next great tight end?

The next great tight end?

This year, as he did in 2013, and 2012, and nearly in 2011, Rob Gronkowski leads all tight ends in yards per route run. He is averaging 2.67 yards per route run on his 304 routes, and the only receivers with a higher yards per route run average on over 225 routes are Demaryius Thomas (2.77) and Jordy Nelson (2.84). In short, Gronkowski is the man.

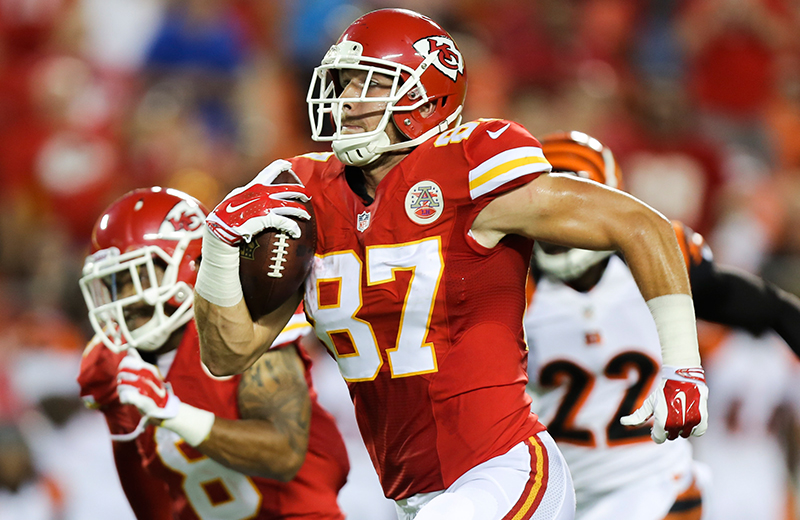
But, assuming you read the title to this post, you know that today we want to focus not on Gronk, but on baby Gronk. Kansas City’s Travis Kelce is second among tight ends in yards per route run, with a 2.49 average over 218 snaps. Those are incredible numbers, and a reflection that Kelce is already one of the top playmaking tight ends in football.

The Chiefs star hase has 542 yards on 52 targets, and his 10.4 yards/target average is the best among all tight ends.  But remember, Y/T is not a good stat: Cumberland ranked 3rd last season in yards per target, with a 10.2 average. Cumberland’s issue was that he wasn’t targeted very much despite being on the field.  As a result, his yards/target average overstated his value. Let’s throw some math into this equation: in 2013, Gronkowski was targeted on 30% of his routes, the best rate among all tight ends; Cumberland was targeted on 16% of his routes, the 35th best rate among tight ends.

Kelce isn’t the best receiving tight end in football because he leads with a 10.4 yards/target average.  It’s not just about what you do per target, it’s how often you get targeted. As he did last year, Gronk leads all tight ends in targets per route run, as he has been targeted on 28% of his pass routes.  But Kelce ranks 4th — and just a hair behind Jimmy Graham for 3rd place [2]Jordan Reed is second. — in targets per route run! He’s not having a fluky season at all, or at least, not in the way Cumberland did. The Chiefs are throwing to Kelce very often when he’s running routes, which is a very good sign that he’s the real deal.

So why is Kelce “only” 6th in receiving yards among tight ends? Because he’s just 28th in pass routes run by tight ends this year. And that’s the real conundrum: he simply isn’t getting much playing time. For the 2013 Jets, Cumberland was on the field for more offensive plays than any Jets player other than the quarterback and offensive linemen. Kelce simply doesn’t get the same level of playing time, as he ranks 4th among non-OL/QBs for Chiefs offensive players in snaps.

The other problem for him is that Kansas City ranks just 31st in pass attempts this year, which is going to depress his raw totals. But the good news is his playing time is on the rise — he was on the field for 63 of 67 snaps in week 12 and 50/52 in week 11. He can’t do anything about how often the Chiefs pass, but in his case — unlike Cumberland’s — the organization seems to be buying into the numbers. Kelce’s been dominant on a per-route basis this year, and now, Kansas City keeps giving him more playing time. The next big question is whether he can maintain his level of production as a full time starter, but the hunch here is that he can. And hey, maybe we just identified the first undervalued fantasy player of 2015.

References

References
1 In his defense, Cumberland was tied for 11th in yards per route run, but that’s (1) still a far cry from #2 and (2) more a reflection of the weakness of the 2013 Jets supporting cast.
2 Jordan Reed is second.
{ 4 comments }

Johnson's target ratio is no joking matter

Johnson's target ratio is no joking matter.

Yards per Route Run, a metric tabulated by Pro Football Focus, is one of my favorite statistics to use to examine wide receiver performance.  To me, it’s the wide receiver version of yards per pass, as it takes production and divides that by opportunity.  However, there are some folks who prefer Yards per Target to YPRR, under the idea that a target is a better way to define an opportunity than a route.

Which view is correct?  Fortunately for our analysis, Yards per Route Run can be broken down into two metrics: Yards per Target and Targets per Route Run.  In other words, YPRR already incorporates Yards per Target, but it adjusts that statistic for Targets Per Route Run.  This makes it very easy for us to compare the two statistics: essentially, the question boils down to how valuable it is to know a receiver’s number of Targets per Route Run.

For example, Kenny Stills had the most extreme breakdown of any player in the NFL in 2013. He was off-the-charts good in yards per target (13.9), but saw targets on just 9% of his routes run last year. As a result, Stills averaged just 1.29 yards per route run, a pretty unimpressive figure.

Steve Johnson was the anti-Stills. While Johnson had the worst year of his career since becoming a Bills starter, he still managed to pull down targets on 25% of his snaps. However, he averaged only 6.3 yards target, leaving Johnson with a poor 1.56 yards per route run average. Of course, when comparing Stills’ numbers to Johnson’s, one might note that Johnson was playing with EJ Manuel and Thaddeus Lewis while Stills was playing with Drew Brees, which provides some explanation for the drastic differences between the two receivers in yards per target. [1]I suppose one counter to that would be that Stills was competing with Jimmy Graham, Marques Colston, and the Saints obsession with throwing passes to running backs, while Johnson was competing with … Continue reading But putting the quarterbacks issue aside, the question today is a more global one.

Since the only difference between YPRR and Y/T is the metric “targets per route run,” it’s worth asking: is Targets Per Route Run a metric worth looking at? Is it more useful than Yards per Target? Well, the word “useful” will mean different things to different people. What I’m curious about is the stickiness of each metric. And there is a pretty clear answer to that question.

Among the three metrics — YPRR, Y/T, and TPRR — it’s Targets Per Route Run that’s the most consistent from year to year. From 2007 to 2012, there were 344 wide receivers who saw at least 40 targets in Year N, and then played for the same team and saw at least 40 targets in Year N+1. [2]While there are some issues with survivorship bias here, I’m not sure (1) how to get around them, and (2) that those concerns bias the results in a way that’s more biased towards one of … Continue reading [continue reading…]

References

References
1 I suppose one counter to that would be that Stills was competing with Jimmy Graham, Marques Colston, and the Saints obsession with throwing passes to running backs, while Johnson was competing with Scott Chandler, Robert Woods, and Fred Jackson for targets.
2 While there are some issues with survivorship bias here, I’m not sure (1) how to get around them, and (2) that those concerns bias the results in a way that’s more biased towards one of the variables we’re examining than the others.
{ 26 comments }

Gordon smoked the defensive back on this play

Gordon smoked the defensive back on this play.

Josh Gordon led the league with 1,646 receiving yards last year. That’s impressive: perhaps even more impressive is that he did it on “only” 159 targets, meaning he averaged 10.35 yards per target. [1]That’s the most of any receiver with over 130 targets. It’s the second most among players with 100 targets, behind DeSean Jackson‘s 10.6 average on 126 targets. It’s the … Continue reading But the most impressive part, of course, was that he did it for the Browns. You know, the Browns, quarterbacked by a three-headed monster of Jason Campbell, Brandon Weeden, and Brian Hoyer, each of whom managed to average a around the same mediocre 6.4 yards per attempt.

Here’s another way to think of it. While Jordan Cameron was somewhat efficient (7.7 yards per target), the other three Browns to finish in the top five in Cleveland targets were Greg Little (4.7 yards per target), Chris Ogbonnaya (4.6), and Davone Bess (4.2!). And here’s yet another way to think of it: the Browns threw 681 passes last year and gained 4,372 passing yards. But 1,646 of those yards came on the 159 passes intended for Gordon. Remove those plays, and Cleveland averaged just 5.22 yards per pass attempt on passes to all other Browns last year.

That means Cleveland averaged 5.13 more yards per target on passes to Gordon in 2013 than on passes to everyone else. That’s insane, particularly over 159 targets. How insane? If we multiply those two numbers, we get a “value relative to teammates” metric: Gordon gained 816 more yards on his targets than the other Browns averaged per target. Now, in the abstract, maybe 816 doesn’t mean much to you. But it’s the most of any player since at least 1999. The table below shows the top 75 wide receivers in value relative to teammates: the columns should be self-explanatory, and the “ROT Y/A” shows the yards per attempt on passes to the rest of the team. As always, it’s fully sortable and searchable; by default, it displays only the top 25 receivers, but you can switch that by clicking on the dropdown box to the left. [continue reading…]

References

References
1 That’s the most of any receiver with over 130 targets. It’s the second most among players with 100 targets, behind DeSean Jackson‘s 10.6 average on 126 targets. It’s the third most among players with more than 60 targets, behind Jackson and Doug Baldwin (10.7, 73). And it’s the fourth most among players with at least 40 targets, behind Jackson, Baldwin, and Kenny Stills (12.8, 50).
{ 5 comments }

You probably didn’t know it, but Cam Newton is having a down year, at least statistically.

Year GS Cmp Att Cmp% Yds TD TD% Int Int% Y/A AY/A Y/C Y/G Sk Yds NY/A ANY/A Sk%
2011 16 310 517 60.0 4051 21 4.1 17 3.3 7.8 7.2 13.1 253.2 35 260 6.87 6.24 6.3
2012 16 280 485 57.7 3869 19 3.9 12 2.5 8.0 7.6 13.8 241.8 36 244 6.96 6.65 6.9
2013 11 208 337 61.7 2353 17 5.0 9 2.7 7.0 6.8 11.3 213.9 31 235 5.76 5.58 8.4

Carolina’s defense has been outstanding, of course, so an 8-3 record and a seven-game winning streak have overshadowed any flaws in Newton’s game. The Panthers have held an average lead of 5.05 points per second this year, the third best rate in the league. As a result of that high Game Script, Newton is asked to do less on offense, but that doesn’t explain the declining efficiency numbers. Newton’s taking slightly more sacks and his rushing numbers are down across the board, but the biggest decline comes with respect to yards per completion.
[continue reading…]

{ 16 comments }

The predictive value of target data, part II

On Monday, I argued that target data has some predictive value. I wanted to update that post with a few observations.

Wide Receiver Targets

In the original post, I looked at year-to-year data for all players with at least 500 receiving yards in Year N and at least 8 games played for the same team in Years N and N+1. But it makes more sense to limit the sample to only wide receivers if we want to predict how wide receivers project in the next season.

There are 554 pairs of wide receiver seasons that meet the above criteria. [1]I have again pro-rated all seasons to sixteen games. The best fit formula to project future receptions based on prior receptions and prior targets is:

Year N+1 Receptions = 14.0 + 0.547 * Yr_N_Rec + 0.124 * Yr_N_Tar

The R^2 is 0.39, and while the receptions variable is statistically significant by any measure, the targets variable just barely qualifies (p = 0.044) as such. Still, this tells us that for every 8 additional targets a receiver sees in Year N, we can expect one more reception in Year N+1, holding his number of receptions equal.

If we want to project receiving yards instead of receptions, we get:

Year N+1 Receiving Yards = 180.3 + 0.434 * Yr_N_RecYd + 2.55 * Yr_N_Tar

The R^2 is 0.33, implying a slightly less strong relationships, which makes sense: yards are more variable to large outliers than receptions, so you would expect receiving yards to be slightly harder to predict. Another interesting note: the targets variable here is statistically significant at the p = 0.0003 level, and as expected, the receiving yards variable is statistically significant at all levels. Holding receiving yards equal, a receiver would need an additional 19 targets to increase his projected number of receiving yards by 50, so the practical effect may not be all that large.

Addressing the multicollinearity problem
[continue reading…]

References

References
1 I have again pro-rated all seasons to sixteen games.
{ 2 comments }

Analyzing the leaders in targets in 2012

Reggie Wayne led the NFL in targets last year, but that’s a little misleading since the Colts ranked 6th in pass attempts. As a percentage of team targets, Wayne ranked second in the league, but he was a distant number two to Brandon Marshall, who saw two out of every five Bears passes in 2013.

But that doesn’t make him the best receiver. It was easier for Marshall to receive a high number of targets because the rest of the Chicago supporting cast was weak, so Jay Cutler consistently looked Marshall’s way. Chicago ranked 25th last year in Adjusted Net Yards per Attempt, so essentially we have a player on a bad passing offense receiving a ton of targets. It’s not all that obvious how you compare a player like that to Roddy White, who deserves credit for being in a great passing offense but loses targets because of the presence of Julio Jones and Tony Gonzalez (of course, without them, would Matt Ryan start looking like Jay Cutler?)

I identified the leader in targets for each team, and then calculated the percentage of team targets each leading receiver had in 2012. The table below lists that percentage on the Y-Axis; the X-Axis represents the number of ANY/A that player’s team averaged. Someone like Marshall (represented by the first four letters of his last name and the first two letters of his first name, MarsBr) will therefore be high and to the left, while Randall Cobb is low and to the right:

2012 targets
[continue reading…]

{ 16 comments }

The predictive value of target data

Demaryius Thomas made the most of his targets in 2012.

Demaryius Thomas made the most of his targets in 2012.

In 2007, Doug Drinen and I wrote a pair of articles discussing our views on targets. I’m working on a wide receiver project this off-season, and a complete discussion of receiving statistics includes a discussion of targets.

Let me start with the prevailing few: targets are important, and if two receivers have the same production on a different number of targets, the one who produced on fewer targets is better/more valuable. Similarly, if all else is equal, the receiver with a higher catch rate — calculated as catches/target — is the better/more valuable one.

There are some problems with the prevailing view. By placing targets in the denominator of a formula, we’re implying that targets are a bad thing, or at a minimum, an opportunity wasted. But targets aren’t like pass attempts. Pro Football Focus has a stat called yards per pass route run, and that actually is the receiver version of yards per pass attempt. [1]Unfortunately, yards per pass route run is not going to help us if we want to grade receivers on a historical basis.

But targets don’t help identify the player who deserves blame: on a random incomplete pass, assume three receivers are running routes, and one of them is targeted. Absent a drop, I have a hard time saying that of the three wide receivers, the targeted one did the worst of the three. If we grade a receiver by his yards per route run, each receiver is equally penalized with one route run on the play; if we grade a receiver by yards per target, the two wide receivers that did not get open are not penalized, while the one that was targeted is penalized. That seems fundamentally wrong to me.

Here’s another problem: In a broad sense, the player with more targets (or percentage of his team’s targets) is in a very real sense a bigger part of his team’s offense. Either he’s open more often, or the quarterback is throwing in his direction even when he’s not open (whether because the coaches call more plays for him or because he’s earned the quarterback’s trust). In any event, the target itself is an indicator of quality, and penalizing a player — which is what you do when you place targets in the denominator — for an event that is highly correlated with quality is not something I’m comfortable doing.
[continue reading…]

References

References
1 Unfortunately, yards per pass route run is not going to help us if we want to grade receivers on a historical basis.
{ 12 comments }

Trivia: Single-season Leaders in Yards per Target

San Diego’s Danario Alexander caught 37 passes for 658 yards and 7 touchdowns in 10 games last year. Those might not look like great numbers, but when Philip Rivers looked his way, Alexander tended to produce. Alexander only saw 62 targets last season, but led the league with a 10.6 yards-per-target average (minimum 50 targets). Since 2000, there have been 21 receivers to average at least 11 yards per target on 50 targets.

RankPlayerYearTmAgeGTarRecYdsY/TR/T
1200813.956.1%
2200613.859.3%
3Jordy Nelson2011GNB26169668126313.270.8%
4Mike Wallace2010PIT24169960125712.760.6%
5Malcom Floyd2011SDG3012704385612.261.4%
6Antonio Gates2010SDG301065507821276.9%
7Dennis Northcutt2002CLE2513503959111.878%
8Torry Holt2000STL241614082164311.758.6%
9Victor Cruz2011NYG251613283154511.762.9%
10James Jones2011GNB2716553863511.569.1%
11Plaxico Burress2004PIT2711613569811.457.4%
12Robert Meachem2009NOR2516644572611.370.3%
13Anthony Gonzalez2007IND2313513757611.372.5%
14Lee Evans2004BUF2316754884311.264%
15Randy Moss2000MIN231612978143811.160.5%
16Steve Smith2008CAR291412978143211.160.5%
17Santana Moss2005WAS261613484148511.162.7%
18DeSean Jackson2010PHI2414964710601149%
19Santonio Holmes2007PIT231386539421161.6%
20Greg Jennings2007GNB241384539201163.1%
21Joe Horn2006NOR341062386791161.3%

I’ve blanked out the first two rows, because the same player has recorded the two highest yards/target seasons over the last thirteen years. Can you guess who it is?
[continue reading…]

{ 10 comments }