≡ Menu

Twenty years ago, in the summer of 2002, Doug Drinen wrote this about Running Back By Committee:

Any way you want to look at it, the use of RBBC has been decreasing for about three decades. In 2000, RBBC was at an all-time (since 1970) low. In 2001, it was back up slightly, but was still lower than it has ever been.

Drinen labeled a running back by committee (RBBC) if the team’s top running back scored less than half of the team’s total fantasy points by running backs. How do things look over the last 20 years? [1]In my effort re-create Drinen’s study, I am defining fantasy points as (receptions / 2) + (rushing yards + receiving yards) / 10 + (rushing TDs + receiving TDs ) * 6. [continue reading…]

References

References
1 In my effort re-create Drinen’s study, I am defining fantasy points as (receptions / 2) + (rushing yards + receiving yards) / 10 + (rushing TDs + receiving TDs ) * 6.
{ 16 comments }

The Best Fantasy Triplets Since 1970

The controls behind the top engine in fantasy football history

Troy Aikman, Emmitt Smith, and Michael Irvin will always be remembered as the triplets that took the NFL by storm in the early 1990s. But the best fantasy triplets ever? That honor belongs to the 1982 Chargers.

That year, shortened to 9 games by the strike, saw some of the best fantasy production ever. Wide receiver Wes Chandler had 1,032 yards and 9 touchdowns despite missing one game; he had arguably the most dominant fantasy season since 1970 by any wide receiver. Quarterback Dan Fouts averaged 320 passing yards per game, an NFL record that stood until 2011; he was the top fantasy quarterback that season. San Diego had a bit of a shared running back situation, as backup James Brooks was the 25th-most valuable fantasy RB that year, but starter Chuck Muncie was the 4th best fantasy runner. If you want to look at the best fantasy quartets, the 1982 Chargers stand out even farther from the pack. That year, tight end Kellen Winslow had one of the most dominant seasons in fantasy history, and was easily the top fantasy TE in the NFL.

So the 1982 Chargers had the best QB, best WR, and best TE, and the 4th-best RB. Can any other team come close to matching that? The 1993 and 1994 49ers come very close, with Ricky Watters, Jerry Rice, Steve Young, and Brent Jones. Both years, Young and Rice were the top fantasy players at their positions; in ’93, Watters was the #2 RB and Jones the #5 TE; in ’94, Watters was the #5 RB and Jones the #3 TE. Last year’s Chiefs nearly matched what the ’82 Chargers did: Patrick Mahomes was the top fantasy QB, Tyreek Hill the top fantasy WR, and Travis Kelce the top fantasy TE. RB Kareem Hunt was a top-5 fantasy RB through 12 weeks, when the Chiefs released him.

But my vote for the best fantasy triplets goes to the Chargers. I found the VBD score for the top QB, RB, and WR for every team since 1970, and then calculated the geometric mean of those three scores. The table below shows the top 200 seasons by this metric. Here’s how to read the table below. The top trio was the Chargers group from 1982. That year, Fouts had 130.2 points of VBD, Muncie had 116.8 points of VBD, and Chandler had 218.4 points of VBD. Fouts was the top QB in 1982, Muncie was the #4 RB, and Chandler the number one wide receiver. The geometric mean of the three VBD scores was 149.2, the best ever. [continue reading…]

{ 0 comments }

Over the last week, I’ve looked at the best fantasy players since 1970. Here are those links:

QB single-season
QB career
RB single-season
RB career
WR single-season
WR career
TE single-season

We conclude this series with a look at the top fantasy TEs, by career VBD, since 1970.

RkTight EndFirst YrLast YrVBD
1Tony Gonzalez199720131059
2Shannon Sharpe19902003802
3Antonio Gates20032018691
4Kellen Winslow19791987652
5Rob Gronkowski20102018564
6Todd Christensen19791988552
7Jason Witten20032017471
8Ben Coates19912000463
9Ozzie Newsome19781990447
10Dave Casper19741984433
11Keith Jackson19881996432
12Jimmy Graham20102018415
13Wesley Walls19892003342
14Travis Kelce20132018305
15Rich Caster19701982284
16Mark Bavaro19851994279
17Riley Odoms19721983275
18Bob Tucker19701980269
19Brent Jones19871997256
20Mickey Shuler19781991251
21Steve Jordan19821994250
22Eric Green19901999244
23Jay Novacek19851995238
24Jeremy Shockey20022011237
25Ted Kwalick19691977235
26Frank Wycheck19932003230
27Raymond Chester19701981230
28Todd Heap20012012215
29Zach Ertz20132018207
30Dallas Clark20032013194
31Charle Young19731985191
32Paul Coffman19781988190
33Greg Olsen20072018176
34Henry Childs19741984171
35Doug Cosbie19791988169
36Vernon Davis20062018167
37Charlie Sanders19681977158
38Dan Ross19791986155
39Alge Crumpler20012010155
40Chris Cooley20042012154
41Delanie Walker20062018151
42Jimmie Giles19771989150
43Rodney Holman19821995149
44Walter White19751979148
45Jim Mitchell19691979141
46Kellen Winslow20042013136
47Freddie Jones19972004133
48Rickey Dudley19962004128
49Jerome Barkum19721983127
50Johnny Mitchell19921996122
51Russ Francis19751988113
52Billy Joe DuPree19731983112
53Jerry Smith19651977108
54Jackie Harris19902001107
55Marv Cook19891995105
56Joe Senser1980198499
57Bob Trumpy1968197798
58George Kittle2017201897
59Dave Parks1964197395
60Julius Thomas2011201794
61Marcus Pollard1995200890
62Jackie Smith1963197886
63Jean Fugett1972197985
64Mark Chmura1993199983
65Pete Metzelaars1982199782
66Jordan Reed2013201876
67Eric Ebron2014201875
68Randy McMichael2002201274
69Owen Daniels2006201573
70Pete Holohan1981199269
71Gary Barnidge2008201669
72Aaron Hernandez2010201267
73Heath Miller2005201567
74Emery Moorehead1977198864
75Derrick Ramsey1978198763
76Tyler Eifert2013201862
77Robert Awalt1987199360
78Mike Barber1976198558
79Evan Engram2017201855
80Chad Lewis1997200554
81Kyle Rudolph2011201852
82Ethan Horton1985199451
83Calvin Magee1985198850
84David Hill1976198750
85Kyle Brady1995200750
86Jay Riemersma1997200450
87Don Hasselbeck1977198548
88Tony McGee1993200347
89Ken Dilger1995200446
90Martellus Bennett2008201746
91John Spagnola1979198945
92Cam Cleeland1998200545
93Bubba Franks2000200845
94Jermaine Wiggins2000200645
95Brent Celek2007201744
96Jared Cook2009201844
97Willie Frazier1964197542
98Jordan Cameron2011201642
99Eric Johnson2001200740
100Keith Krepfle1975198240

Please leave your thoughts in the comments.

{ 0 comments }

Over the last week, I’ve looked at the best fantasy players since 1970. Here are those links:

QB single-season
QB career
RB single-season
RB career
WR single-season
WR career

Today, we use the same methodology to analyze the top TE seasons in fantasy history (or, at least, since 1970). Todd Christensen has the best season by a fantasy tight end catching 92 passes for 1,247 yards with 12 TDs at a time when many tight ends were doing nothing. Cincinnati’s Dan Ross was the 12th-ranked TE in adjusted fantasy points (he ranked 10th overall and played in 16 games) and he had a 42-483-3 stat line. Suffice it to say, having Christensen on your team was like a cheat code: other than a rookie Eric Dickerson, the Raiders TE was the most valuable player in fantasy football in 1983.

The other names in the top five — Christensen has the 5th best season, too — are much less surprising: Kellen Winslow, Rob Gronkowski, and Tony Gonzalez.

The table below shows the 200 most dominant seasons by a tight end in fantasy football since 1970. [continue reading…]

{ 0 comments }

Over the last week, I’ve looked at the best fantasy players since 1970. Here are those links:

QB single-season
QB career
RB single-season
RB career
WR single-season

Today, the WR career list. It will come as no surprise that Jerry Rice is, by far, the greatest fantasy football wide receiver. His dominance is unmatched. After him comes three contemporaries in Randy Moss, Terrell Owens, and Marvin Harrison. You might be surprised to see Steve Largent come in at #5, who had 7 different seasons where he was a top-5 fantasy wide receiver. [continue reading…]

{ 0 comments }

On Saturday, I looked at the top fantasy seasons by running backs since 1970. On Tuesday, I looked at the top fantasy seasons by quarterbacks, and today, we will do that for wide receivers. I am using the same scoring system throughout this series: 1 point per 20 yards passing, 1 point per 10 yards rushing/receiving, 5 points per passing TD, -2 points for each interception, 6 points per rushing/receiving TD, 0.5 points per reception.

In 1995, Jerry Rice had one of the best seasons in NFL history. He caught 122 passes for 1,848 yards and 15 touchdowns, and also rushed for 36 yards and a touchdown. That translates to 352.5 fantasy points.  Meanwhile WR30 had 148.7 adjusted fantasy points (using the same system described in the running backs article).  That translates to 203.8 fantasy points of VBD.  That’s probably the best fantasy season by any wide receiver, with perhaps one exception.

In 1982, during the 9-game strike-shortened season, Wes Chandler of the Chargers caught 49 passes for 1,032 yards and 9 TDs, and also rushed for 32 yards. That translates to 184.9 fantasy points, a remarkable amount given that he just played in 8 games. WR36 in 1982 averaged 6.5 fantasy points per game, which means over a full 9-game season Chandler would be worth 191.4 fantasy points. That year, WR30 had 68.5 fantasy points, giving Chandler 122.9 points of VBD. If we pro-rate that to a 16-game season, that is worth 218.4 points of VBD. [continue reading…]

{ 0 comments }

Peyton Manning is the best quarterback in fantasy football history. That much is not open to debate. What separates Manning is not just his remarkable longevity, or his remarkable peak, but sustained level of very, very good play.

Here were Manning’s yearly fantasy ranks:

1998-9
1999-3
2000-3
2001-5
2002-4
2003-2
2004-2
2005-3
2006-1
2007-3
2008-6
2009-5
2010-3
2011-dnp
2012-4
2013-1
2014-3
2015-34

That’s a whopping 10 top-3 seasons, and 14 top-5 seasons, marks that will be difficult for any quarterback to ever match. Drew Brees and Tom Brady each have 7 top-3 seasons, while Aaron Rodgers has 6; Brees has 9 top-5 seasons, while Brady and Rodgers are at 7 and 6, respectively. That’s right: Peyton Manning has more top-5 fantasy seasons than Brady and Rodgers have combined.

The graph below shows each of the four superstar fantasy quarterbacks of our era shown in their primary team colors. This shows their VBD score by year — and remember, a player gets 0 VBD points if he was not a top-12 player in adjusted fantasy points (as described in yesterday’s post). [continue reading…]

{ 0 comments }

The best fantasy QB ever

On Saturday, I looked at the top fantasy seasons by a running back since 1970. Today, let’s look at quarterbacks.

As a reminder, I am using the following scoring system throughout this series: 1 point per 20 yards passing, 1 point per 10 yards rushing/receiving, 5 points per passing TD, -2 points for each interception, 6 points per rushing/receiving TD, 0.5 points per reception. Let’s use Dan Marino 1984 as an example. That season, Marino threw for 5,084 yards and 48 TDs, while throwing 17 interceptions. He finished with no rushing touchdowns and -7 rushing yards, for a total of 459.5 fantasy points.

Now, Peyton Manning in 2013 threw for 5,477 yards, with 55 TDs and just 10 interceptions. Like Marino, he wasn’t doing much on the ground, with -31 rushing yards and 1 TD. That’s a total of 531.8 fantasy points, which remains the most fantasy points any single player has every produced in a season of fantasy football.

But in 2013, Manning was probably not even the most valuable player in fantasy football that season, even if he scored the most points of any player ever. That’s because in fantasy football, your value is based on how you perform relative to your peers, the bedrock of VBD, which measures a player’s value relative to the worst starter. When calculating VBD scores, in this series, I used the 12th-ranked quarterback, 24th-ranked running back, 30th-ranked wide receiver, and 12th-ranked tight end. This assumes that the average league starts 1 QB, 2 RBs, 2.5 WRs, and 1 TE.

In 2013, the 12th-ranked QB (after adjusting for games played) had 339.8 fantasy points, so Manning finished with 192.0 points of VBD.  In 1984, the 12th-ranked quarterback had 252.2 fantasy points.  Therefore, Marino had 207.3 points of VBD, making it a more valuable season than Manning.

The table below shows the top 200 fantasy seasons by a quarterback since 1970.  For a full description of the methodology, including how VBD incorporates missed games and non-16 game NFL seasons, click here. [continue reading…]

{ 0 comments }

Yesterday, I wrote that in 2006, LaDainian Tomlinson had the best fantasy season any running back has ever had. He produced a record 282.4 points of VBD that year, but Tomlinson was no one year wonder. In 2003, he had 245.8 points of VBD, the 6th-best season by any running back since 1970. He had 186.6 points of VBD in 2005 and 183.6 points in 2007, and was a top-3 fantasy running back every year from 2002 to 2007. Take a look at his career:

That number at the bottom right — 1,487.3 — shows how many career points of VBD Tomlinson produced. That’s the most of any running back since the merger, slightly edging out Marshall Faulk and Emmitt Smith. Those three overlapped from ’01 to ’04, and in some ways the fantasy torch was passed from Smith (#1 fantasy RB from ’92 to ’95) to Faulk (#1 from ’99 to ’01) to Tomlinson (top-3 each year from ’02 to ’07).

The graph below shows the VBD each player had from ’90 to ’01:

Of course, if we really want to compare those three, let’s do it by age. This chart is pretty interesting, because the three stand out in different ways: [continue reading…]

{ 1 comment }
The fantasy GOAT

The fantasy GOAT

As I have done before, over the next few days, I want to look at the top fantasy players throughout history.

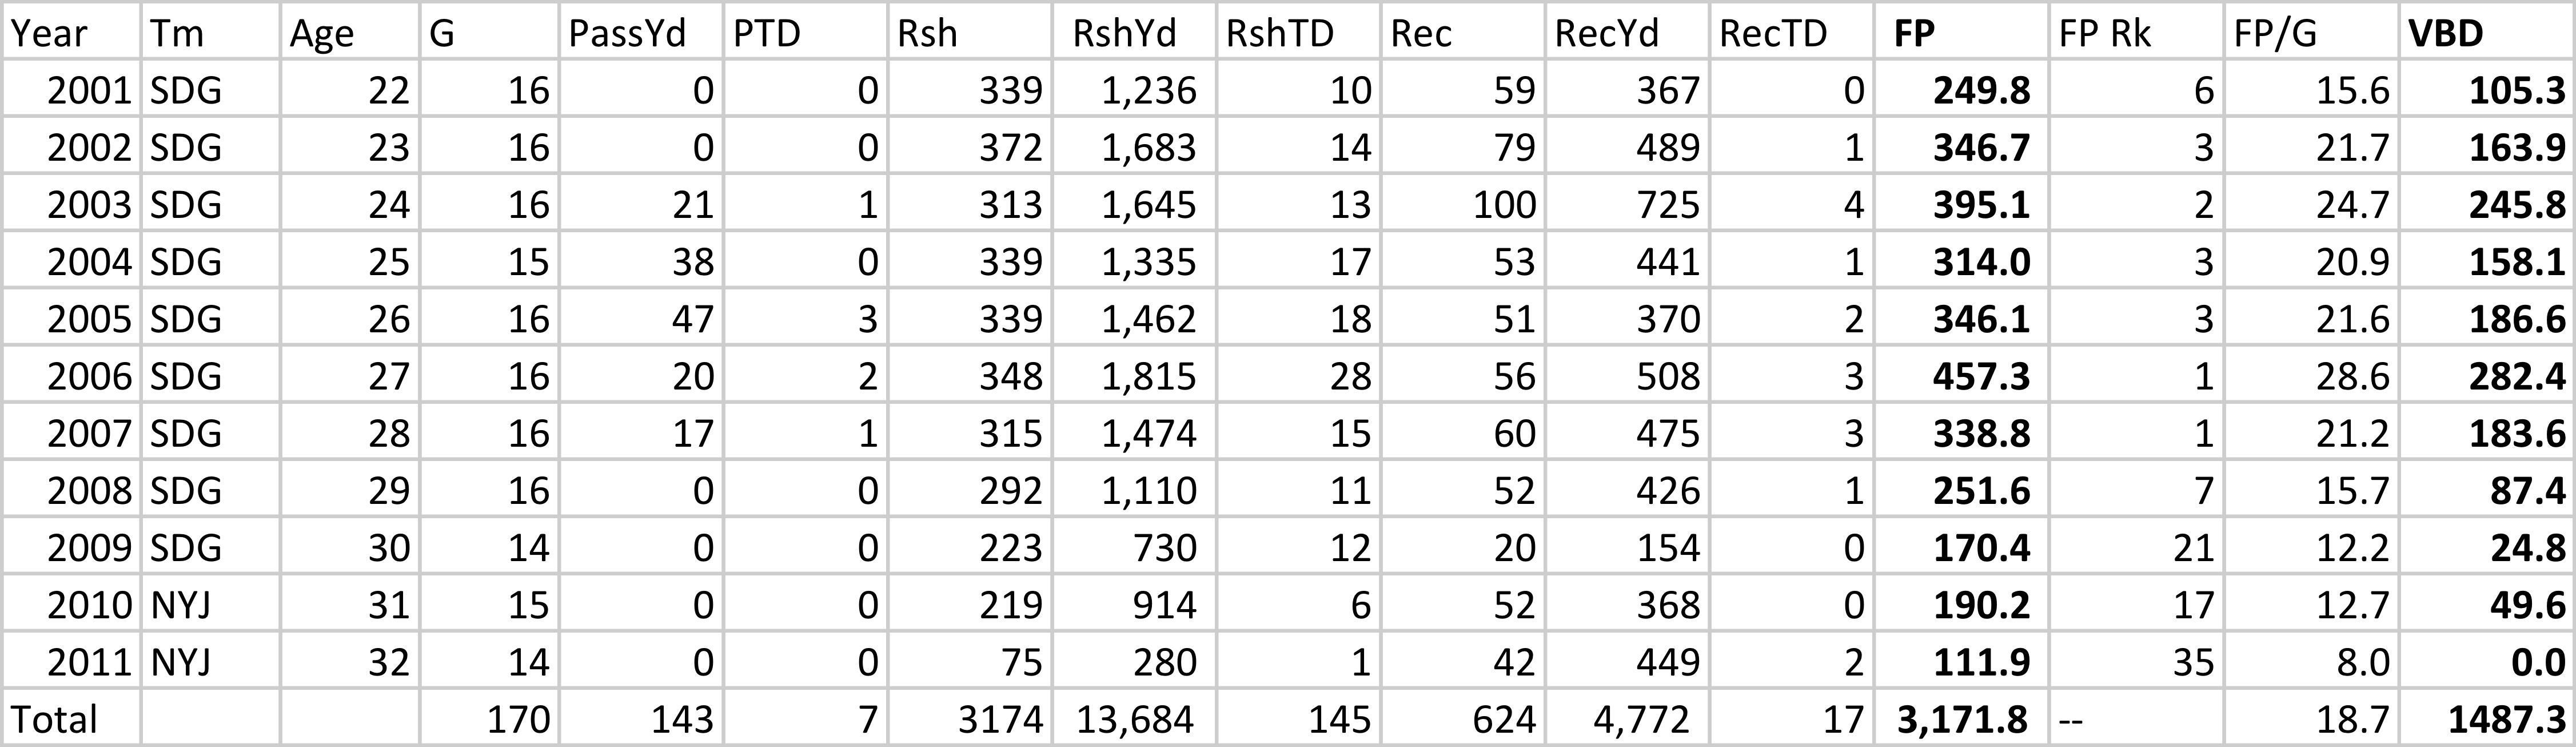
I will be using the following scoring system throughout this series: 1 point per 20 yards passing, 1 point per 10 yards rushing/receiving, 5 points per passing TD, -2 points for each interception, 6 points per rushing/receiving TD, 0.5 points per reception. Let’s use LaDainian Tomlinson in 2006 as an example. That year, he rushed for 1,815 yards and 28, caught 56 passes for 508 yards and 3 touchdowns, and even threw for 20 yards and 2 touchdowns.

That means Tomlinson scored 457.3 fantasy points that year. How valuable is that? In fantasy football, using principles of VBD, a player’s value is determined based on how much better he was than the worst starter. When calculating VBD scores, in this series, I used the 12th-ranked quarterback, 24th-ranked running back, 30th-ranked wide receiver, and 12th-ranked tight end. This assumes that the average league starts 1 QB, 2 RBs, 2.5 WRs, and 1 TE.

In 2006, the 24th-ranked running back scored 174.9 fantasy points. Therefore, the traditional methodology would say that Tomlinson produced 282.4 points of VBD in 2006, which is the most of any season since 1970. That is the standard, straightforward way to analyze fantasy production. However, that baseline is probably a bit low because some of the top 24 RBs missed games. Assuming a league where everyone plays two starting running backs, that makes RB30 the backup. So I then sorted all players by fantasy points per game, and added the FP/G from the 30th-best RB in that metric to each player’s fantasy total. Doing this raises the RB24 baseline to 190.2 fantasy points. That means Tomlinson would have 267.1 points of VBD, rather than 282.4.

There are two other adjustments I am making in this series, although neither impact Tomlinson’s 2006 season.

Let’s look at the second-most famous season that O.J. Simpson had in Buffalo. In 1975, Simpson rushed for 1,817 yards and 16 touchdowns, but what made it a historic season was that he also caught 28 passes for 426 yards and 7 touchdowns. That gave him 376.3 fantasy points, while the RB24 that year had just 130.9 fantasy points. However, using adjusted fantasy points, RB24 that year had 134.5 fantasy points. Therefore, Simpson had 241.8 points of VBD that season, but remember: in 1975, the league’s season lasted just 14 games. Therefore, for all non-16 game seasons, I multiplied each player’s VBD by 16 and divided that result by the number of team games that year. Therefore, Simpson gets an era-adjusted VBD score of 276.3, just a hair ahead of Tomlinson’s 2006 campaign. So by this methodology, it’s actually Simpson’s 1975 season that is the best in running back history.

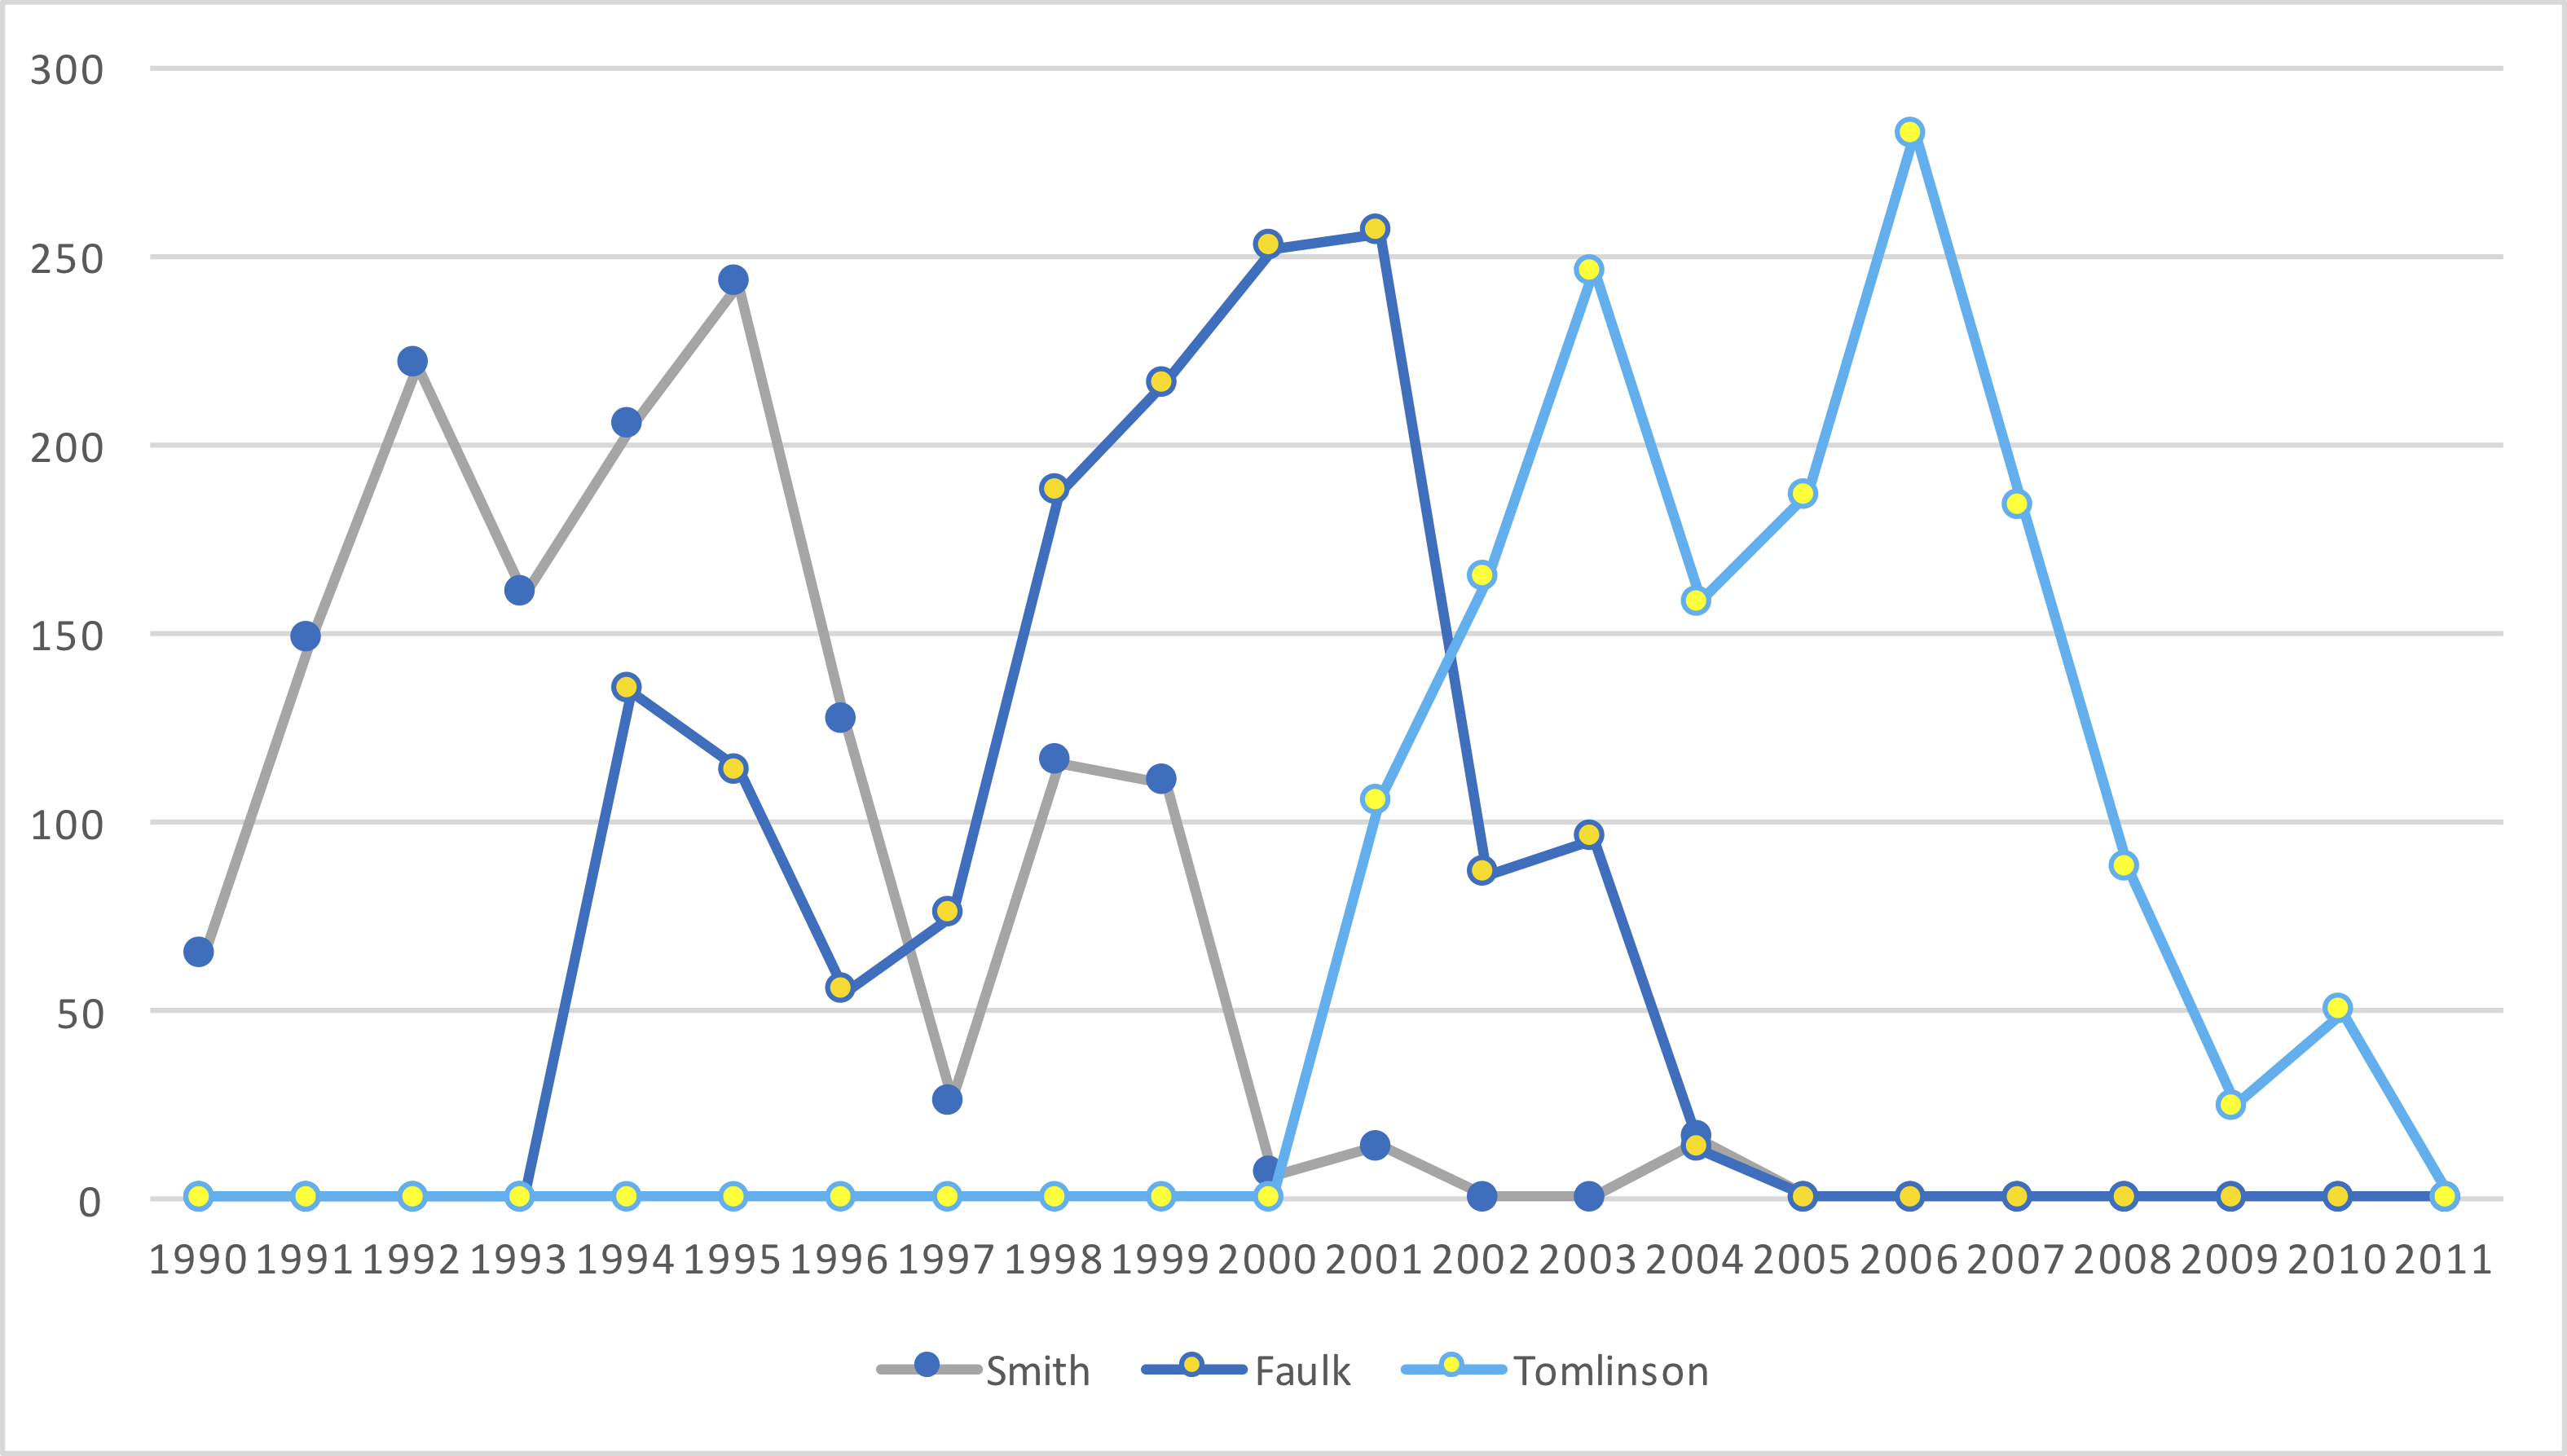
Finally, let’s look at what Marshall Faulk did in 2001. The Rams legend had 1,382 rushing yards and 12 rushing touchdowns, while catching 83 passes for 765 yards and 9 TDs. That means Faulk scored 382.2 fantasy points. However, Faulk missed two games that season due to injury. It’s better to score 382.2 fantasy points in 14 games than in 16 games, because from a fantasy perspective, you can play someone else in those two games and get more points. If you owned Marshall Faulk in fantasy that year, you would have played your backup RB those two weeks, and that’s worth something. It would have really been worth something if you played Marshall Faulk’s backup Trung Canidate, who gained 358 yards and scored 3 touchdowns those two weeks. But for these purposes, I took the average FP/G for the average backup — after sorting by FP/G, the results for QB18, RB30, WR36, and TE18 — and added that to each player’s VBD score. For Faulk, this raises his fantasy points total from 382.2 to 400.2, because the average backup running back that year produced 9 points per game. Since RB24 (on an adjusted basis) that year had 170.3 fantasy points, this means Faulk gets 229.9 points of VBD [continue reading…]

{ 0 comments }

2017 Fantasy Rankings: Team Defense

This week at Football Perspective: an analysis of the 2017 fantasy results. For team defenses, I used the following formula:

  • Fumble recoveries and interceptions are each worth +3.
  • Sacks are worth +1.
  • Safeties are worth +5.
  • Defensive/Special Teams TDs are worth +6.

For points allowed and yards allowed, I used the following:

Points Allowed 0-0 15
Points Allowed 1-7 10
Points Allowed 8-14 5
Points Allowed 15-21 1
Points Allowed 31-99 -5

Yards Allowed 0-199 15
Yards Allowed 200-299 7
Yards Allowed 300-499 0
Yards Allowed 500-999 -5

Below are the fantasy rankings for team defenses in 2017. Note that these results exclude week 17, so the per-game numbers are over 15 games. [continue reading…]

{ 0 comments }

2017 Fantasy Rankings: Tight Ends

Gronk was the top TE of 2017.

This week at Football Perspective: an analysis of the 2017 fantasy results. I will be using the same methodology throughout this series.

  • To calculate fantasy points, I will be using the following system: 1 point per 20 yards passing, 5 points per passing TD, -2 points per INT, 1 point per 10 yards rushing/receiving, 6 points per rushing/receiving touchdown, and 0.5 points per reception.
  • To measure fantasy production, I will be using VBD, which stands for Value Based Drafting. For players who play a full 16-game schedule, the formula is easy: you begin with each player’s fantasy points, and then subtract from that number the baseline at that position. For QBs and TEs, the baseline is the player with the 12th most fantasy points at the position. For RBs, it’s RB24, and for WRs, the baseline is WR30. For players who missed time, I give them some credit for those missed games under the assumption that a fantasy player would put another player into their lineup if that player was out. So for every game a QB/TE misses, he gets the FP/G of QB18 or TE18, as applicable; for RBs, I used RB30 as replacement, and for WRs, I used WR36. If a player missed more than 10 games, he was excluded entirely, but if he played in at least 6 games, he was included.
  • For players who finish below the baseline (i.e., would have negative VBD), I’m ranking them based on fantasy points per game. I’m not too concerned by this, and if you have another preference, that’s perfectly fine. I thought it would simply be the easiest way to present the data.

Below are the fantasy rankings for tight ends in 2017. [continue reading…]

{ 1 comment }

2017 Fantasy Rankings: Wide Receivers

Brown was the top wide receiver of 2017.

This week at Football Perspective: an analysis of the 2017 fantasy results. I will be using the same methodology throughout this series.

  • To calculate fantasy points, I will be using the following system: 1 point per 20 yards passing, 5 points per passing TD, -2 points per INT, 1 point per 10 yards rushing/receiving, 6 points per rushing/receiving touchdown, and 0.5 points per reception.
  • To measure fantasy production, I will be using VBD, which stands for Value Based Drafting. For players who play a full 16-game schedule, the formula is easy: you begin with each player’s fantasy points, and then subtract from that number the baseline at that position. For QBs and TEs, the baseline is the player with the 12th most fantasy points at the position. For RBs, it’s RB24, and for WRs, the baseline is WR30. For players who missed time, I give them some credit for those missed games under the assumption that a fantasy player would put another player into their lineup if that player was out. So for every game a QB/TE misses, he gets the FP/G of QB18 or TE18, as applicable; for RBs, I used RB30 as replacement, and for WRs, I used WR36. If a player missed more than 10 games, he was excluded entirely, but if he played in at least 6 games, he was included.
  • For players who finish below the baseline (i.e., would have negative VBD), I’m ranking them based on fantasy points per game. I’m not too concerned by this, and if you have another preference, that’s perfectly fine. I thought it would simply be the easiest way to present the data.

Below are the fantasy rankings for wide receivers in 2017. [continue reading…]

{ 0 comments }

2017 Fantasy Rankings: Running Backs

Kamara was the surprise star at running back in 2017.

This week at Football Perspective: an analysis of the 2017 fantasy results. I will be using the same methodology throughout this series.

  • To calculate fantasy points, I will be using the following system: 1 point per 20 yards passing, 5 points per passing TD, -2 points per INT, 1 point per 10 yards rushing/receiving, 6 points per rushing/receiving touchdown, and 0.5 points per reception.
  • To measure fantasy production, I will be using VBD, which stands for Value Based Drafting. For players who play a full 16-game schedule, the formula is easy: you begin with each player’s fantasy points, and then subtract from that number the baseline at that position. For QBs and TEs, the baseline is the player with the 12th most fantasy points at the position. For RBs, it’s RB24, and for WRs, the baseline is WR30. For players who missed time, I give them some credit for those missed games under the assumption that a fantasy player would put another player into their lineup if that player was out. So for every game a QB/TE misses, he gets the FP/G of QB18 or TE18, as applicable; for RBs, I used RB30 as replacement, and for WRs, I used WR36. If a player missed more than 10 games, he was excluded entirely, but if he played in at least 6 games, he was included.
  • For players who finish below the baseline (i.e., would have negative VBD), I’m ranking them based on fantasy points per game. I’m not too concerned by this, and if you have another preference, that’s perfectly fine. I thought it would simply be the easiest way to present the data.

Below are the fantasy rankings for running backs in 2017. [continue reading…]

{ 4 comments }

2017 Fantasy Rankings: Quarterbacks

Wilson was #1 in 2017.

This week at Football Perspective: an analysis of the 2017 fantasy results. I will be using the same methodology throughout this series.

  • To calculate fantasy points, I will be using the following system: 1 point per 20 yards passing, 5 points per passing TD, -2 points per INT, 1 point per 10 yards rushing/receiving, 6 points per rushing/receiving touchdown, and 0.5 points per reception.
  • To measure fantasy production, I will be using VBD, which stands for Value Based Drafting. For players who play a full 16-game schedule, the formula is easy: you begin with each player’s fantasy points, and then subtract from that number the baseline at that position. For QBs and TEs, the baseline is the player with the 12th most fantasy points at the position. For RBs, it’s RB24, and for WRs, the baseline is WR30. For players who missed time, I give them some credit for those missed games under the assumption that a fantasy player would put another player into their lineup if that player was out. So for every game a QB/TE misses, he gets the FP/G of QB18 or TE18, as applicable; for RBs, I used RB30 as replacement, and for WRs, I used WR36. If a player missed more than 10 games, he was excluded entirely, but if he played in at least 6 games, he was included.
  • For players who finish below the baseline (i.e., would have negative VBD), I’m ranking them based on fantasy points per game. I’m not too concerned by this, and if you have another preference, that’s perfectly fine. I thought it would simply be the easiest way to present the data.

Below are the fantasy rankings for quarterbacks in 2017. [continue reading…]

{ 3 comments }

I saw an interesting tweet yesterday:

My first thought was, “No way!” But then again, the leading RB in receiving touchdowns is a pretty obscure category, so who knows. Well, it turns out McDowell is correct (at least back to 1970, which is as far as I checked; before 1970 you are dealing with much smaller leagues, anyway).

So yes, Todd Gurley really does have a running back quadruple crown: he leads all running backs in rushing yards (1,305; Kareem Hunt is second with 1,292); rushing TDs (13; Mark Ingram is second with 12); receiving yards (Alvin Kamara has 742) and receiving TDs (6; Kamara and Christian McCaffrey each have 5).  That is not going to hold up, as Gurley will rest this weekend as the Rams have clinched the NFC West but can not get the 1 or the 2 seed in the NFC.  But for now, it is pretty remarkable, if from nothing else than from a trivia perspective.

In fact, since 1970, only two running backs — Jamaal Charles in 2010 and Arian Foster in 2013 — have led all running backs in three out of those four carries. Charles ranked 3rd in rushing yards that year, Foster ranked 7th in this receiving TDs.

The table below shows all running backs since 1970 whose average rank in these four categories was 5.0 or lower. [continue reading…]

{ 1 comment }

Before you can get good at projecting fantasy points, you need to understand how fantasy points are scored.  And there’s probably no better place to start than in the passing game.

I used the following scoring system to determine passing fantasy points: 1 point per 25 yards passing (this is gross passing, so if you look at team passing data, you need to add back in sack yards), 4 points per touchdown pass, and -1 point per interception.  That’s it.

The average team in 2015 scored 16.1 fantasy points per game; to make life a bit more intuitive, I am going to convert fantasy point numbers into a plus/minus average number. So the Patriots passing attack, which scored 329.5 fantasy points in 16 games, and averaged 20.6 FP/G, gets credited as +4.5. That was the best average in football. On defense, the Patriots were slightly better than average, at +0.3 points per game (here, positive is good for defense; if you forget, just check the Saints line). Using New Orleans as an example, the Saints get a +4.2 offensive grade (ranked 2nd) and a -6.5 defensive grade (32nd). I put all 32 teams into the table below with their respective offensive and defensive grades and ranks: [continue reading…]

{ 5 comments }

Footballguys.com – Why Subscribe?

Regular readers know that I’m one of the writers at Footballguys.com. If you are a hardcore fantasy footballer (or daily fantasy sports player), you probably already know that Footballguys.com is the single best source for fantasy football information. If you are a more casual fantasy football player, you’ll find that the tools available at Footballguys will make life much, much easier for you to win your league(s). Either way, I think a Footballguys Insider PRO subscription is a fantastic value for $32.95. Also fantastic values: the Footballguys Draft Dominator for mobile devices, which costs $4.99.

I don’t make extra money if more people sign up for Footballguys or buy an app, but I hope my readers subscribe because I think a subscription is a really good deal. If you play fantasy football and want to win your competitive league or save hours doing research for your local league, a Footballguys subscription is well worth it. For $32.95, you get: [continue reading…]

{ 1 comment }

An alternate uniform for the greatest tight end ever

An alternate uniform for the greatest tight end ever

Over the last three days, we’ve looked at the most dominant fantasy quarterbacks, running backs, and wide receivers. Today, we look at tight ends, using the methodology described over the three previous days.

I am using the following scoring system throughout this series: 1 point per 20 yards passing, 1 point per 10 yards rushing/receiving, 4 points per passing TD, 6 points per rushing/receiving TD, 0.5 points per reception.

You probably expect to see Rob Gronkowski’s 2011 season grade as the best fantasy season by any tight end. But, as it turns out, an AFC West tight end had one season that was ever so slightly more dominant.

You might think I’m talking about Tony Gonzalez, who has an unreal eleven seasons in the top 200. Or Kellen Winslow, who has eight top-200 seasons, half of which rank in the top 25. And if not one of those two, then surely Antonio Gates, who has nine top-200 seasons, including two in the top twenty. Or Shannon Sharpe, of course, who also has nine top-200 seasons, with six of those being in the top 70.

In fact, AFC West teams [1]And we don’t even need to include Seattle, which has 0 entries in the top 200 have 14 of the top 25 seasons by a tight end in fantasy history, and and 19 of the top 35 years. No division has dominated this position like the AFC West, but the best tight end season in fantasy history came from someone else: Oakland’s Todd Christensen. [continue reading…]

References

References
1 And we don’t even need to include Seattle, which has 0 entries in the top 200
{ 8 comments }

The GOAT

The GOAT

On Wednesday, we looked at the most dominant quarterbacks in fantasy history. Yesterday, we did the same for running backs. Today, we look at wide receivers, using the methodology described over the two previous days.

I am using the following scoring system throughout this series: 1 point per 20 yards passing, 1 point per 10 yards rushing/receiving, 4 points per passing TD, 6 points per rushing/receiving TD, 0.5 points per reception.

There are four seasons that have topped 200 points of VBD in wide receiver history: Elroy Hirsch, 1951; Wes Chandler, 1982; and Jerry Rice, 1987 and 1995. In ’95, Rice set the still-standing record with 351.5 fantasy points, courtesy of 122 catches, 1,848 receiving yards, and 15 touchdowns (he also rushed for 36 yards and a touchdown). Rice averaged 21.97 FP/G that year, while the baseline of WR32 was 9.15 FP/G. Therefore, Rice was 12.82 FP/G above the baseline for 16 games, which comes out to 205.1 points of VBD. [continue reading…]

{ 19 comments }

The fantasy GOAT

The fantasy GOAT

Yesterday, we looked at the most dominant quarterbacks in fantasy history. Today, the running backs, using the methodology described yesterday. Let’s look at the three best seasons in fantasy history, since all shed light on the formula here. Those three are LaDainian Tomlinson, 2006, which is easy to argue as the best year ever as Tomlinson shattered the record for fantasy points scored. But O.J. Simpson in 1975 (not ’73) was also dominant, and did so in a 14-game season and when the baseline was lower. The darkhorse candidate is Priest Holmes, 2002, who put up insane numbers but missed two games due to injury.

I am using the following scoring system throughout this series: 1 point per 20 yards passing, 1 point per 10 yards rushing/receiving, 4 points per passing TD, 6 points per rushing/receiving TD, 0.5 points per reception.

In 2006, Tomlinson rushed for 1,815 yards with 28 TDs, caught 56 passes for 508 yards and 3 touchdowns, and even threw for 20 yards and two touchdowns. He totaled a still mind-boggling 455.3 fantasy points. On a per game basis, Tomlinson averaged 28.46 FP/G, while the baseline — which for these purposes is RB24 [1]Baselines used in this series: From 1968 to 2014, RB24. In ’66 and ’67, RB20, and from ’61 to ’65, RB16. In the 1960 AFL, the baseline is RB6, while it is RB8 in the NFL. From … Continue reading — was at 10.75 FP/G. Therefore, Tomlinson averaged 17.71 FP/G over the baseline, and he did it for 16 games, giving him a VBD of 283.3 fantasy points (17.71 x 16). [continue reading…]

References

References
1 Baselines used in this series: From 1968 to 2014, RB24. In ’66 and ’67, RB20, and from ’61 to ’65, RB16. In the 1960 AFL, the baseline is RB6, while it is RB8 in the NFL. From 1950 to 1959, the baseline used is RB8.
{ 27 comments }

What was the most dominant fantasy season of all time? You might think Peyton Manning 2013, but let me throw out another candidate: Steve Young, 1998.

I am using the following scoring system throughout this series: 1 point per 20 yards passing, 1 point per 10 yards rushing/receiving, 4 points per passing TD, 6 points per rushing/receiving TD, 0.5 points per reception.

In 2013, Manning threw for 5,477 yards and 55 TDs with just 10 interceptions, while rushing for -31 yards but with one TD. That comes out to 486.75 fantasy points. In 1998, Young threw for 4,170 yards with 36 TDs and 12 INTs, but also ran for 454 yards and 6 TDs. That is equal to 421.90 fantasy points. So, advantage Manning.

But we measure fantasy dominance “not by the number of points he scores[, but] by how much he outscores his peers at his particular position.” Those are the words of Joe Bryant in his famous VBD article, and I’ll make an appendix to that for historical purposes: the key is how much a player outscores his peers at his particular position in that particular year.

When calculating VBD scores, the standard is to use the 12th-ranked quarterback. In 2013, the 12th=-ranked QB scored 309.2 fantasy points, which means Manning outscored him by 177.55 fantasy points (or we could say that Manning produced 178 points of VBD). In 1998, the 12th-ranked quarterback scored just 235.6 fantasy points, which means Young finished with 186.3 points of VBD. So, advantage, Young.

But there’s another piece of the puzzle that tips the scales even more towards the 49ers quarterback. In 1998, Young missed one game. For fantasy purposes, it’s more valuable to have a quarterback produced X points in 15 games than it is for him to produce X points in 16 games, because you can play someone else during that 16th game. [continue reading…]

{ 29 comments }

Prompted by Le’Veon Bell’s remarkable stretch towards the end of last season, I took a look at the greatest four-game stretches by a fantasy running back over at Footballguys.com:

In the Steelers 11th game of the year, LeVeon Bell rushed for 204 yards and a touchdown.  In his next game, he totaled 254 yards from scrimmage against the Saints and ran for another score.  In Pittsburgh’s 13th game of the season, Bell scored three times against the Bengals while gaining 235 yards from scrimmage.  Finally, against the Falcons, Bell totaled 119 yards and ran for two touchdowns.

Over that four-game stretch, Bell scored seven touchdowns, gained 830 yards from scrimmage, and caught 21 passes.  If we use a scoring system that provides 0.5 points per reception and the standard 1 point for 10 yards rushing/receiving and 6 points for touchdowns. That translates to 135.5 fantasy points over such period, which is obviously an insane amount of points.  But how insane?  Only six other running backs since 1960 have had greater four-game stretches.  Let’s go to the list.

You can read the full article here. Suffice it to say, Bell is in some pretty rare company.

{ 0 comments }

Fantasy: New Extra Point Rule (FBG)

Over at Footballguys.com, I provided my thoughts on what the new PAT rule means for fantasy players.

What does that mean in practical terms? Instead of there being one missed extra point every 2-3 weeks, there will be about two missed extra points per week. For fantasy owners, that means you might wind up losing a point a couple of times during your regular season, but, of course, you are just as likely to benefit from your opponent missing out on that point, too. In general, kickers are often an afterthought in many fantasy leagues; this rule is not going to change that, although it will make the best kickers (and kickers who play in friendly conditions) imperceptibly more valuable than before.

You can read the full article here.

{ 0 comments }

FanDuel Lineups – Week 12, Thursday Night

Daily fantasy football is pretty sweet, and I’ve become very active in it this year. I’ve only played on FanDuel (affiliate link, here), so my analysis will be limited strictly to that site.

At FanDuel, you start 1 QB, 2 RBs, 3 WRs, 1 TE, 1 K, and 1 defense, with a salary cap of $60,000. The scoring system is pretty standard, with 0.5 points per reception being the most notable feature to keep in mind. There are generally two that I play: 50/50s, or what people refer to as cash games, where you say, pay $25 to enter a tournament of 50 people, and the top 25 people win $45. The house gets roughly the same cut of ~10% in most games, so the 50/50 is the low-variance play.

The other option is to play in tournaments, which can range from large, to very large, to absurdly large. Anyway, enough minutia. I have limited my play to 50/50s this week, although I did enter one tournament lineup which I’ll explain at the end. [continue reading…]

{ 0 comments }

FanDuel Lineups – Week 11, Thursday Night

Daily fantasy football is pretty sweet, and I’ve become very active in it this year. I’ve only played on FanDuel (affiliate link, here), so my analysis will be limited strictly to that site.

At FanDuel, you start 1 QB, 2 RBs, 3 WRs, 1 TE, 1 K, and 1 defense, with a salary cap of $60,000. The scoring system is pretty standard, with 0.5 points per reception being the most notable feature to keep in mind. There are generally two that I play: 50/50s, or what people refer to as cash games, where you say, pay $25 to enter a tournament of 50 people, and the top 25 people win $45. The house gets roughly the same cut of ~10% in most games, so the 50/50 is the low-variance play.

The other option is to play in tournaments, which can range from large, to very large, to absurdly large. Anyway, enough minutia. I have limited my play to 50/50s this week, although I did enter one tournament lineup which I’ll explain at the end. [continue reading…]

{ 1 comment }

Fantasy: Running Back Workload Part II (FBG)

Last week, I began my analysis of how to measure workload for running backs. Today brings Part II, another attempt to analyze workload and fantasy production.

Last year, Joique Bell finished as the 15th best running back in fantasy football. Prior to 2013, Bell had just 82 career carries, all of which came in 2012.  Meanwhile, Marshawn Lynch finished as RB5, but he had 1,452 carries prior to the 2013 season. Both players were 27 years old last year, but they had drastically different career workloads.

One obvious issue that comes up when comparing high-workload to low-workload players is that there is often a large talent gap, and Bell and Lynch present that quite clearly. Bell was an undrafted free agent out of Division II Wayne State, while Lynch was a first round pick who played in the Pac-10. What I’ll try to do today is control for “player ability” by looking at the player’s VBD in the prior season. For example, Lynch had 125 points of VBD in 2012, while Bell had 0.

From 1988 to 2013, there were 77 running backs who had a top-24 finish during their age 27 season. One thing we can look to see is whether these players “benefited” from having low mileage up to that point in their careers. I performed a regression analysis using three inputs — Carries in the player’s age 26 year (for example, 315 for Lynch), his career carries as of the end of his age 26 season (1,452 for Lynch), and his VBD in his age 26 season (125).  My output was VBD in the player’s age 27 year.  Here was the best-fit formula:

You can read the full article here. And if you have thoughts on how else to study this issue, leave them in the comments.

{ 1 comment }

Fantasy: Running Back Workload (FBG)

Over at Footballguys.com, I try to unravel the relationship between workload and age. Eight years ago, Doug wrote three articles on the topic; sadly, I’m not sure we’ve come very far since then. So I decided to at least begin the process of measuring how much of an impact “mileage” really has on running backs.

Conventional wisdom suggests that, all else being equal, running backs with “low mileage” are more likely to age gracefully than running backs who have accumulated a significant number of carries.

This, unfortunately, is a very complicated issue to test. For example, new Giants running back Rashad Jennings is 29 years old, but he has just 387 career carries.  This makes Jennings a “young” 29, but is that better than being an “old” 28? The best way to test this question is to analyze running backs of similar quality as Jennings — but who had a lot of carries by the time they were 28 years old — and see how the rest of their careers unfolded.  The problem is that the list of running backs with a lot of carries through their age 28 season bear no resemblance to Jennings. The players with the most carries through age 28 are Emmitt Smith, Edgerrin James, Jerome Bettis, Barry Sanders, LaDainian Tomlinson, Curtis Martin, and Walter Payton, which basically serves as a who’s who of running backs who are not comparable to Rashad Jennings.

Generally speaking, the best running backs get the most carries: did you know that Jim Brown is the only player to lead the NFL in carries more than 4 times? He did it six times in his nine-year career. Along the same line of thinking, the running backs with the most carries are generally among the best running backs.  Running backs who haven’t had a lot of carries through age 28 generally either aren’t very good or have suffered multiple injuries, which makes it tough to find players who feel like true comparables to a player like Jennings.

One could argue that running back workload and running back quality are so inextricably tied that it’s impossible to accurately measure whether age or workload is more important.  But today, I want to take a step back from examining the specifics of a player like Jennings and look at the big picture.  There are some examples that appear to support the “running back mileage” theory.  Shaun Alexander had a significant number of carries through age 28, and was excellent at age 28; the fact that he then declined so significantly, so quickly, could be a sign that workload really mattered. After all, few players suffer such sharp declines when turning 29. But that’s just one data point.  What if we can bring in many more?

You can read the full article here.

{ 4 comments }

Over at Footballguys.com, I looked at which running backs have produced the most extreme fantasy splits in wins and losses.

With few exceptions, running backs generally score more fantasy points in wins than in losses.  For example, Adrian Peterson has averaged 22.2 FP/G over the last four years in wins, and 14.8 FP/G in losses, in a 0.5 PPR scoring system.  Those numbers rank Peterson in the top four in both categories, but obviously he’s been much more valuable in wins.

Some players, however, have particularly extreme splits. As Jason Lisk points out, Alfred Morris is one of those players.  Since Morris isn’t much of a receiver, he gets his value from carries and touchdowns, and both of those tend to be higher in wins. Over the past two seasons, Morris has averaged 17.1 FP/G in wins and 11.1 FP/G in losses. Marshawn Lynch is another player who is more valuable in wins: fortunately for him, those are more prevalent in Washington state than Washington, D.C. Since 2010, Lynch has averaged 17.3 FP/G in wins and 9.7 FP/G in losses.

So which running backs are most impacted by their team’s fortunes? I looked at the top 50 running backs in Footballguys.com rankings, and then excluded rookies and others players with small sample sizes.  I was left with 37 running backs, and I calculated their FP/G (using 0.5 PPR) in wins and losses since 2010.  Here’s how to read the table below. No running back fared so much better in wins relative to losses as Doug Martin.  The Tampa Bay back has played in seven wins and averaged 24.5 FP/G in those games, the highest average among the 37 running backs in this study.  Martin has played in 15 losses, and averaged just 12.1 FP/G in those games, the 10th best ranking. That’s a difference of 12.4 (24.5 – 12.1) FP/G.

You can read the full article here.

{ 0 comments }

For the eleventh straight years, I’ve written an Quarterback By Committee article for Footballguys.com. Here’s a quick peak at this year’s article:

The general rule for QBBC fans is that the first six rounds of your draft should be used to assemble a wealth of talent at running back, wide receiver, and, if the draft unfolds in such a way, tight end. By going the QBBC route, you can save those high picks in your draft and still get solid fantasy production by grabbing two QBs who face bad defenses nearly every week of the year. That’s what the QBBC system is all about.

Of course, in some leagues, QB10 can now be had as late as the seventh round, and your fifth-ranked quarterback could still be available that late. One could argue that the best strategy is 2014 is to wait until the first ten quarterbacks are off the board and then draft a couple of quarterbacks at a nice discount. Colin Kaepernick, Tony Romo, and Russell Wilson have ADPs of QB11, QB12, and QB13, and all have high upside for 2014. That’s one option, but another option is to wait even longer and implement a quarterback-by-committee strategy.

The first key, of course, is to rank the defenses. I always start by adjusting last season’s data on defenses for strength of schedule. I started with the adjusted FP rankings for each defense listed in the Rearview QB article. Then, I made some adjustments to the defenses based on their efficiency numbers from 2013 and what’s happened since the end of last season. The table below lists my rating for defenses for fantasy quarterbacks, listed from the toughest (the Seahawks) to the easiest (Dallas).  Quarterbacks facing Seattle should expect to produce about five fantasy points below average, while passers facing the Cowboys will be projected to score three more points than average.

You can check out the full article here, which includes rankings of each defense and each quarterback’s strength of schedule.

{ 1 comment }
Previous Posts