
Before you can get good at projecting fantasy points, you need to understand how fantasy points are scored. And there’s probably no better place to start than in the passing game.
I used the following scoring system to determine passing fantasy points: 1 point per 25 yards passing (this is gross passing, so if you look at team passing data, you need to add back in sack yards), 4 points per touchdown pass, and -1 point per interception. That’s it.
The average team in 2015 scored 16.1 fantasy points per game; to make life a bit more intuitive, I am going to convert fantasy point numbers into a plus/minus average number. So the Patriots passing attack, which scored 329.5 fantasy points in 16 games, and averaged 20.6 FP/G, gets credited as +4.5. That was the best average in football. On defense, the Patriots were slightly better than average, at +0.3 points per game (here, positive is good for defense; if you forget, just check the Saints line). Using New Orleans as an example, the Saints get a +4.2 offensive grade (ranked 2nd) and a -6.5 defensive grade (32nd). I put all 32 teams into the table below with their respective offensive and defensive grades and ranks:
| Tm | OFF | Rk | DEF | Rk |
|---|---|---|---|---|
| NWE | 4.5 | 1 | 0.3 | 16 |
| NOR | 4.2 | 2 | -6.5 | 32 |
| ARI | 3.8 | 3 | 1.4 | 9 |
| NYG | 3.3 | 4 | -3.0 | 30 |
| SDG | 2.7 | 5 | 1.3 | 10 |
| JAX | 2.6 | 6 | -1.9 | 28 |
| DET | 2.4 | 7 | -0.3 | 18 |
| SEA | 2.1 | 8 | 4.4 | 1 |
| OAK | 1.9 | 9 | -0.2 | 17 |
| CAR | 1.7 | 10 | 2.2 | 6 |
| NYJ | 1.6 | 11 | 0.9 | 13 |
| WAS | 1.5 | 12 | -1.7 | 26 |
| CIN | 1.4 | 13 | 2.2 | 5 |
| PIT | 1.1 | 14 | -1.7 | 27 |
| GNB | 0.7 | 15 | 2.3 | 3 |
| HOU | 0.6 | 16 | 1.8 | 8 |
| MIA | -0.3 | 17 | -1.4 | 24 |
| ATL | -0.4 | 18 | 2.3 | 4 |
| PHI | -0.6 | 19 | -3.3 | 31 |
| IND | -1.0 | 20 | -1.0 | 22 |
| BAL | -1.0 | 21 | -0.9 | 21 |
| TEN | -1.2 | 22 | -1.6 | 25 |
| TAM | -1.4 | 23 | -1.1 | 23 |
| CLE | -1.5 | 24 | -2.1 | 29 |
| BUF | -1.9 | 25 | -0.6 | 19 |
| CHI | -2.0 | 26 | -0.7 | 20 |
| DEN | -2.2 | 27 | 3.4 | 2 |
| KAN | -2.8 | 28 | 1.2 | 11 |
| SFO | -3.7 | 29 | 0.5 | 15 |
| DAL | -4.3 | 30 | 2.2 | 7 |
| MIN | -5.0 | 31 | 0.8 | 14 |
| STL | -6.7 | 32 | 0.9 | 12 |
Here’s a “simple” way to explain fantasy points. If a good passing team faces a bad passing defense, a lot of fantasy points should be scored. Here’s what I did, and I’ll use the Rams offense against the Seahawks defense from week 1 as my example.
1) Calculate the offense’s passing fantasy points per game, relative to league average, in the other 15 games. Here, St. Louis gets a grade of -7.1, which means excluding the game in question, the Rams passing attack produced 7.1 fewer fantasy points than average.
2) Calculate the defense’s passing fantasy points per game allowed, relative to league average in the other 15 games. So the Seahawks pass defense gets a grade of +4.7, because Seattle’s pass defense was really good in those 15 games.
3) Do this for all 512 sets of matchups between a passing offense and a passing defense. Then, figure out the number of fantasy points actually scored. In week 1, St. Louis produced 15.9 passing fantasy points, or -0.2 relative to league average.
4) Run a regression using the results from steps 1 and 2 as inputs, and the actual fantasy results as my output.
The best fit equation tells us to take the offense’s average and multiply it by 0.653, and to take the defense’s average and multiply that by -0.446. Do that, and you will have the best-fit way to project the number of fantasy points scored (relative to league average) for the passing attack in that game. The Rams, using this methodology, were projected to score 6.8 passing fantasy points below average; this game was not picked at random; it had the lowest projection of any game this year, which of course makes perfect sense.
This is a pretty elegant, and rather basic, model. It also has a nice way on sticking to the 60/40 offense/defense split we’ve seen before (here, the offensive grade is responsible for 59.4% of the overall grade). The only problem? The R^2 is pretty low, at 0.30. That means this isn’t all that effective at actually predicting things.
Want a more visual explanation? In the graph below, I have plotted the results from each game this year. The X-Axis shows the expected passing fantasy points using the equation explained above; the Y-Axis displays the actual results.
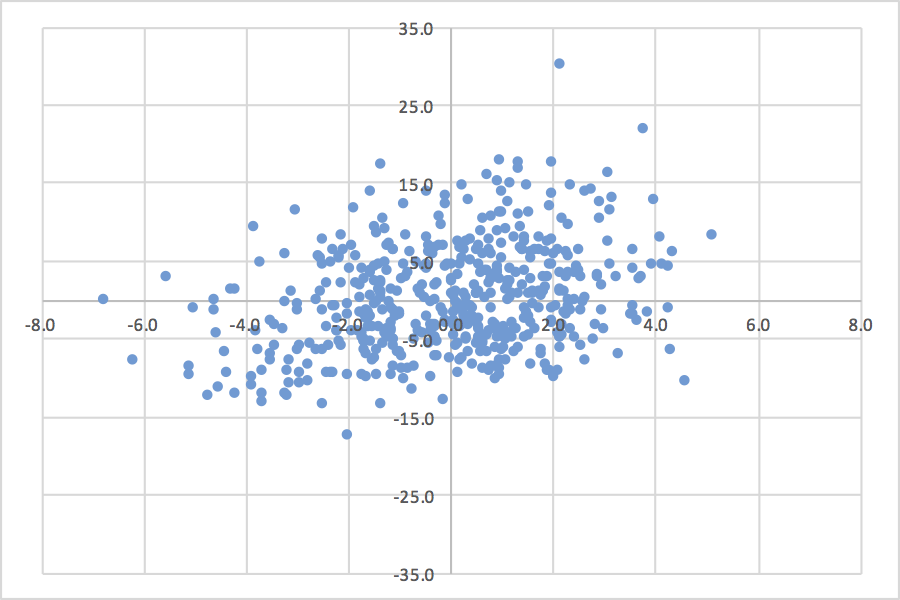
First: yes, the two dots at the top at (2.1, 30.1) and (3.8, 21.9) are the Saints and Giants passing offenses, respectively, in the team’s head-to-head matchup.
Anyway, if the quality of the passing offense and the quality of the passing defense was all that mattered, you’d see a graph that looks like a forward slash; instead, while there is obviously some correlation, the line is quite a bit flatter than you might think.
The goal today was to set a baseline of how a projection system should fare. Now we know what we need to beat.