by Chase Stuart
on August 14, 2019
Regular readers know that I got my start writing at Footballguys.com. If you are a hardcore fantasy football enthusiast, daily fantasy sports player, or just a casual fantasy football player you probably know by now that Footballguys is the single best source for fantasy football information. For those with limited time to devote to fantasy football research, you’ll find that the tools available at Footballguys will make life much, much easier for you to win your league(s). And the experts know that the projections and tools available at FBG is top notch. Either way, I think fantasy football players will find FBG to be a great value at any of the pricepoints currently offered ($39.95 for the Season Long Pro subscription, $49.95 for the Daily Fantasy Pro subscription or $69.95 for the All-Pro that includes both).
I don’t make any money if people sign up for Footballguys and I don’t have any promo code: I hope my readers subscribe because I think a lot of you play fantasy and a subscription is a really good deal. Here are a few reasons why: [continue reading…]
Tagged as:
Footballguys.com
{ }
by Chase Stuart
on August 22, 2015
Regular readers know that I’m one of the writers at Footballguys.com. If you are a hardcore fantasy footballer (or daily fantasy sports player), you probably already know that Footballguys.com is the single best source for fantasy football information. If you are a more casual fantasy football player, you’ll find that the tools available at Footballguys will make life much, much easier for you to win your league(s). Either way, I think a Footballguys Insider PRO subscription is a fantastic value for $32.95. Also fantastic values: the Footballguys Draft Dominator for mobile devices, which costs $4.99.
I don’t make extra money if more people sign up for Footballguys or buy an app, but I hope my readers subscribe because I think a subscription is a really good deal. If you play fantasy football and want to win your competitive league or save hours doing research for your local league, a Footballguys subscription is well worth it. For $32.95, you get: [continue reading…]
Tagged as:
Footballguys.com
{ }
by Chase Stuart
on June 13, 2015
Prompted by Le’Veon Bell’s remarkable stretch towards the end of last season, I took a look at the greatest four-game stretches by a fantasy running back over at Footballguys.com:
In the Steelers 11th game of the year, LeVeon Bell rushed for 204 yards and a touchdown. In his next game, he totaled 254 yards from scrimmage against the Saints and ran for another score. In Pittsburgh’s 13th game of the season, Bell scored three times against the Bengals while gaining 235 yards from scrimmage. Finally, against the Falcons, Bell totaled 119 yards and ran for two touchdowns.
Over that four-game stretch, Bell scored seven touchdowns, gained 830 yards from scrimmage, and caught 21 passes. If we use a scoring system that provides 0.5 points per reception and the standard 1 point for 10 yards rushing/receiving and 6 points for touchdowns. That translates to 135.5 fantasy points over such period, which is obviously an insane amount of points. But how insane? Only six other running backs since 1960 have had greater four-game stretches. Let’s go to the list.
You can read the full article here. Suffice it to say, Bell is in some pretty rare company.
Tagged as:
Footballguys.com
{ }
by Chase Stuart
on August 8, 2014
Regular readers know that I’m one of the writers at Footballguys.com. I think regular readers know that I’m not a very good salesman, either. But if you are a hardcore fantasy footballer, you probably already know that Footballguys.com is the single best source for fantasy football information. If you are a more casual fantasy football player, you’ll find that the tools available at Footballguys will make life much, much easier for you to win your league(s). Either way, I think a Footballguys.com subscription is a fantastic value for $29.95. Also fantastic values: the Footballguys Draft Dominator for mobile devices, which costs $4.99.
I don’t make extra money if more people sign up for Footballguys or buy an app, but I hope my readers subscribe because I think a subscription is a really good deal. If you play fantasy football and want to win your competitive league or save hours doing research for your local league, a Footballguys subscription is well worth it. For $29.95, you get:
- Always up to date and informed projections and rankings, along with 50,000 + pages of Footballguys Insider content.
- The Footballguys Draft Dominator (the single most valuable tool in all of fantasy football, IMO), along with the Lineup Dominator and Projections Dominator. Even if you don’t sign up for Footballguys, you can play around with Doug Drinen’s ultra-cool Rate My Team application for free.
- The Footballguys Insiders contest, giving you a chance at over $35,000 in prizes — this is 100% free to subscribers.
- During the season, My FBG is a fantastic customizable tool that makes roster management incredibly easy. If you’re in multiple fantasy leagues, this is a lifesaver, and can be fully integrated with certain league management systems.
- I won’t list every reason to sign up, but you can check out the Why Subscribe? link or just play around on the FBG homepage.
- In addition to everything else, a money-back guarantee. In the 11 years I’ve been at Footballguys, they’ve always offered this feature, and it’s almost never used. There’s a reason for that.
Anyway, I’m not very good at the salesman thing, so I’ll wrap things up.
Tagged as:
Footballguys.com
{ }
by Chase Stuart
on July 19, 2014
Last week, I began my analysis of how to measure workload for running backs. Today brings Part II, another attempt to analyze workload and fantasy production.
Last year, Joique Bell finished as the 15th best running back in fantasy football. Prior to 2013, Bell had just 82 career carries, all of which came in 2012. Meanwhile, Marshawn Lynch finished as RB5, but he had 1,452 carries prior to the 2013 season. Both players were 27 years old last year, but they had drastically different career workloads.
One obvious issue that comes up when comparing high-workload to low-workload players is that there is often a large talent gap, and Bell and Lynch present that quite clearly. Bell was an undrafted free agent out of Division II Wayne State, while Lynch was a first round pick who played in the Pac-10. What I’ll try to do today is control for “player ability” by looking at the player’s VBD in the prior season. For example, Lynch had 125 points of VBD in 2012, while Bell had 0.
From 1988 to 2013, there were 77 running backs who had a top-24 finish during their age 27 season. One thing we can look to see is whether these players “benefited” from having low mileage up to that point in their careers. I performed a regression analysis using three inputs — Carries in the player’s age 26 year (for example, 315 for Lynch), his career carries as of the end of his age 26 season (1,452 for Lynch), and his VBD in his age 26 season (125). My output was VBD in the player’s age 27 year. Here was the best-fit formula:
You can read the full article here. And if you have thoughts on how else to study this issue, leave them in the comments.
Tagged as:
Footballguys.com
{ }
by Chase Stuart
on July 13, 2014
Over at Footballguys.com, I try to unravel the relationship between workload and age. Eight years ago, Doug wrote three articles on the topic; sadly, I’m not sure we’ve come very far since then. So I decided to at least begin the process of measuring how much of an impact “mileage” really has on running backs.
Conventional wisdom suggests that, all else being equal, running backs with “low mileage” are more likely to age gracefully than running backs who have accumulated a significant number of carries.
This, unfortunately, is a very complicated issue to test. For example, new Giants running back Rashad Jennings is 29 years old, but he has just 387 career carries. This makes Jennings a “young” 29, but is that better than being an “old” 28? The best way to test this question is to analyze running backs of similar quality as Jennings — but who had a lot of carries by the time they were 28 years old — and see how the rest of their careers unfolded. The problem is that the list of running backs with a lot of carries through their age 28 season bear no resemblance to Jennings. The players with the most carries through age 28 are Emmitt Smith, Edgerrin James, Jerome Bettis, Barry Sanders, LaDainian Tomlinson, Curtis Martin, and Walter Payton, which basically serves as a who’s who of running backs who are not comparable to Rashad Jennings.
Generally speaking, the best running backs get the most carries: did you know that Jim Brown is the only player to lead the NFL in carries more than 4 times? He did it six times in his nine-year career. Along the same line of thinking, the running backs with the most carries are generally among the best running backs. Running backs who haven’t had a lot of carries through age 28 generally either aren’t very good or have suffered multiple injuries, which makes it tough to find players who feel like true comparables to a player like Jennings.
One could argue that running back workload and running back quality are so inextricably tied that it’s impossible to accurately measure whether age or workload is more important. But today, I want to take a step back from examining the specifics of a player like Jennings and look at the big picture. There are some examples that appear to support the “running back mileage” theory. Shaun Alexander had a significant number of carries through age 28, and was excellent at age 28; the fact that he then declined so significantly, so quickly, could be a sign that workload really mattered. After all, few players suffer such sharp declines when turning 29. But that’s just one data point. What if we can bring in many more?
You can read the full article here.
Tagged as:
Footballguys.com
{ }
by Chase Stuart
on July 12, 2014
Over at Footballguys.com, I looked at which running backs have produced the most extreme fantasy splits in wins and losses.
With few exceptions, running backs generally score more fantasy points in wins than in losses. For example, Adrian Peterson has averaged 22.2 FP/G over the last four years in wins, and 14.8 FP/G in losses, in a 0.5 PPR scoring system. Those numbers rank Peterson in the top four in both categories, but obviously he’s been much more valuable in wins.
Some players, however, have particularly extreme splits. As Jason Lisk points out, Alfred Morris is one of those players. Since Morris isn’t much of a receiver, he gets his value from carries and touchdowns, and both of those tend to be higher in wins. Over the past two seasons, Morris has averaged 17.1 FP/G in wins and 11.1 FP/G in losses. Marshawn Lynch is another player who is more valuable in wins: fortunately for him, those are more prevalent in Washington state than Washington, D.C. Since 2010, Lynch has averaged 17.3 FP/G in wins and 9.7 FP/G in losses.
So which running backs are most impacted by their team’s fortunes? I looked at the top 50 running backs in Footballguys.com rankings, and then excluded rookies and others players with small sample sizes. I was left with 37 running backs, and I calculated their FP/G (using 0.5 PPR) in wins and losses since 2010. Here’s how to read the table below. No running back fared so much better in wins relative to losses as Doug Martin. The Tampa Bay back has played in seven wins and averaged 24.5 FP/G in those games, the highest average among the 37 running backs in this study. Martin has played in 15 losses, and averaged just 12.1 FP/G in those games, the 10th best ranking. That’s a difference of 12.4 (24.5 – 12.1) FP/G.
You can read the full article here.
Tagged as:
Footballguys.com
{ }
by Chase Stuart
on June 21, 2014
For the eleventh straight years, I’ve written an Quarterback By Committee article for Footballguys.com. Here’s a quick peak at this year’s article:
The general rule for QBBC fans is that the first six rounds of your draft should be used to assemble a wealth of talent at running back, wide receiver, and, if the draft unfolds in such a way, tight end. By going the QBBC route, you can save those high picks in your draft and still get solid fantasy production by grabbing two QBs who face bad defenses nearly every week of the year. That’s what the QBBC system is all about.
Of course, in some leagues, QB10 can now be had as late as the seventh round, and your fifth-ranked quarterback could still be available that late. One could argue that the best strategy is 2014 is to wait until the first ten quarterbacks are off the board and then draft a couple of quarterbacks at a nice discount. Colin Kaepernick, Tony Romo, and Russell Wilson have ADPs of QB11, QB12, and QB13, and all have high upside for 2014. That’s one option, but another option is to wait even longer and implement a quarterback-by-committee strategy.
The first key, of course, is to rank the defenses. I always start by adjusting last season’s data on defenses for strength of schedule. I started with the adjusted FP rankings for each defense listed in the Rearview QB article. Then, I made some adjustments to the defenses based on their efficiency numbers from 2013 and what’s happened since the end of last season. The table below lists my rating for defenses for fantasy quarterbacks, listed from the toughest (the Seahawks) to the easiest (Dallas). Quarterbacks facing Seattle should expect to produce about five fantasy points below average, while passers facing the Cowboys will be projected to score three more points than average.
You can check out the full article here, which includes rankings of each defense and each quarterback’s strength of schedule.
Tagged as:
Footballguys.com
{ }
by Chase Stuart
on June 7, 2014
Every year, I adjust quarterback statistics — both fantasy and traditional — for strength of schedule. Today, a look at my article at Footballguys.com where I adjust the 2013 numbers for each quarterback for the quality of the opposing defenses. On Monday, I’ll be doing the same for quarterbacks using Adjusted Net Yards per Attempt.
For the ninth straight season, I’m advising fantasy football owners about a good starting point for their quarterback projections/rankings. My Rearview QB article analyzes the production of every quarterback from the prior season after adjusting his performance for partial games played and strength of schedule. If you’re a first time reader, here’s my argument in a nutshell: using last year’s regular end-of-year data is the lazy man’s method. When analyzing a quarterback, many look at a passer’s total fantasy points or fantasy points per game average from the prior season and then tweak the numbers based on off-season changes and personal preferences. But a more accurate starting point for your projections is a normalized version of last year’s stats.
The first adjustment is to use adjusted games (and not total games), which provide a more precise picture of how often the quarterback played. Second, you should adjust for strength of schedule, because a quarterback who faced a really hard schedule should get a boost relative to those who played easy opponents most weeks.
To be clear, this should be merely the starting point for your quarterback projections. If you think a particular quarterback carries significant injury risk, or is going to face a hard schedule again, feel free to downgrade him after making these adjustments. (And it should go without saying that if you think a quarterback will improve or decline – or, in the case of Colin Kaepernick or Cam Newton his supporting case will improve or decline – you must factor that in as well.) But those are all subjective questions that everyone answers differently; this analysis is meant to be objective. The point isn’t to ignore whether a quarterback is injury prone or projects to have a really hard or easy schedule in 2014; the point is to delay that analysis.
First we see how the player performed on the field last year, controlling for strength of schedule and missed time; then you factor in whatever variables you like when projecting the 2014 season. The important thing to consider is that ignoring partial games and strength of schedule is a surefire way to misjudge a player’s actual ability level. There’s a big difference between a quarterback who produced 300 fantasy points against an easy schedule while playing every game than a quarterback with 300 FPs against the league’s toughest schedule while missing 3.6 games. Here’s another way to consider the same idea: Jay Cutler ranked 25th in fantasy points in 2013, but the quarterback position for the Bears (i.e., Cutler and Josh McCown) ranked as the 4th highest team QB last year.
You can read the full article here.
Tagged as:
Footballguys.com
{ }
by Chase Stuart
on May 31, 2014
Last year, I provided a starting point for my running back projections. The idea is pretty simple: some fantasy statistics are much more repeatable, or sticky, than others. Over at Footballguys.com, I used the following formula to help isolate those factors:
1) Rushing Yards (R^2 = 0.47). The best-fit formula to predict rushing yards is:
-731 + 3.73 * Rush Attempts + 180 * Yards/Rush
2) Receptions (R^2 = 0.42). The best-fit formula to predict receptions is:
11.1 + 0.39 * Receptions + 0.032 * Receiving Yards
3) Receiving Yards (R^2 = 0.38). The best-fit formula to predict receiving yards is:
83.7 + 1.65 * Receptions + 0.46 * Receiving Yards
4) Rushing Touchdowns (R^2 = 0.29). The best-fit formula to predict rushing touchdowns is:
0.1 + 0.0037 * Rushing Yards + 0.35 * Rushing Touchdowns
5) Receiving Touchdowns (R^2 = 0.23). The best-fit formula to predict receiving touchdowns is:
0.1 + 0.0022 * Receiving Yards + 0.25 * Receiving Touchdowns
Using these formulas, we can come up with a good starting point for your 2014 running back projections.
You can read the full article here.
Tagged as:
Footballguys.com
{ }
by Chase Stuart
on May 24, 2014
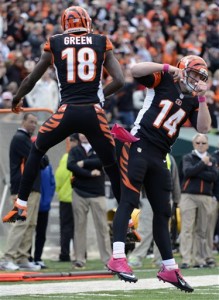
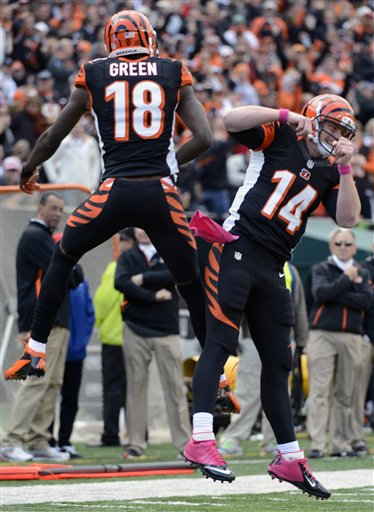
Green is poised for another monster year.
, at Footballguys.com, I looked at
the best starting point for wide receiver projections. Well, I’ve re-run the numbers and come up with
the best starting point for wide receiver projections in 2014.
The general philosophy is that receiving yards can be re-written using the following formula:
Receiving yards = (Receiving Yards/Target) x (Targets/Team_Pass_Att) x Team_Pass_Att.
Since each of those variables regress to the mean in different ways, we can get a more accurate projection of future receiving yards by projecting each of those three variables than by simply looking at past receiving yards. For example, here are the best fit formulas for each of those metrics:
Future Pass Attempts = 36 + (450 x Pass_Attempts/Play) + (0.255 x Offensive Plays)
Future Percentage of Targets = 6.2% + 71.3% x Past Percentage of Targets
Future Yards/Target = 5.5 + 0.29 x Past Yards/Targets
If you take a look at the three coefficients, the number of offensive plays run from year to year and the yards per target averages are not very sticky; both have coefficients of less than 0.3, which indicates a significant amount of regression to the mean. Meanwhile, percentage of targets is much, much sticker, at 71%.
As a result, this regression really likes players like A.J. Green (5th in receiving yards in 2013, projected to be 1st in 2014), Andre Johnson (7th, 2nd) and Vincent Jackson (14th, 6th). To find out who else this metric likes and dislikes, and for a more thorough analysis, you can read the full article here.
Tagged as:
Footballguys.com
{ }
by Chase Stuart
on August 16, 2013
Here’s the short sell: If you are a hardcore fantasy footballer, you probably already know that Footballguys.com is the single best source for fantasy football information. If you are a more casual fantasy football player, you’ll find that the tools available at Footballguys will make life much, much easier for you to win your league(s). Either way, I think a Footballguys.com subscription is a fantastic value for $29.95.
As for the longer sell: Before the New York Times, before Smart Football, and before Pro-Football-Reference, I was an aspiring young football writer with more energy than brains and more curiosity than experience. For reasons unbeknown to most everyone, Footballguys asked me in the summer of 2002 to join their staff. I’ve been a staff member ever since. At the time, Footballguys was the best kept secret in fantasy football; now it’s the best product in the industry. I continue to publish articles there, and you can find my 2013 articles at this link (the older articles are free, while the more recent ones are subscriber-only content).
I don’t make extra money if more people sign up for Footballguys, but I hope my readers subscribe because I think a subscription is a really good deal. If you play fantasy football and want to win your competitive league or save hours doing research for your local league, a Footballguys subscription is well worth it. For $29.95, you get:
- Always up to date and informed projections and rankings, along with 50,000 + pages of Footballguys Insider content.
- The Footballguys Draft Dominator (the single most valuable tool in all of fantasy football, IMO), along with the Lineup Dominator and Projections Dominator. Even if you don’t sign up for Footballguys, you can play around with Doug Drinen’s ultra-cool Rate My Team application for free.
- The Footballguys Insiders contest, giving you a chance at over $35,000 in prizes — this is 100% free to subscribers.
- During the season, My FBG is a fantastic customizable tool that makes roster management incredibly easy. If you’re in multiple fantasy leagues, this is a lifesaver, and can be fully integrated with certain league management systems.
- I won’t list every reason to sign up, but you can check out the Why Subscribe? link or just play around on the FBG homepage.
- In addition to everything else, a money-back guarantee. In the 11 years I’ve been at Footballguys, they’ve always offered this feature, and it’s almost never used. There’s a reason for that.
Anyway, I’m not very good at the salesman thing, so I’ll wrap things up. Bob Henry, a fellow staffer, puts together four incredible training camp updates during the pre-season. The first of these was released on August 7th, and is free, while the last three are subscriber-only content. Take a look at Bob’s first training camp report if you have any doubts about the quantity and quality of the content FBG provides.
Once you’re a subscriber, you can check out some of my recent articles, such as:
And for those waiting for more info on True Receiving Yards, check back tomorrow.
Tagged as:
Footballguys.com
{ }
by Chase Stuart
on August 1, 2013
If you don’t play fantasy football, you probably have no idea what this title means. Of course, it’s 2013, so if you don’t play fantasy football, you’re now the oddball. “PPR” stands for points per reception. About half of all fantasy leagues do not give any points for receptions, while the other half includes some sort of PPR format. And while the value of every player is dependent on each league’s scoring system, few players see their value fluctuate between scoring systems quite like Wes Welker. Or, at least, that’s how it seems. Is there a way to measure this effect?
First, a review of Welker’s numbers since he joined the Patriots:
Welker doesn’t get many touchdowns, and while he has respectable yardage totals, he is only exceptional when it comes to piling up receptions. Welker has 672 receptions over the last six seasons, easily the most in the NFL (in fact, it’s the most ever over any six-year stretch). Brandon Marshall (592) and Reggie Wayne (578) are the only two players even within 100 catches of Welker. Over that same time frame, he ranks 4th in receiving yards, but only tied for 17th in receiving touchdowns.
Giselle approves of Welker's form.
So how can we measure how much more valuable Welker is in PPR-leagues than non-PPR leagues? One way is to use
VBD, which is a measure of how much value a player provided over the worst starter (or some other baseline). For example, Welker scored 173 fantasy points and ranked as WR12 in non-PPR leagues last season. If you are in a start-three wide receiver league, the worst starter would be WR36, who scored 111 fantasy points. That means Welker provided 62 points of VBD.
[continue reading…]
Tagged as:
Broncos,
Footballguys.com,
RPO 2013,
VBD,
Wes Welker
{ }
by Chase Stuart
on July 21, 2013
For eleven straight years, I’ve written an article called “Defensive Team By Committee.” This year’s version is up at Footballguys.com (subscriber only).
Fantasy defenses are inconsistent from year to year, making it difficult to predict which defenses and special teams (D/STs) will excel. And, at least in theory, the teams available at the ends of your drafts should provide less rewards. So how do you get great production out of the position while saving your most important draft picks?
We spend countless hours analyzing team offenses, and relatively few thinking about team defenses. But an average defense against a bad offense will do just as well as a great defense against an average offense. The key to the DTBC system is to find two teams available late in your draft whose combined schedule features predominantly weak offenses. By starting your defense based on matchups, your D/ST will generally face a weak offense, meaning your D/ST position will score lots of fantasy points.
You can read my two picks, along with a ranking of all 496 combinations, here.
For you iPad users our there, I’ll also recommend the $4.99 Footballguys Fantasy Football Magazine Draft Kit, an awesome resource at a super cheap cost. That includes the Draft GM Kit, which you can separately order if (like me) you don’t have an iPad but do have an iPhone. Both products will also be available on Android very soon, if not already by the time you read this. You can receive all Footballguys updates by signing up on the Free Footballguys Daily E-mail list.
Tagged as:
Footballguys.com
{ }
by Chase Stuart
on July 14, 2013
[Note: For the rest of the year, content over at Footballguys.com is subscriber-only.]
Over at Footballguys.com, I build upon Joe Bryant’s VBD and create the idea of Expected VBD. While VBD is a great way to understand the value of players, Expected VBD explains how we draft. This concept is why even though you may expect some kickers and fantasy defenses to perform well, you don’t take them early in the draft because they have low Expected VBDs. So what is Expected VBD?
Instead of drafting according to strict VBD, you should be drafting to something I’ll call Expected VBD, which is best defined by an example. Suppose Russell Wilson has three equally possible outcomes this year: he has a one-in-three chance of scoring 425 fantasy points, 325 fantasy points, and 225 fantasy points. Further, let’s assume that the baseline number of fantasy points at the quarterback position is 300 fantasy points.
We would project Wilson to score 325 points, which would be the weighted average of his possible outcomes. This means VBD would tell you that he is worth 25 points, because 325 is 25 points above the baseline. Expected VBD works like this: If Wilson scores 425 points, he’ll produce 125 points of VBD. If he scores only 325 points, he’ll be worth +25, and if he scores only 225 points, he’s going to have -125 points of VBD. In real life, players with negative VBD scores can be released or put on your bench. So if Wilson scores 225 points (probably due to injury), you’ll start another quarterback, roughly a quarterback who can give you baseline production.
So when Wilson scores 225 fantasy points, his VBD is 0, not -75. That means his Expected VBD would be (125+25+0)/3, or 50. Wilson’s VBD according to our projections may be only 25, but his Expected VBD is twice as large because Expected VBD does not provide an extra penalty for sub-baseline performances. Not surprisingly, different positions have different amounts of Expected VBD associated with them.
Below is the summary graph — it has quickly become one of my all-time favorite graphs — which shows the Expected VBD by each position according to Average Draft Position.

I go into much more detail in the full article.
Tagged as:
Footballguys.com
{ }
by Chase Stuart
on June 16, 2013
Over at Footballguys.com, I look at a different method to project receiving yards.
The number of receiving yards a player produces is the result of a large number of variables. Some of them, like the receiver’s ability, are pretty consistent from year to year. But other factors are less reliable, or less “sticky” from year to year. I thought it would be informative to look at three key variables that impact the number of yards a wide receiver gains and measure how “sticky” they are from year to year. These three variables are:
- The number of pass attempts by his team;
- The percentage of his team’s passes that go to him; and
- The receiver’s average gain on passes that go to him.
We can redefine receiving yards to equal the following equation:
Receiving yards = Receiving Yards/Target x Targets/Team_Pass_Att x Team_Pass_Att.
You’ll notice that Targets and Team Pass Attempts are in both the numerator and denominator of one of the fractions, and they will cancel each other out: that’s why this formula is equivalent to receiving yards.
By breaking out receiving yards into these three variables, we can then examine the stickiness of each one, which should help our Year N+1 projections. Below are the best-fit equations for each of those variables in Year N+1:
Future Pass Attempts = 36 + (450 x Pass_Attempts/Play) + (0.255 x Offensive Plays)
Future Percentage of Targets = 6.2% + 71.3% x Past Percentage of Targets
Future Yards/Target = 5.5 + 0.29 x Past Yards/Targets
I then used those three equations to come up with a starting point for receiving yards projections for 28 wide receivers. You can read the full article here.
Tagged as:
Footballguys.com
{ }
by Chase Stuart
on June 2, 2013
Over at Footballguys.com, I explain my method of how to value a player that we know is going to a certain number of games. You can’t simply use the player’s projected number of fantasy points because that will underrate him. But if you go by his projected points per game average, he’ll be overrated. Using Rob Gronkowski as an example, I explained my method:
First, you need to determine the fantasy value of a perfectly healthy Gronkowski. Prior to today’s news, David Dodds had projected Gronkowski to record 70 catches for 938 yards and 9 touchdowns… but in only 14 games. This means Dodds had projected the Patriots star to average 10.6 FP/G in standard leagues, 15.6 FP/G in leagues that award one point per reception, and 18.1 FP/G in leagues like the FFPC that give tight ends 1.5 points per reception.
But those numbers aren’t useful in a vacuum: the proper way to value a player isn’t to look at the number of fantasy points he scores. Instead, the concept of VBD tells us that a player’s fantasy value is a function of how many fantasy points he scores relative to the other players at his position. I like to use a VBD baseline equal to that of a replacement player at the position, and “average backup” is a good proxy for that. In a 12-team league that starts one tight end with no flex option, that would be TE18. In standard leagues, TE18 on a points per game basis is Brandon Myers, the ex-Raiders tight end now with the Giants. Footballguys projects Myers to average 5.4 FP/G in standard leagues and and 8.9 FP/G in PPR leagues. In 1.5 PPR leagues, Martellus Bennett comes in at TE18 in our projections, with an average of 10.6 FP/G.
You can read the full article, which includes a neat table, here.
Tagged as:
Footballguys.com,
Rob Gronkowski
{ }
by Chase Stuart
on June 2, 2013
At Footballguys.com, I explain why fantasy football owners need to understand the concept of regression to the mean. Readers of this blog probably don’t need the long background, but you might enjoy some of the graphs at the end. For example, this is the distribution of yards per carry in Year N and yards per carry in Year N+1:

You can read the full article here.
Tagged as:
Footballguys.com
{ }
by Chase Stuart
on May 26, 2013
Over at Footballguys.com, I identified which quarterback statistics are repeatable and which ones are most likely to regress to the mean. I also ran a regression using touchdown length as my input and future touchdowns as my output.
From 1990 to 2011, 188 different quarterbacks started at least 14 games and thrown 300+ passes in one year, and then attempted at least 300 passes for the same team the next season. After analyzing the lengths of each touchdown pass for those quarterbacks, I discovered the following:
- For every one-yard touchdown pass in Year N, expect 0.70 touchdowns in Year N+1
- For every two-to-five-yard touchdown pass in Year N, expect 0.56 touchdowns in Year N+2
- For every six-to-ten-yard touchdown pass in Year N, expect 0.77 touchdowns in Year N+2
- For every 11-to-20-yard touchdown pass in Year N, expect 0.70 touchdowns in Year N+2
- For every 21-to-30-yard touchdown pass in Year N, expect 0.22 touchdowns in Year N+2
- For every 31-to-50-yard touchdown pass in Year N, expect 0.33 touchdowns in Year N+2
- For every 50+ yard touchdown pass in Year N, expect 0.33 touchdowns in Year N+2
If a team throws touchdowns from inside the red zone, that reveals an offensive philosophy that is good for your fantasy quarterback. On the other hand, 21+ yard touchdowns might make the highlight feels, but are very unpredictable from year to year. What does that mean for 2013?
You can view the full article here.
Tagged as:
Footballguys.com
{ }
by Chase Stuart
on May 23, 2013
Last night, I recorded a podcast with my fellow Footballguys staffers Sigmund Bloom and Matt Waldman. You can listen to it here.
Tagged as:
Footballguys.com,
Matt Waldman,
Sigmund Bloom
{ }
by Chase Stuart
on May 19, 2013
Over at Footballguys.com, I analyzed how the fantasy value of quarterbacks, running backs, wide receivers, and tight ends have changed since 1990. The NFL is a very different beast than it was 23 years ago, but you might be surprised to see what that means for fantasy football. To measure value, I examined the VBD curves for each of the four major positions in fantasy football.
For those unfamiliar with VBD, you can read Joe Bryant’s landmark article here. The guiding principle is that the value of a player is determined not by the number of points he scores but by how much he outscores his peers at his particular position. This means that in a league that starts 12 quarterbacks, each quarterback’s VBD score is the difference between his fantasy points and the fantasy points scored by the 12th best quarterback. The cut-offs at the other positions are 12, 24, and 36, for tight ends, running backs, and wide receivers, respectively.
The NFL in 2013 won’t closely resemble how the league looked in 1990, but what does that mean for fantasy football? To determine that, we need to see if VBD has evolved with the rest of the football statistics. Let’s start with a graph displaying number of fantasy points scored by the last starter at each position since 1990. As you can see, quarterback scoring has risen significantly over the last two decades, and the production of the 12th tight end has nearly doubled over that time period.

You can see the full article here.
Tagged as:
Footballguys.com
{ }
by Chase Stuart
on May 5, 2013
As most of you know, I also write for Footballguys.com, what I consider to be the best place around for fantasy football information. If you’re interested in fantasy football or like reading about regression analysis, you can check out my article over at Footballguys on how to derive a better starting point for running back projections:
Most people will use last year’s statistics (or a three-year weighted average) as the starting point for their 2013 projections. From there, fantasy players modify those numbers up or down based on factors such as talent, key off-season changes, player development, risk of injury, etc. But in this article, I’m advocating that you use something besides last year’s numbers as your starting point.
There is a way to improve on last year’s numbers without introducing any subjective reasoning. When you base a player’s fantasy projections off of his fantasy stats from last year, you are implying that all fantasy points are created equally. But that’s not true: a player with 1100 yards and 5 touchdowns is different than a runner with 800 yards and 10 touchdowns.
Fantasy points come from rushing yards, rushing touchdowns, receptions, receiving yards, and receiving touchdowns. Since some of those variables are more consistent year to year than others, your starting fantasy projections should reflect that fact.
The Fine Print: How to Calculate Future Projections
There is a method that allows you to take certain metrics (such as rush attempts and yards per carry) to predict a separate variable (like future rushing yards). It’s called multivariate linear regression. If you’re a regression pro, great. If not, don’t sweat it — I won’t bore you with any details. Here’s the short version: I looked at the 600 running backs to finish in the top 40 in each season from 1997 to 2011. I then eliminated all players who did not play for the same team in the following season. I chose to use per-game statistics (pro-rated to 16 games) instead of year-end results to avoid having injuries complicated the data set (but I have removed from the sample every player who played in fewer than 10 games).
So what did the regression tell us about the five statistics that yield fantasy points? A regression informs you about both the “stickiness” of the projection — i.e., how easy it is to predict the future variable using the statistics we fed into the formula — and the best formula to make those projections. Loosely speaking, the R^2 number below tells us how easy that metric is to predict, and a higher number means that statistic is easier to predict. Without further ado, in ascending order of randomness, from least to most random, here is how to predict 2013 performance for each running back based on his 2012 statistics:
You can read the full article here.
Tagged as:
Footballguys.com
{ }
by Chase Stuart
on August 22, 2012
Here’s the short sell: If you are a serious fantasy football player, you’ll find that Footballguys.com has more content and is more analytical than any other fantasy site. If you are a casual fantasy footballer, you’ll find that the tools available at Footballguys will make it easy for you to stay atop your league. Either way, a subscription is a fantastic value.
As for the longer sell: Before the New York Times, before Smart Football, and before Pro-Football-Reference, I was an aspiring young football writer with more energy than brains and more curiosity than experience. For reasons unbeknown to most everyone, Footballguys asked me in the summer of 2002 to join their staff. I’ve been affiliated with the site ever since. At the time, Footballguys was the best known secret in fantasy football; now it’s simply the best product in the industry. I continue to publish articles there, although all my non-fantasy work is published here.
I don’t receive anything or make extra money if more people sign up for Footballguys, but I hope my readers subscribe because it’s simply a good use of your money. If you play fantasy football and want to win your competitive league or save hours doing research for your local league, a Footballguys subscription is well worth it. For $28.95, you get:
- Constantly up to date and informed projections and rankings, along with 50,000 + pages of Footballguys Insider content.
- The Footballguys Draft Dominator (the single most valuable tool in all of fantasy football, IMO), along with the Lineup Dominator and Projections Dominator. Even if you don’t sign up for Footballguys, you can still use the ultra-cool Rate My Team application for free.
- The Footballguys Insiders contest, giving you a chance at over $35,000 in prizes — this is 100% free to subscribers.
- During the season, My FBG is a fantastic customizable tool that makes roster management incredibly easy. If you’re in multiple fantasy leagues, this is a lifesaver, and can be fully integrated with certain league management systems.
- I won’t list every reason to sign up, but you can check out the Why Subscribe? link or just play around on the FBG homepage.
- In addition to everything else, a money-back guarantee. In the 10 years I’ve been at Footballguys, they’ve always offered this feature, and it’s almost never used. There’s a reason for that.
Anyway, I’m not very good at the salesman thing, so I’ll end it here.
Tagged as:
Footballguys.com
{ }